
Abstract
Background
While PCSK9 inhibition has proven safe and effective, there is limited research on using intravascular ultrasound (IVUS) to assess the impact of atorvastatin combined with PCSK9 inhibitors on borderline coronary lesions.
Methods
From June 2022 to June 2025, a detailed analysis of biochemical markers, coronary angiography (CAG), and IVUS was conducted on 69 patients with borderline coronary lesions after different treatments.
Results
Of the 69 patients enrolled, 60 completed the 48-week study. All groups showed significant low-density lipoprotein cholesterol (LDL-C) reductions, with Group C (Alirocumab + Atorvastatin) having the largest decrease from 3.64 to 1.48 (P < .001). At 48 weeks, arterial lumen volumes increased in all groups, but Group C's was significantly larger than Groups A (Alirocumab + placebo) and B (Atorvastatin + placebo) (P = .038). Group C also had a greater reduction in plaque volume compared to Groups A and B (P = .041).
Conclusion
Alirocumab and Atorvastatin together significantly lowered LDL-C levels and improved the vascular environment, notably reversing plaque in patients with borderline coronary lesions.
Keywords
Introduction
Coronary artery disease (CAD) is a leading cause of cardiovascular deaths globally. 1 From 1990 to 2019, cardiovascular disease cases rose from 271 million to 523 million, with deaths increasing from 12.1 million to 18.6 million. 2 Plaque stability and regression are vital indicators of CAD. 3 According to the 2022 China Health and Wellness Statistics Yearbook, cardiovascular diseases persist as the foremost cause of mortality, accounting for 48.98% of deaths in rural areas and 47.35% in urban areas in 2021. 4 Research is focused on early CAD diagnosis and interventions to slow plaque progression.
LDL-C is crucial in atherosclerotic plaque formation and a major CAD risk factor. CAD treatment focuses on lowering LDL-C, primarily using statins like atorvastatin. High LDL-C accounts for 41.9% of CAD risk and 9.6% of stroke risk.1, 5 Effective LDL-C management is vital for preventing cardiovascular diseases, with studies showing that lipid-lowering therapies (LLT) reduce mortality and major cardiovascular events.6–9 Current guidelines prioritize statins for CAD treatment. For statin-intolerant patients or those not meeting LDL-C targets, alternatives like ezetimibe, PCSK9 monoclonal antibodies (PCSK9 mAbs), and bempedoic acid are recommended. For patients with high baseline LDL-C, a combination of statins and ezetimibe is suggested initially. If LDL-C remains at or above 1.4 mmol/L (55 mg/dL), adding PCSK9 inhibitors is advised. For patients on statins with LDL-C levels ≥ 2.6 mmol/L (100 mg/dL), if ezetimibe is unlikely to meet LDL-C targets, starting a combination of statins and PCSK9 inhibitors is recommended.10–17
Managing patients with borderline coronary artery disease (50%-70% stenosis) is challenging. Lesions over 70% often require intervention, but those in the 50%-70% range, though usually asymptomatic, can progress and complicate treatment decisions. PCSK9 inhibitors like evolocumab and alirocumab, along with small interfering RNA (siRNA) therapies, offer promising options for lowering LDL-C and treating atherosclerosis. Alirocumab, in particular, effectively reduces LDL-C by targeting PCSK9 and shows potential in preventing cardiovascular disease, especially when used with statins in an intensified LLT.18–21 Studies suggest that intensified LLT can reduce atherosclerotic plaque volume and enhance cardiovascular protection.22,23 However, there is limited research on the combined use of statins and PCSK9 inhibitors in patients with borderline coronary lesions.24–26
This study explores early intervention strategies for borderline coronary artery disease, focusing on LDL-C reduction, plaque reversal, and improved cardiovascular outcomes. It also provides insights into managing severe lesions. Using IVUS imaging, 27 the study assesses the effectiveness of combining alirocumab and atorvastatin in reversing plaques, comparing three treatment regimens to develop personalized strategies for patients with borderline coronary lesions.
Materials and Methods
Study Population
From June 2022 to June 2025, The First Hospital of Nanchang City conducted over 2000 CAG diagnostic cases, finding 21.1% (422 cases) with 50%-70% luminal stenosis, indicating borderline coronary lesions. Following CAG, 90% of chronic coronary syndrome (CCS) patients received standard statin therapy, while the use of PCSK9 inhibitors outside of this trial was infrequent due to cost considerations and clinical guidelines. PCI was generally indicated for patients with lesions exceeding 70% stenosis or those with clinical symptoms refractory to medical therapy. A total of 69 patients who underwent CAG and intravascular ultrasound (IVUS) were observed over a 48-week period. Participants were randomly assigned in a 1:1:1 ratio to one of three treatment groups. Group A received alirocumab (75 mg, administered biweekly via subcutaneous injection) in conjunction with a placebo (one oral tablet nightly). Group B was administered atorvastatin (20 mg, one oral tablet nightly) along with a placebo (1 mL subcutaneous injection biweekly). Group C received both alirocumab (75 mg, subcutaneous injection biweekly) and atorvastatin (20 mg, one oral tablet nightly). The treatment regimen was implemented over a 48-week period. Atorvastatin (Lipitor, 20 mg per tablet) was provided by Pfizer, while alirocumab (Praluent, 75 mg per 1 mL) was supplied by Sanofi-Aventis Groupe. Prior to study participation, written informed consent was obtained from all patients. Placebos were formulated to resemble atorvastatin and alirocumab in appearance and were administered accordingly. The oral placebo consisted of an inert lactose-based tablet identical in size, color, and film coating to atorvastatin, and was dispensed nightly. The injection placebo comprised 1 mL of normal saline in pre-filled syringes identical to those used for alirocumab, administered biweekly via subcutaneous injection.
Inclusion Criteria: (1) All participants satisfied the criteria for CCS, defined as stable angina or its equivalent, with no myocardial infarction or unstable symptoms in the preceding 30 days. Participants were aged between 40 and 80 years. (2) presence of at least one coronary artery with 50%–70% stenosis (non-percutaneous coronary intervention target vessel), with the target lesion segment length being ≥30 mm. (3) Patients who have not undergone statin therapy and present with an LDL-C level of ≥3.4 mmol/L, those who have received statin therapy and exhibit an LDL-C level of ≥2.6 mmol/L, or individuals anticipated to fail to achieve adequate LDL-C targets following the addition of ezetimibe to statin therapy.12–17,28,29 (4) Willingness to participate in the study and provision of written informed consent.
Exclusion Criteria: (1) Severe calcified or tortuous lesions; lesions located at the coronary artery ostium, distal regions, or venous grafts; patients requiring complete revascularization for multivessel disease. (2) Acute myocardial infarction within the past month. (3) Malignant tumors, hematologic malignancies, or autoimmune diseases. (4) Severe liver dysfunction (alanine aminotransferase (ALT) > 3 times the upper normal limit), active liver disease, or renal dysfunction (eGFR < 60 mL/min/1.73 m²). (5) Initiation of PCSK9 inhibitor therapy prior to enrollment. (6) Hypersensitivity or contraindications to any study medication. (7) Pregnancy or breastfeeding. (8) Participation in other clinical trials. (9) Poor medication adherence or refusal to participate.
Detailed inclusion and exclusion criteria are provided in Table 1.
Inclusion and Exclusion Criteria.

Follow-Up
Upon enrollment, all patients commenced the follow-up phase, which spanned a total duration of 48 weeks. Follow-up was executed through a combination of telephone interviews and outpatient visits. Telephone follow-ups were conducted every 1-2 months between study visits to evaluate medication adherence and monitor adverse events. During the follow-up period, the following parameters were assessed: ALT, serum creatinine (SCr), creatine kinase-MB (CK-MB), total cholesterol (TC), LDL-C, high-density lipoprotein cholesterol (HDL-C), and IVUS measurements, including vascular lumen volume and atherosclerotic plaque volume. Additionally, adverse reactions associated with the medication were monitored, encompassing injection site reactions, allergic reactions, gastrointestinal symptoms, new-onset diabetes, myalgia, neurocognitive dysfunction, and transaminase levels exceeding three times the upper normal limit.
Methods
IVUS Examination
Procedure
After CAG, a bolus injection of 100-120 U/kg heparin was administered. A 0.014-inch guidewire was advanced to the distal segment of the target vessel. Following a routine coronary artery injection of 0.2 mg nitroglycerin, the ultrasound catheter with a transducer was advanced along the guidewire to the distal end of the target lesion, at least 1 cm beyond the lesion. The initial position for imaging was recorded under fluoroscopy and used as a reference for subsequent follow-up. The IVUS system was provided by Shenzhen Northchip Life Science Co., Ltd and consisted of the TRUEVISION™ IVUS catheter and the VivoHeart™ IVUS main unit, with image analysis performed on the inSmartVision platform. All ultrasound images were obtained through automated catheter withdrawal at a rate of 0.5 mm/s. Imaging began 1 cm distal to the target lesion and ended 1 cm proximal to the lesion in a normal arterial segment. IVUS grayscale and VH images were recorded on DVD for offline analysis. The follow-up procedure at 48 weeks was performed identically to the initial examination.
IVUS Image Requirements
The entire plaque should be included in a single recording. During the IVUS examination, saline or contrast agents should not be injected through the catheter. The position marker of the IVUS catheter and the clearest coronary angiographic image of the vessel branches should be retained for offline analysis. Relevant vessels must be clearly marked on the images.
Plaque Identification and Matching
The target plaque was defined as a localized stenosis of 50%-70% with plaque accumulation (plaque thickness ≥ 0.5 mm) on CAG. The reference vessel, defined as a normal or near-normal segment, was considered to have a plaque thickness of ≤0.3 mm within a 10 mm range, with no major branch vessels. For each patient, one vessel segment was selected for analysis. IVUS matching during the follow-up period and baseline state was primarily based on the aforementioned positioning method and plaque morphology characteristics, as shown in Figure 1.

Selection and Measurement of the Vascular Segment. The Upper-Left Panel Displays a Cross-Sectional View of the Vascular Segment, Where the Yellow Circle Represents the Lumen, the Green Circle Denotes the Vessel Wall, and the Plaque is Located Between the Yellow and Green Circles. The Upper-Right Panel Shows a Digital Subtraction Angiography Image. The Lower Panel Illustrates the Longitudinal View of the Vascular Segment, With the Orange Segment Indicating a Lumen Area of Less Than 4.0 mm², the Green Segment Representing a Plaque Burden of ≥70%, and the Blue Segment Denoting a Plaque Burden of ≥50%.
IVUS Analysis and Standard Measurement Protocol
IVUS image analysis was conducted using the inSmartVision platform, measuring lesion length, minimal lumen diameter (MLD), minimal lumen area (MLA), plaque burden, remodeling index, and plaque volume. Lesion length was determined via automated pullback recordings. MLD and MLA were measured at the narrowest point, with MLA assessing stenosis severity. Plaque burden was calculated as [(EEM CSA − Lumen CSA) / EEM CSA] × 100, with ≥70% indicating vulnerable plaques. The remodeling index (RI) is the ratio of the external elastic membrane (EEM) cross-sectional area (CSA) at the lesion to the average EEM CSA of nearby reference segments. An RI >1.05 indicates positive remodeling, while RI <0.95 indicates negative remodeling. Plaque volume is measured using the Simpson method, summing plaque area (EEM CSA − Lumen CSA) across 1 mm cross-sections. Total plaque volume (TAV) and percent atheroma volume (PAV) are calculated as TAV = ∑(EEM CSA − Lumen CSA) and PAV (%) = [∑(EEM CSA − Lumen CSA)/∑EEM CSA] × 100. Plaque and reference segment locations are determined by standards from the American Society of IVUS Analysis and the Chinese Expert Consensus on IVUS in Coronary Artery Disease (2018).30,31 The measurement protocol is illustrated in Figure 2.
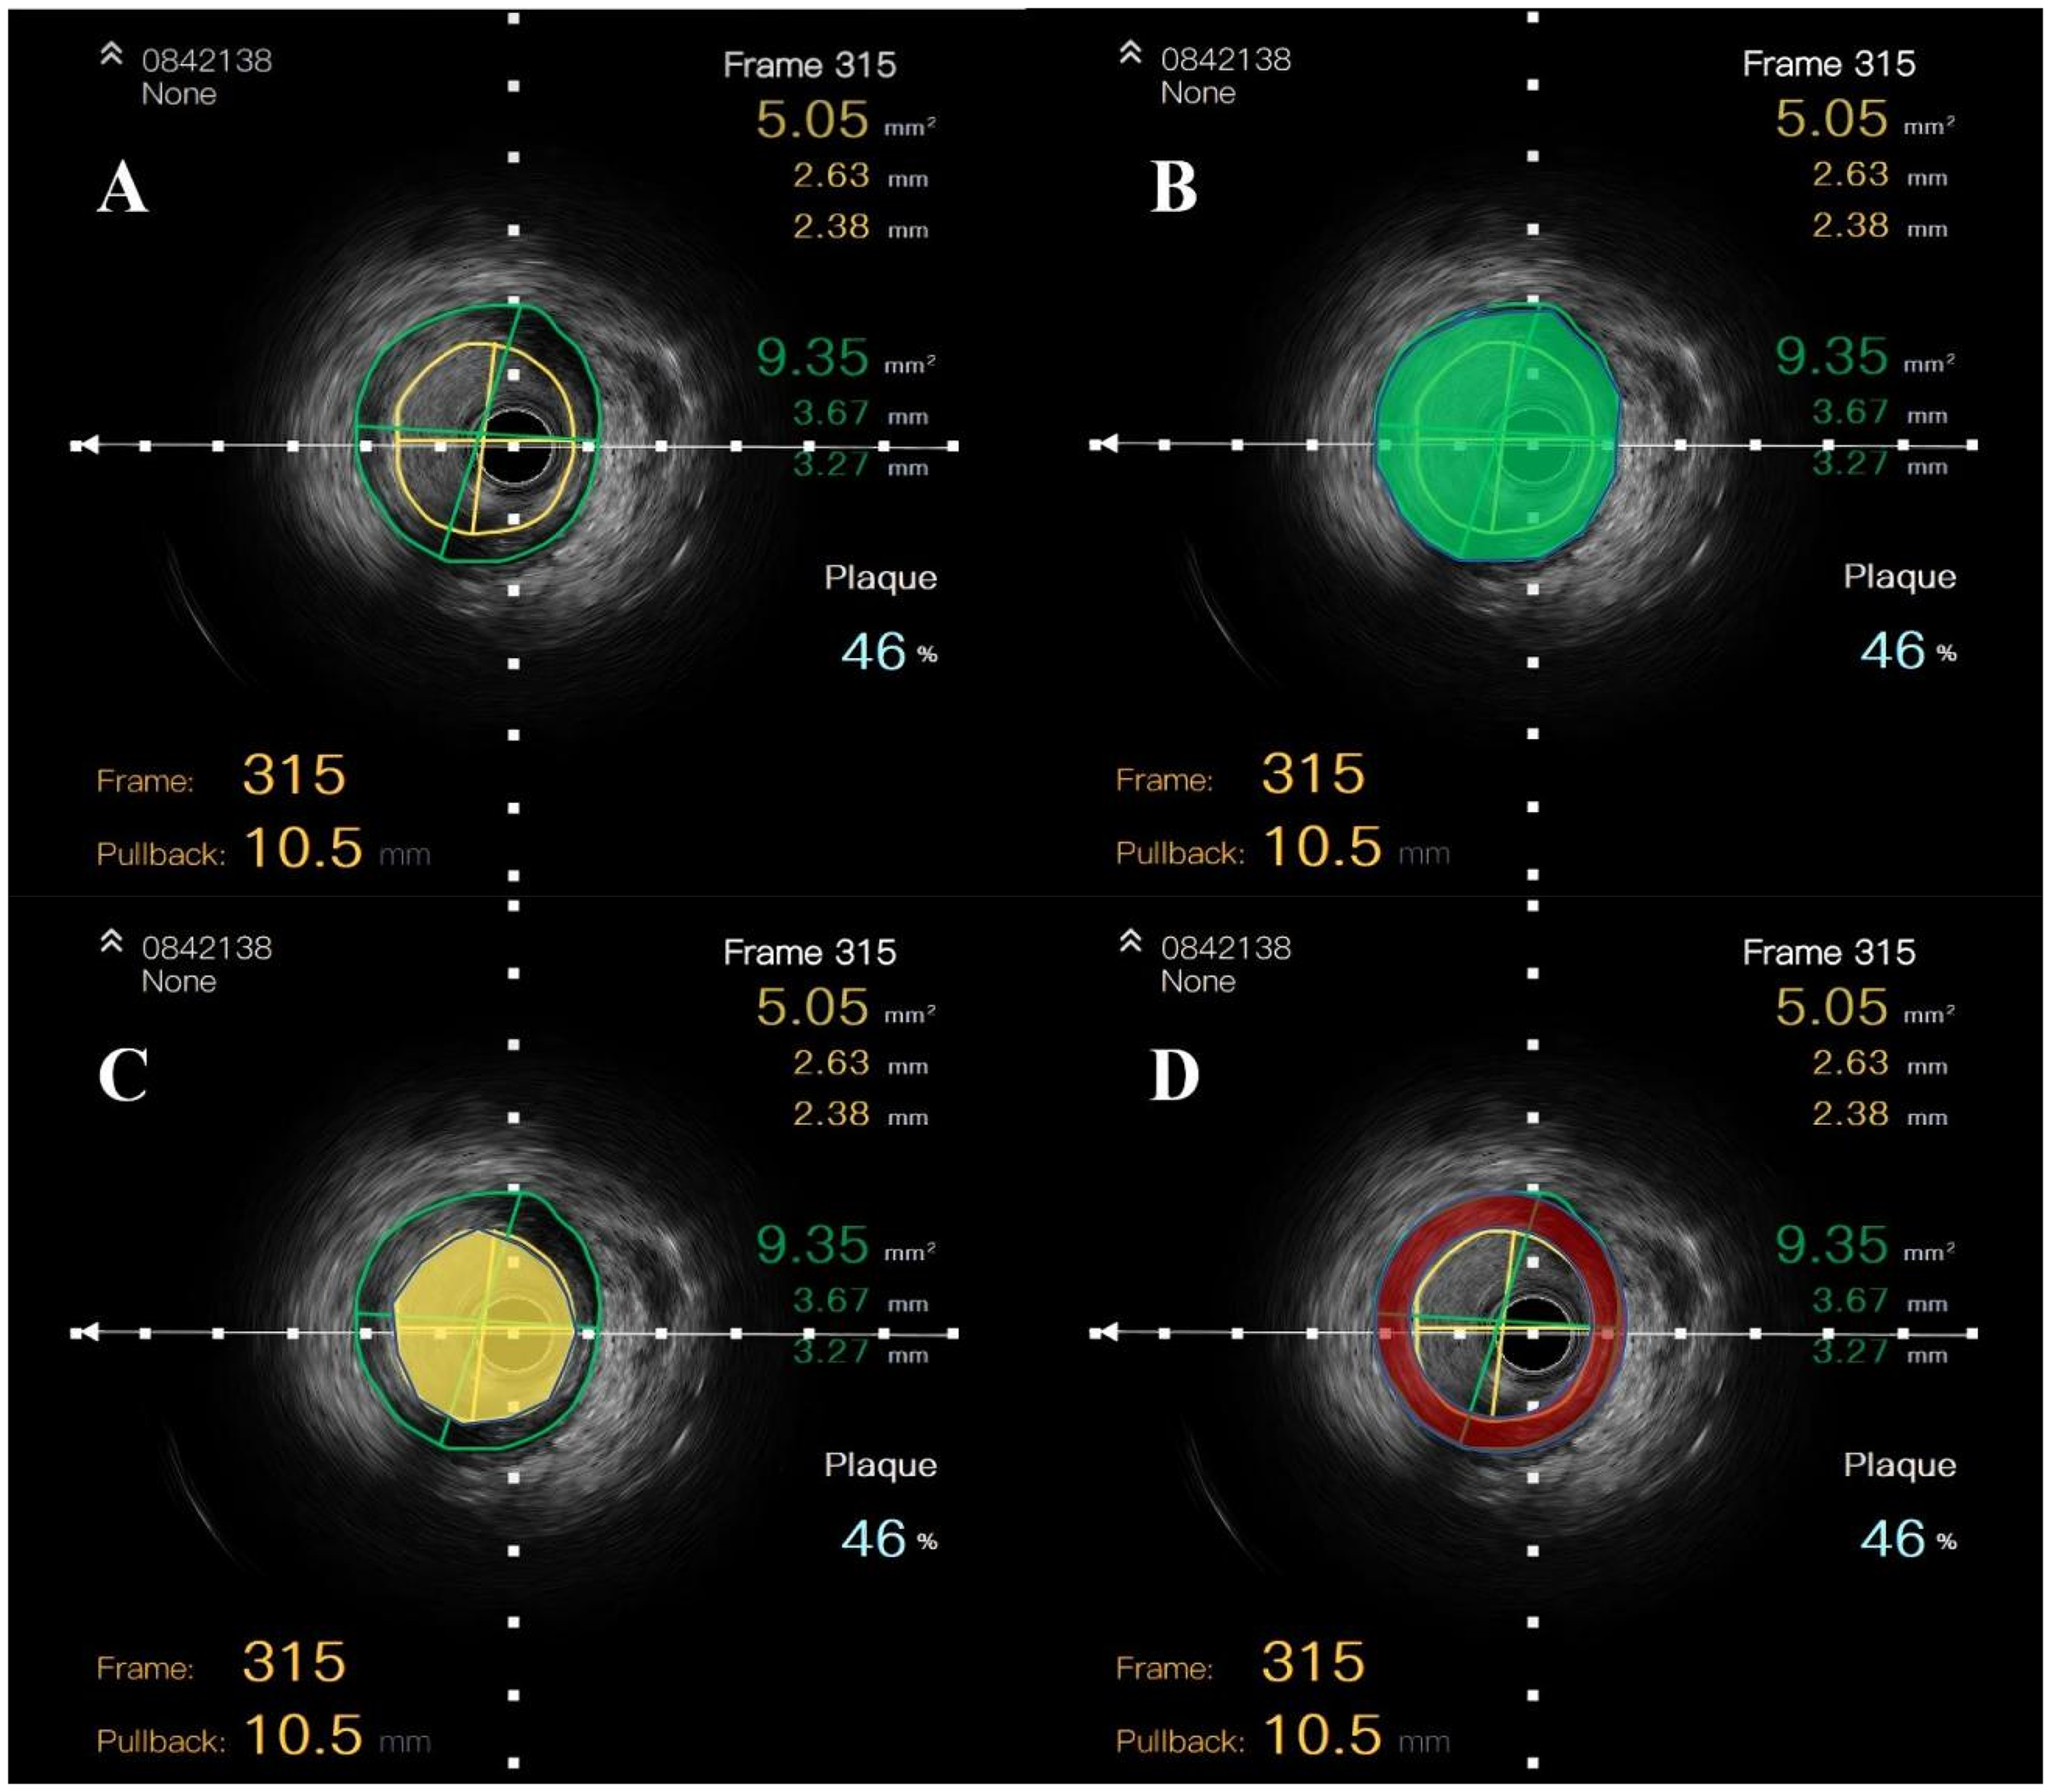
Quantitative Analysis of IVUS Gray-Scale Images. The Vessel and Lumen Boundaries are Marked by Green and Yellow Circles, Respectively (A). The Green Circle Indicates the Vessel Area (B), While the Yellow Circle Shows the Lumen Area (C). The Red Area Between Them Represents the Plaque Area (D). Volumes Are Calculated Using Offline Software from Single-Frame Images: Vessel Volume = ∑ Vessel Area, Plaque Volume = ∑ (Vessel Area − Lumen Area).
Laboratory Parameter Assessment
Fasting venous blood samples (3-5 mL) were collected from all patients scheduled for CAG in the early morning and sent to the Department of Laboratory Medicine at Nanchang First Hospital for analysis. Baseline levels of ALT, SCr, CK-MB, TC, LDL-C, and HDL-C were measured. eGFR was calculated using the Chronic Kidney Disease Epidemiology Collaboration (CKD-EPI) formula. For patients meeting the inclusion criteria, these biochemical parameters were reassessed at 24 and 48 weeks post-treatment at the Department of Laboratory Medicine, Nanchang First Hospital. If serum transaminase levels increased to more than three times the upper normal limit during the 48-week follow-up, statin therapy was discontinued, and follow-up was terminated.
Statistical Analysis
Data were analyzed using SPSS Statistics 29.0 and GraphPad Prism 9 software. Normality of continuous variables was assessed, and normally distributed data were expressed as means ± standard deviation (x̄ ± s). Between-group comparisons of means were performed using one-way ANOVA, and within-group comparisons were conducted using paired t-tests. For non-normally distributed continuous variables, data were expressed as medians and interquartile ranges (M [P25, P75]), with differences compared using the Wilcoxon rank-sum test. Categorical variables were presented as frequencies and percentages (%), with between-group comparisons performed using the effect sizes were calculated using Cohen's d for pairwise comparisons and eta-squared (η²) for ANOVA results to assess the magnitude of treatment effects. A P-value of <.05 was considered statistically significant.
Results
Baseline Characteristics
Of the initial cohort of 69 patients, one patient was withdrawn from the study due to ALT levels exceeding three times the upper normal limit, and two patients discontinued treatment due to the necessity for revascularization of the target vessels. Additionally, six patients were lost to follow-up. Consequently, 60 patients completed the entire follow-up period, with an average exposure duration to the study drug of 47.6 months. These 60 patients were allocated into three treatment groups: Group A (Alirocumab + placebo, n = 20), Group B (Atorvastatin + placebo, n = 20), and Group C (Alirocumab + Atorvastatin, n = 20). Statistical analysis revealed no significant differences among the groups concerning gender, age, hypertension, diabetes, statin use, or smoking history (P > .05), as detailed in Table 2.
Comparative Analysis of Clinical Baseline Characteristics.

Target Vessels
Among the 60 patients, a total of 68 target vascular segments were identified, averaging 1.13 segments per patient. Randomization balanced the slight differences in total lesion burden. The lesion distribution was as follows: 41 segments (60.3%) in the left anterior descending artery (LAD), 13 segments (19.1%) in the left circumflex artery (LCX), and 14 segments (20.6%) in the right coronary artery (RCA). No significant differences were observed in lesion distribution across the three treatment groups, as detailed in Table 3.
Comparative Analysis of the Distribution of Lesions.

Laboratory Test Results
Of the 69 patients initially enrolled in the study, one patient discontinued treatment and follow-up due to ALT levels exceeding three times the upper normal limit, and two patients were excluded from follow-up because they required revascularization of the target vessel. Additionally, six patients were lost to follow-up. Consequently, 60 patients completed the entire follow-up period, with a mean exposure duration to the study drug of 47.6 months.
Baseline laboratory parameters, including ALT, eGFR, CK-MB, TC, LDL-C, and HDL-C did not differ significantly across the three groups prior to treatment (P > .05). However, after 24 and 48 weeks of treatment, significant changes in ALT, TC, and LDL-C levels were observed compared to baseline (P < .05), with LDL-C levels demonstrating statistically significant alterations at both 24 and 48 weeks (P < .05).
In terms of ALT levels, a statistically significant increase was observed in Group B after 48 weeks of treatment, with mean ALT levels rising from baseline (M = 33.23, SD = 9.09) to week 48 (M = 45.74, SD = 14.33), [t(19) = −3.043; 95% CI: −21.12 to −3.91; P = .007; d = 0.68]. Similarly, Group C exhibited a significant elevation in ALT levels from baseline (M = 33.17, SD = 7.76) to week 48 (M = 42.13, SD = 12.85), [t(19) = −2.523; 95% CI: −16.40 to −1.53; P = .021; d = 0.56] (refer to Figure 3). In contrast, Group A did not demonstrate a significant change in ALT levels, indicating that the observed increases in Groups B and C may be attributable to liver enzyme elevation associated with atorvastatin therapy.

Comparative Analysis of ALT, TC and LDL-C Levels Pre- and Post-Treatment. The Grouped Bar Chart Presents the Mean Levels of ALT, TC, and LDL-C for Treatment Groups (A) (Alirocumab + Placebo), (B) (Atorvastatin + Placebo), and (C) (Alirocumab + Atorvastatin) at the Baseline (Blue), 24 Weeks Post-Treatment (Green), and 48 Weeks Post-Treatment (Red). Data are Presented as Mean ± Standard Deviation (SD), with a Sample Size of n = 20 Per Group. Statistical Significance is Denoted as Follows: *P < .05, **P < .01, ***P < .001.
Furthermore, after 48 weeks of treatment, significant differences in TC and LDL-C levels were detected across all groups (P < .001). While no significant differences in TC levels were identified between the groups, significant inter-group differences were observed in LDL-C levels. Specifically, Group A experienced a significant reduction in LDL-C levels from baseline (M = 3.27, SD = 0.62) to week 48 (M = 1.75, SD = 0.35) (95% CI: 1.19-1.85; P < .001; d = 2.17). Similarly, Group B showed a significant decrease in LDL-C levels from baseline (M = 3.41, SD = 0.66) to week 48 (M = 1.93, SD = 0.43) (95% CI: 1.21-1.74; P < .001; d = 2.62). In Group C, LDL-C levels demonstrated a statistically significant reduction from baseline (M = 3.64, SD = 0.68) to week 48 (M = 1.43, SD = 0.34) (95% CI: 1.85-2.58; P < .001; d = 2.84). Post-treatment, LDL-C levels in Group C were significantly lower compared to those in Groups A and B (F(2, 57) = 9.026; P < .001; η2 = 0.241). A post-hoc Bonferroni analysis indicated that LDL-C levels in Group C (M = 1.43, SD = 0.34) were significantly lower than those in Group A (M = 1.75, SD = 0.35) (95% CI: −0.61 to −0.28; P = .027) and Group B (M = 1.93, SD = 0.43) (95% CI, −0.79 to −0.20; P < .001), with no significant difference observed between Groups A and B (95% CI: −0.47-0.12; P = .426) (Figure 3).
No significant differences were identified in other biochemical markers, including eGFR, CK-MB, and HDL-C (P > .05), as presented in Table 4.
Comparison of Laboratory Parameters Before and After Treatment.

IVUS Grayscale Measurements of the Target Lesion After 48 Weeks of Treatment
Following 48 weeks of treatment, IVUS assessments of lumen and plaque volumes in the target vessel segment were conducted on 60 patients, as detailed in Table 5. Initially, no significant differences in lumen or plaque volumes were noted among the groups (P > .05). Nevertheless, significant changes in lumen volume were observed across all three groups (A, B, and C) after 48 weeks of LLT (P < .05).
IVUS Grayscale Imaging Analysis.

Change in value = After 48 weeks of treatment − pre-treatment.
Percentage change = (after 48 weeks of treatment − pre-treatment)/pre-treatment × 100%.
In Group A, there was a statistically significant increase in lumen volume from baseline (M = 530.01, SD = 158.16) to 48 weeks (M = 561.6, SD = 166.7), with a percent change of 6.13% ± 3.49% [t(19) = −7.277; 95% CI: −40.68 to −22.50; P < .001; d = 1.63]. Similarly, Group B demonstrated a significant increase in lumen volume from baseline (M = 518.91, SD = 135.05) to 48 weeks (M = 536.7, SD = 139.87), with a percent change of 3.45 ± 4.18% [t(19) = −3.906; 95% CI: −27.32 to −8.26; P = .001; d = 0.87). Group C exhibited the most substantial increase, with a significant change in lumen volume from baseline (M = 576.32, SD = 87.98) to 48 weeks (M = 646.23, SD = 98.65), corresponding to a percent change of 12.19 ± 3.09% [t(19) = −16.482; 95% CI: −78.79 to −61.03; P < .001; d = 3.69).
A significant difference in lumen volume was observed among the groups at the 48-week follow-up (P = .038; η2 = 0.108). Post-hoc Bonferroni analysis indicated that Groups A (M = 561.6, SD = 166.7) and B (M = 536.7, SD = 139.87) had significantly lower lumen volumes compared to Group C (M = 646.23, SD = 98.65), with no significant difference detected between Groups A and B (P = 1.000).
Regarding plaque volume, Group A showed a significant reduction from baseline (M = 355.68, SD = 114.53) to 48 weeks (M = 285.46, SD = 96.21), with a percent change of −19.22 ± 12.08% [t(19) = 9.527; 95% CI: 54.87-85.57; P < .001; d = 2.14]. Group B demonstrated a decrease in plaque volume of −35.41 ± 25.46 mm² [t(19) = 6.220; 95% CI: 23.49-47.32; P < .001; d = 1.39], corresponding to a percent change of −10.81 ± 8.32%. In Group C, plaque volume decreased significantly from baseline (M = 343.02, SD = 118.29) to 48 weeks (M = 225.83, SD = 106.84), with a reduction of −117.18 ± 19.31 mm² and a percent change of −36.77 ± 9.38% [t(19) = 27.144; 95% CI: 108.15-126.21; P < .001; d = 6.07).
A significant difference in plaque volume reduction was observed among the groups [F(2, 57) = 3.374; P = .041; η2 = 0.106]. Post-hoc Bonferroni analysis indicated that Group C (M = 225.83, SD = 106.84) exhibited a more substantial reduction in plaque volume compared to both Group A (M = 285.46, SD = 96.21) and Group B (M = 314.63, SD = 125.53), as shown in Figure 4.

Example of IVUS Grayscale Imaging Before and After Treatment. IVUS Images for Patients in Group A (A and B), Group B (C and D), and Group C (E and F) are Shown, Comparing Conditions Before and After 48 Weeks of Treatment Using Highlighted Areas. Left Panels Show Pre-Treatment Images, While Right Panels Show Images After 48 Weeks.
Incidence of Adverse Drug Reactions During Treatment
During the treatment period, no significant adverse drug reactions were observed in Group A. In Group B, three patients experienced significant elevations in liver enzymes, and one patient reported muscle pain. In Group C, one patient experienced injection site pain, which gradually alleviated over approximately four days, another patient reported gastrointestinal symptoms, and a third exhibited mild elevations in liver enzymes. The overall incidence of adverse drug reactions differed significantly between the groups (P < .05). However, there were no significant differences in the incidence of other drug-related adverse events across the three groups (P > .05).
Discussion
This study utilized IVUS to evaluate the efficacy of a combined treatment regimen of atorvastatin and alirocumab in patients presenting with borderline coronary lesions. The findings indicated that the combination therapy (Group C) resulted in the most substantial reduction in LDL-C levels, enhancement in coronary atherosclerotic plaque volume, and stabilization of plaque characteristics, surpassing the effects observed with atorvastatin monotherapy and PCSK9 inhibitor monotherapy (Groups A and B). These outcomes were corroborated by IVUS measurements, which revealed that although all groups experienced improvements in vascular lumen volume, Group C demonstrated the most pronounced and statistically significant increase (P < .05). Regarding plaque volume reduction, Group C exhibited a significant decrease of −36.77 ± 9.38%, which was markedly greater than the reductions observed in Groups A and B.
Regarding safety, there were no significant differences in the incidence of adverse drug reactions among the three groups (P > .05). While ALT levels were significantly elevated in Groups B and C after 48 weeks of treatment, this change is likely attributable to atorvastatin's known hepatotoxicity. 32 These liver function changes highlight the potential risk of elevated liver enzymes when combining atorvastatin with PCSK9 inhibitors, but such changes did not significantly affect the overall safety profile. Importantly, no serious adverse events were reported, indicating that the combination therapy was well tolerated.
A large study using VH-IVUS analysis found that statins significantly alter coronary artery plaque composition, affecting fibrous tissue and necrotic core volume, though no differences were observed between statin subgroups. 33 A meta-analysis of 9 studies confirmed statins significantly impact plaque volume, outer elastic membrane, fibrous tissue, and calcification, but not fibrous lipids or necrotic core volume. 34 Statins lower cholesterol by inhibiting HMG-CoA reductase, reducing intracellular lipids, and increasing low-density lipoprotein receptor (LDLR) expression. 35 However, they may also upregulate PCSK9, which degrades LDL receptors, potentially reducing statins’ cholesterol-lowering efficacy.36–39*. Ezetimibe and bempedoic acid help stabilize and reduce atherosclerotic plaques by lowering cholesterol. Ezetimibe reduces LDL-C and plaque volume with statins by inhibiting Niemann-Pick C1-Like 1 (NPC1L1) and decreasing intestinal cholesterol absorption.40,41 Bempedoic acid lowers LDL-C by inhibiting ATP citrate lyase, complementing statins and other LLT. 42 While evidence for plaque regression is limited, the CLEAR program shows significant LDL-C and cardiovascular risk reduction. 43 Oral bile acid sequestrants mildly enhance cholesterol uptake by binding to bile acids. Despite their modest impact on plaque regression, they provide supplementary benefits for patients intolerant to statins. 44
Recent studies confirm that PCSK9 inhibitors are effective and safe for various patients.45–47 The 2019 ESC/EAS guidelines recommend early PCSK9 inhibitor use for coronary syndrome patients not reaching LDL-C targets with high-dose statins. 10 Mutations in LDLR-related genes elevate LDL-C levels, contributing to atherosclerosis, while the PCSK9 gene affects LDLR degradation in the liver. A study conducted in 2008 demonstrated that dysfunctional mutations in PCSK9 can enhance hepatic lipid metabolism and reduce LDL-C levels. 48 Moreover, the low expression mutation R46L is associated with a low LDL-C phenotype and can decrease the risk of ischemic heart disease by 30%. 49 PCSK9 plays a crucial role in cholesterol metabolism by mediating the degradation of LDLR. LDLR is responsible for binding LDL-C at the cell surface, facilitating its internalization and degradation, and subsequently recycling back to the cell membrane. An increase in intracellular cholesterol levels leads to an upregulation of PCSK9 precursor protein expression. This precursor undergoes spontaneous cleavage in the endoplasmic reticulum, resulting in the formation of protein complexes that inhibit the enzymatic activity of catalytic subunits. Concurrently, these complexes are secreted into the extracellular space. Extracellularly, PCSK9 molecules interact with LDLR via catalytic subunits, forming a PCSK9-LDLR-LDL-C complex that undergoes lysosomal degradation, thereby disrupting the LDLR recycling process. 50 The overexpression or activation of PCSK9 enhances the endocytosis and degradation of LDLR, impedes the clearance of LDL-C, and consequently elevates circulating LDL-C levels.
PCSK9 plays a crucial role in regulating LDLR, making it a key target for innovative lipid-lowering therapies. Inhibiting PCSK9 not only helps prevent LDLR degradation but also offers potential benefits by interacting with other proteins like CD36 and the major histocompatibility complex I. Current PCSK9 inhibitors include monoclonal antibodies, antisense oligonucleotides, siRNA, and small molecules. Monoclonal antibodies stand out for their specificity and low toxicity, while the siRNA drug Inclisiran is notable for targeting PCSK9 mRNA in hepatocytes, reducing PCSK9 protein production. Inclisiran offers advantages such as high stability, cost-effectiveness, and prolonged efficacy, with an administration regimen of a subcutaneous injection for 3 months followed by another injection every six months. In the Orion-9 and Orion-10 trials, Inclisiran reduced LDL-C by 41% in HeFH patients and 56% in ASCVD patients compared to the placebo.51,52
PCSK9 inhibitors not only target the core mechanisms of atherosclerosis but also reduce inflammation and improve vascular health by significantly lowering lipids. They achieve anti-inflammatory effects by inhibiting PCSK9, which normally promotes inflammatory cytokine secretion.
3
During early atherosclerosis, oxidized LDL (oxLDL) triggers inflammatory mediators. PCSK9 inhibitors can counteract this by modulating the NF-kB pathway and reducing inflammatory factors like IL-1α, IL-6, and TNF-α.
53
PCSK9 influences inflammatory responses by degrading apolipoprotein E receptor 2, which increases cholesterol in macrophages, activates the NF-kB pathway, and triggers inflammation.
54
It also boosts lipoprotein phagocytosis and stimulates pro-inflammatory pathways by affecting scavenger receptors like SR-A, CD36, and LOX-1 on macrophages.
55
Similar inhibitory effects are observed in pro-inflammatory T cells and dendritic cells, where PCSK9 inhibition mitigates oxLDL-mediated inflammatory responses and reduces immune cell activation.
56
PCSK9 plays a role in monocyte-driven inflammation, with increased PCSK9 levels in hyperlipidemic mice boosting monocyte infiltration into blood vessels.
57
PCSK9 mAbs can block this infiltration and lower chemokine (C-C motif) receptor 2 (CCR2) expression.
58
Although in vitro and animal studies link PCSK9 to inflammation, clinical evidence is limited. The anti-inflammatory effects of PCSK9 mAbs are not yet confirmed in high-quality trials, with current data suggesting they reduce inflammation mainly by lowering LDL-C.
59
Future large-scale international studies are needed to confirm these findings and assess long-term cardiovascular impacts. Combining atorvastatin with alirocumab effectively lowers LDL-C and reduces plaque but nearly doubles annual patient costs compared to statins alone. Future analyses should evaluate the cost-effectiveness per QALY gained to guide reimbursement and clinical decisions.
This study has several limitations: it was conducted at a single center with a small, mostly Asian sample, raising concerns about population homogeneity. The 48-week follow-up is too short to evaluate the long-term effectiveness and safety of combination therapy, especially for rare adverse events. Larger studies are needed to assess low-frequency risks such as neurocognitive and immunologic effects from prolonged PCSK9 inhibition, as well as long-term cardiovascular outcomes. Additionally, while IVUS and CAG are reliable for evaluating coronary lesions, their resolution and subjective interpretation may affect accuracy. Future studies could enhance accuracy by using advanced imaging techniques like NIRS-IVUS to better assess microstructural changes in coronary plaques.
In conclusion, our study shows that combining atorvastatin and alirocumab effectively lowers lipids, stabilizes plaques, and improves vascular volume in patients with borderline coronary lesions, without major liver or kidney side effects. This combination may be a safer, more effective treatment, but further large-scale trials are needed to confirm its long-term efficacy and safety.
Footnotes
Abbreviations
Ethics Approval and Consent to Participate
Everyone gave informed consent, and the plan has been approved by the Institutional Human Research Ethics Review Committee. Ethics acceptance number: KY2023021.
Consent to Participate
Informed consent was obtained from all individual participants included in the study.
Consent to Publish
The authors affirm that human research participants provided informed consent for publication of the images.
Author Contributions
Zeyu Xu: formal analysis, investigation, methodology, resources, validation, writing – original draft. Yi Fang: conceptualization, data management, formal analysis; investigation, and methodology. Yong Peng: data curation, project administration, software, supervision, and writing–review and editing. Chunhua Zhang: conceptualization, data management, formal analysis, investigation, and methodology. Chunhua Zheng: funding acquisition, methodology, project administration, supervision, writing–review and editing.
Funding
The authors disclosed receipt of the following financial support for the research, authorship, and/or publication of this article: This work was supported by the Key Projects of Nanchang Science and Technology Support Plan (grant number: 2022-KJZC-002).
Declaration of Conflicting Interests
The authors declared no potential conflicts of interest with respect to the research, authorship, and/or publication of this article.
Availability of Data and Material
An example of data can be made available upon request.60
Code Availability
All authors ensure that all data and materials, as well as software applications or custom code, support their published statements and comply with on-site standards.