
Abstract
Background:
The proprotein convertase subtilisin/kexin type 9 (PCSK9) inhibitor evolocumab reduces low-density lipoprotein cholesterol (LDL-C) and the risk of cardiovascular events.
Objectives:
To compare LDL-C reduction using evolocumab 140 mg once every 2 weeks (Q2W) or 420 mg monthly (QM) versus lower doses (70 mg Q2W or 280 mg QM) or placebo.
Methods:
Patients received evolocumab 70 or 140 mg Q2W, 280 or 420 mg QM, or placebo Q2W or QM in two 12-week phase 2 studies: one with and one without statins. Changes from baseline in LDL-C were compared across Q2W doses and across QM doses.
Results:
The analysis included 741 patients. Mean (95% confidence interval [CI]) reduction in LDL-C across Q2W visits through week 12 was 63.0% (60.3% to 65.7%) for evolocumab 140 mg Q2W, compared to 41.3% (38.6% to 44.0%) for 70 mg Q2W and 1.9% (4.6% reduction to 0.8% increase) for placebo Q2W (each P < .001 vs 140 mg Q2W), and 62.7% (60.1% to 65.3%) for 420 mg QM, compared to 55.5% (52.9% to 58.0%) for 280 mg QM and 2.5% (5.1% reduction to 0.1% increase) for placebo QM (each P < .001 vs 420 mg QM). Similar results were observed at the mean of weeks 10 and 12. In a subgroup (n = 151) with weekly assessments from weeks 8 to 12, mean (95% CI) peak effect on LDL-C reduction was 72.8% (67.7% to 77.9%) for 140 mg Q2W and 69.0% (63.6% to 74.3%) for 420 mg QM. Trough effect at week 12 underestimated LDL-C reduction. Median peak–trough variability was 20.5%, 21.1%, 31.9%, and 35.1% for evolocumab 140 mg Q2W, 420 mg QM, 70 mg Q2W, and 280 mg QM, respectively.
Conclusion:
Evolocumab 140 mg Q2W and 420 mg QM yielded similar LDL-C reduction. These doses sustained maximal LDL-C reduction, resulting in greater stability in LDL-C reduction over the dosing interval compared to lower doses. These results support evolocumab doses of either 140 mg Q2W or 420 mg QM.
Introduction
Evolocumab is a fully human monoclonal antibody against proprotein convertase subtilisin/kexin type 9 (PCSK9). In randomized controlled phase 2 clinical studies across a variety of patient populations, 1 -6 subcutaneous administration of evolocumab once every 2 weeks (Q2W) or once monthly (QM) reduced low-density lipoprotein cholesterol (LDL-C) by approximately 55% to 75% compared to placebo injections and reduced LDL-C more effectively than daily ezetimibe therapy. Dose-related safety issues were not identified, regardless of the level of LDL-C reduction achieved. 7
In the FOURIER study, evolocumab 140 mg Q2W or 420 mg QM significantly reduced the risk of cardiovascular events in patients with established cardiovascular disease who were on statin therapy, compared to placebo. 8 Adding evolocumab to ongoing statin therapy reduced the relative risk by 15% for the primary end point (a broad composite of cardiovascular death, myocardial infarction, stroke, hospitalization for unstable angina, or coronary revascularization) and by 20% for the key secondary end point (a composite of cardiovascular death, myocardial infarction, or stroke). This cardiovascular risk reduction was preserved across the range of LDL-C studied, including patients who achieved an LDL-C below 0.5 mmol/L (<20 mg/dL). When individual cardiovascular outcomes were examined separately, rates of myocardial infarction, stroke, and coronary revascularization were significantly lower in the evolocumab group than in the placebo group, but cardiovascular mortality and death from any cause were not significantly different between the treatment groups. The overall incidences of adverse events were similar between the evolocumab and placebo groups, with the exception of injection-site reactions (2.1% evolocumab and 1.6% placebo). No safety concerns were identified with very low LDL-C over a median of 2.2 years. 9
The shape of the evolocumab–LDL-C response curve over time, including the peak and the duration of LDL-C reduction, is dependent on the dose and dosing interval. Phase 1 studies showed that evolocumab doses that fully inhibit free PCSK9 (ie, doses of 70 mg or greater) result in maximal LDL-C reduction, and higher doses prolong the duration of maximal LDL-C reduction. 10 The continued endogenous production of circulating PCSK9 with evolocumab treatment results in a U-shaped LDL-C-reduction profile over the dosing interval. 10,11 With alternative modalities such as RNA inhibition, incomplete suppression of PCSK9 is observed. 12 This leads to reductions in LDL-C which are stable over the dosing interval and smaller compared to evolocumab. 12,13
Given the relationship between unbound PCSK9 and LDL-C and the effect, in turn, between absolute LDL-C reduction and cardiovascular risk reduction, selecting the appropriate dose of an anti-PCSK9 monoclonal antibody for different dosing intervals is critical. 14 In phase 1 single-dose and multiple-dose studies of evolocumab, a dose of <70 mg was not able to completely neutralize unbound PCSK9 for more than a few days, resulting in less than maximal mean LDL-C reduction. 10 Doses that resulted in complete neutralization of unbound PCSK9 for at least a week yielded maximal LDL-C reduction, wherein the maintenance of maximal LDL-C reduction required doses in excess of 70 mg. 10 Higher doses of evolocumab (≥140 mg) produced maximal, sustained (>7 days) PCSK9 suppression, resulting in longer periods of maximal LDL-C reduction and less intrapatient LDL-C variability. 10 Therefore, providing sufficient evolocumab to bind the additional PCSK9 produced over the dosing interval might maximize both the magnitude and the duration of LDL-C reduction between doses.
In this analysis, we examined the pharmacodynamics of evolocumab in 2 phase 2 studies to determine optimal dosing regimens that achieve consistent LDL-C reduction with minimal variability, with possible implications for cardiovascular risk reduction in clinical practice. Our analysis compared the effects of evolocumab 140 mg Q2W or evolocumab 420 mg QM, with lower doses (70 mg Q2W or 280 mg QM), on changes in LDL-C from baseline over time, either across all visits or at the mean of weeks 10 and 12 to determine the LDL-C reduction over time. This analysis also compared the approximate peak and trough effects of evolocumab on LDL-C as well as the intrapatient variability in LDL-C reduction for the different doses of evolocumab.
Materials and Methods
Study Design
The designs and primary results were described previously for “monoclonal antibody against PCSK9 to reduce elevated LDL-C in patients currently not receiving drug therapy for easing lipid levels” (MENDEL; Clinicaltrials.gov NCT01375777) 15 and “LDL-C assessment with PCSK9 monoclonal antibody inhibition combined with statin therapy—thrombolysis in myocardial infarction 57” (LAPLACE-TIMI 57; Clinicaltrials.gov NCT01380730). 16,17 These 2 phase 2 placebo-controlled studies had similar designs to evaluate the efficacy and safety of evolocumab in patients with hyperlipidemia. Background statin therapy and cardiovascular risk were notable differences between the studies. In MENDEL, patients with lower cardiovascular risk (Framingham risk score of 10% or less) received evolocumab or placebo without a statin. 15 In LAPLACE-TIMI 57, patients with higher cardiovascular risk received evolocumab or placebo with background statin therapy. 16,17
Each study complied with institutional regulations for human studies and US Food and Drug Administration guidelines. All patients provided written informed consent to participate. Each study design was approved by an institutional review board.
Patients in each study were randomized to receive evolocumab 70, 105, or 140 mg Q2W; evolocumab 280, 350, or 420 mg QM; placebo Q2W; or placebo QM subcutaneously for 12 weeks. Study personnel administered evolocumab or placebo during clinic visits. MENDEL also had a comparator arm for oral ezetimibe once daily, self-administered by the patient. End points, schedules of assessments, and laboratory methods were identical between the studies.
In each study, at least 15 patients per treatment arm provided separate informed consent to participate in a substudy to characterize the pharmacodynamics of evolocumab during the final month of dosing (weeks 8-12). The eligibility criteria and study treatments in these substudies were identical to those of the main studies. In addition to the regular protocol assessments that occurred Q2W in all patients in the main studies, patients in these substudies provided blood samples at weeks 9 and 11 for fasting lipids, apolipoprotein A1 (ApoA1), apolipoprotein B (ApoB), and PCSK9. For this analysis, LDL-C was calculated per the Friedewald equation. 18,19 Unbound PCSK9 serum concentrations were determined using an enzyme-linked immunosorbent assay method with a detection range of 15 to 2000 ng/mL. 20
Data Analysis
Data were integrated across the MENDEL and LAPLACE-TIMI 57 studies within each of the following 6 treatment groups: evolocumab 70 mg Q2W, evolocumab 140 mg Q2W, evolocumab 280 mg QM, evolocumab 420 mg QM, placebo Q2W, and placebo QM. Descriptive data were provided for baseline characteristics and changes in lipids from baseline.
In the main studies, 3 key end points assessed the effect of evolocumab on lipids: (1) percentage change from baseline at all postbaseline visits (mean of weeks 2, 4, 6, 8, 10, and 12); (2) percentage change from baseline at the last 2 visits (mean of weeks 10 and 12); and (3) percentage change from baseline at the last visit (week 12; primary end point in both studies).
In the pharmacodynamic substudies, patients who had lipid values for all 5 samples in the final month of dosing (weeks 8, 9, 10, 11, and 12) were analyzed for area under the effect–time curve (AUEC) estimates instead of the time-averaged effect from all visits. Each AUEC estimate was calculated as percentage change from baseline at week 8 plus the average incremental percentage change from baseline over weeks 8 to 12. Patients in the pharmacodynamic substudies were also analyzed for the approximate peak change from baseline between weeks 8 and 12, which occurred at week 9 or 11 for Q2W dosing and week 10 for QM dosing. The other assessments from the main studies (change from baseline at the mean of weeks 10 and 12 and trough effect at week 12) were repeated for patients in the pharmacodynamic substudies.
Noncompartmental analysis was performed on the individual LDL-C concentration–time data using WinNonlin Enterprise (version 5.1.1; Certara, Princeton, New Jersey) to estimate the AUEC without assuming a specific compartmental model. Intrapatient variability was measured for each patient as the difference between the maximum and minimum percentage change from baseline in LDL-C at weeks 8, 9, 10, 11, and 12. For the main studies, ad hoc between-group comparisons of the percentage LDL-C change from baseline used t tests to compare evolocumab 140 mg Q2W to each of the other Q2W groups and evolocumab 420 mg QM to each of the other QM groups. For the pharmacodynamic substudies, between-group comparisons are not presented because of the smaller sample sizes.
Results
Study Population
A total of 741 patients in MENDEL or LAPLACE-TIMI 57 received double-blind subcutaneous evolocumab 70 or 140 mg Q2W, evolocumab 280 or 420 mg QM, or placebo and were included in the integrated analysis. Baseline patient characteristics were similar across the treatment groups (Table 1). Mean (standard deviation [SD]) calculated LDL-C at baseline was 127.6 (27.9) mg/dL. Nearly two-thirds (63.4%) of the patients were from LAPLACE-TIMI 57 and received study treatment with a statin; 36.6% were from MENDEL and received study treatment without a statin, by trial design.
Baseline Patient Characteristics (Main Studies).

Abbreviations: ApoA1, apolipoprotein A1; ApoB, apolipoprotein B; BMI, body mass index; CHD, coronary heart disease; HDL-C, high-density lipoprotein cholesterol; LDL-C, low-density lipoprotein cholesterol; Lp(a), lipoprotein(a); PCSK9, proprotein convertase subtilisin/kexin type 9; Q2W, once every 2 weeks; QM, once monthly; SD, standard deviation.
aLp(a) and PCSK9 are presented as median (Q1, Q3).
A total of 151 patients in the pharmacodynamic substudies were included in this analysis to fully characterize the steady state time course of LDL-C with sample collections at weeks 8, 9, 10, 11, and 12. Baseline characteristics of patients in these substudies (Supplemental Table 1) were similar among the treatment groups and similar to those of the overall study population (Table 1).
Changes in LDL-C Over Time: Peak Effect
As reported in the individual studies, 15,17 the greatest maintenance of maximal LDL-C reductions from baseline was observed with the 140 mg Q2W and 420 mg QM doses of evolocumab. With weekly LDL-C determination in the pharmacodynamic substudies, U- or V-shaped LDL-C curves were observed between doses for both Q2W and QM dosing regimens (Figure 1). During steady state dosing, the peak effect for reduction in LDL-C (ie, the greatest pharmacodynamic effect observed during the dosing interval) based on weekly lipid assessments was observed 1 week after Q2W dosing and 2 weeks after QM dosing (Table 2). Using the weekly lipid assessments during the last month of treatment (weeks 8-12), approximate mean peak reduction in LDL-C was 72.8% (95% confidence interval [CI]: 67.7% to 77.9%) for 140 mg Q2W and 69.0% (95% CI: 63.6% to 74.3%) for 420 mg QM. For lower doses, approximate mean peak reduction in LDL-C was 50.4% (95% CI: 39.0% to 61.9%) for 70 mg Q2W and 63.6% (95% CI: 56.6% to 70.6%) for 280 mg QM. At the time of the peak effect for evolocumab, placebo did not reduce LDL-C.
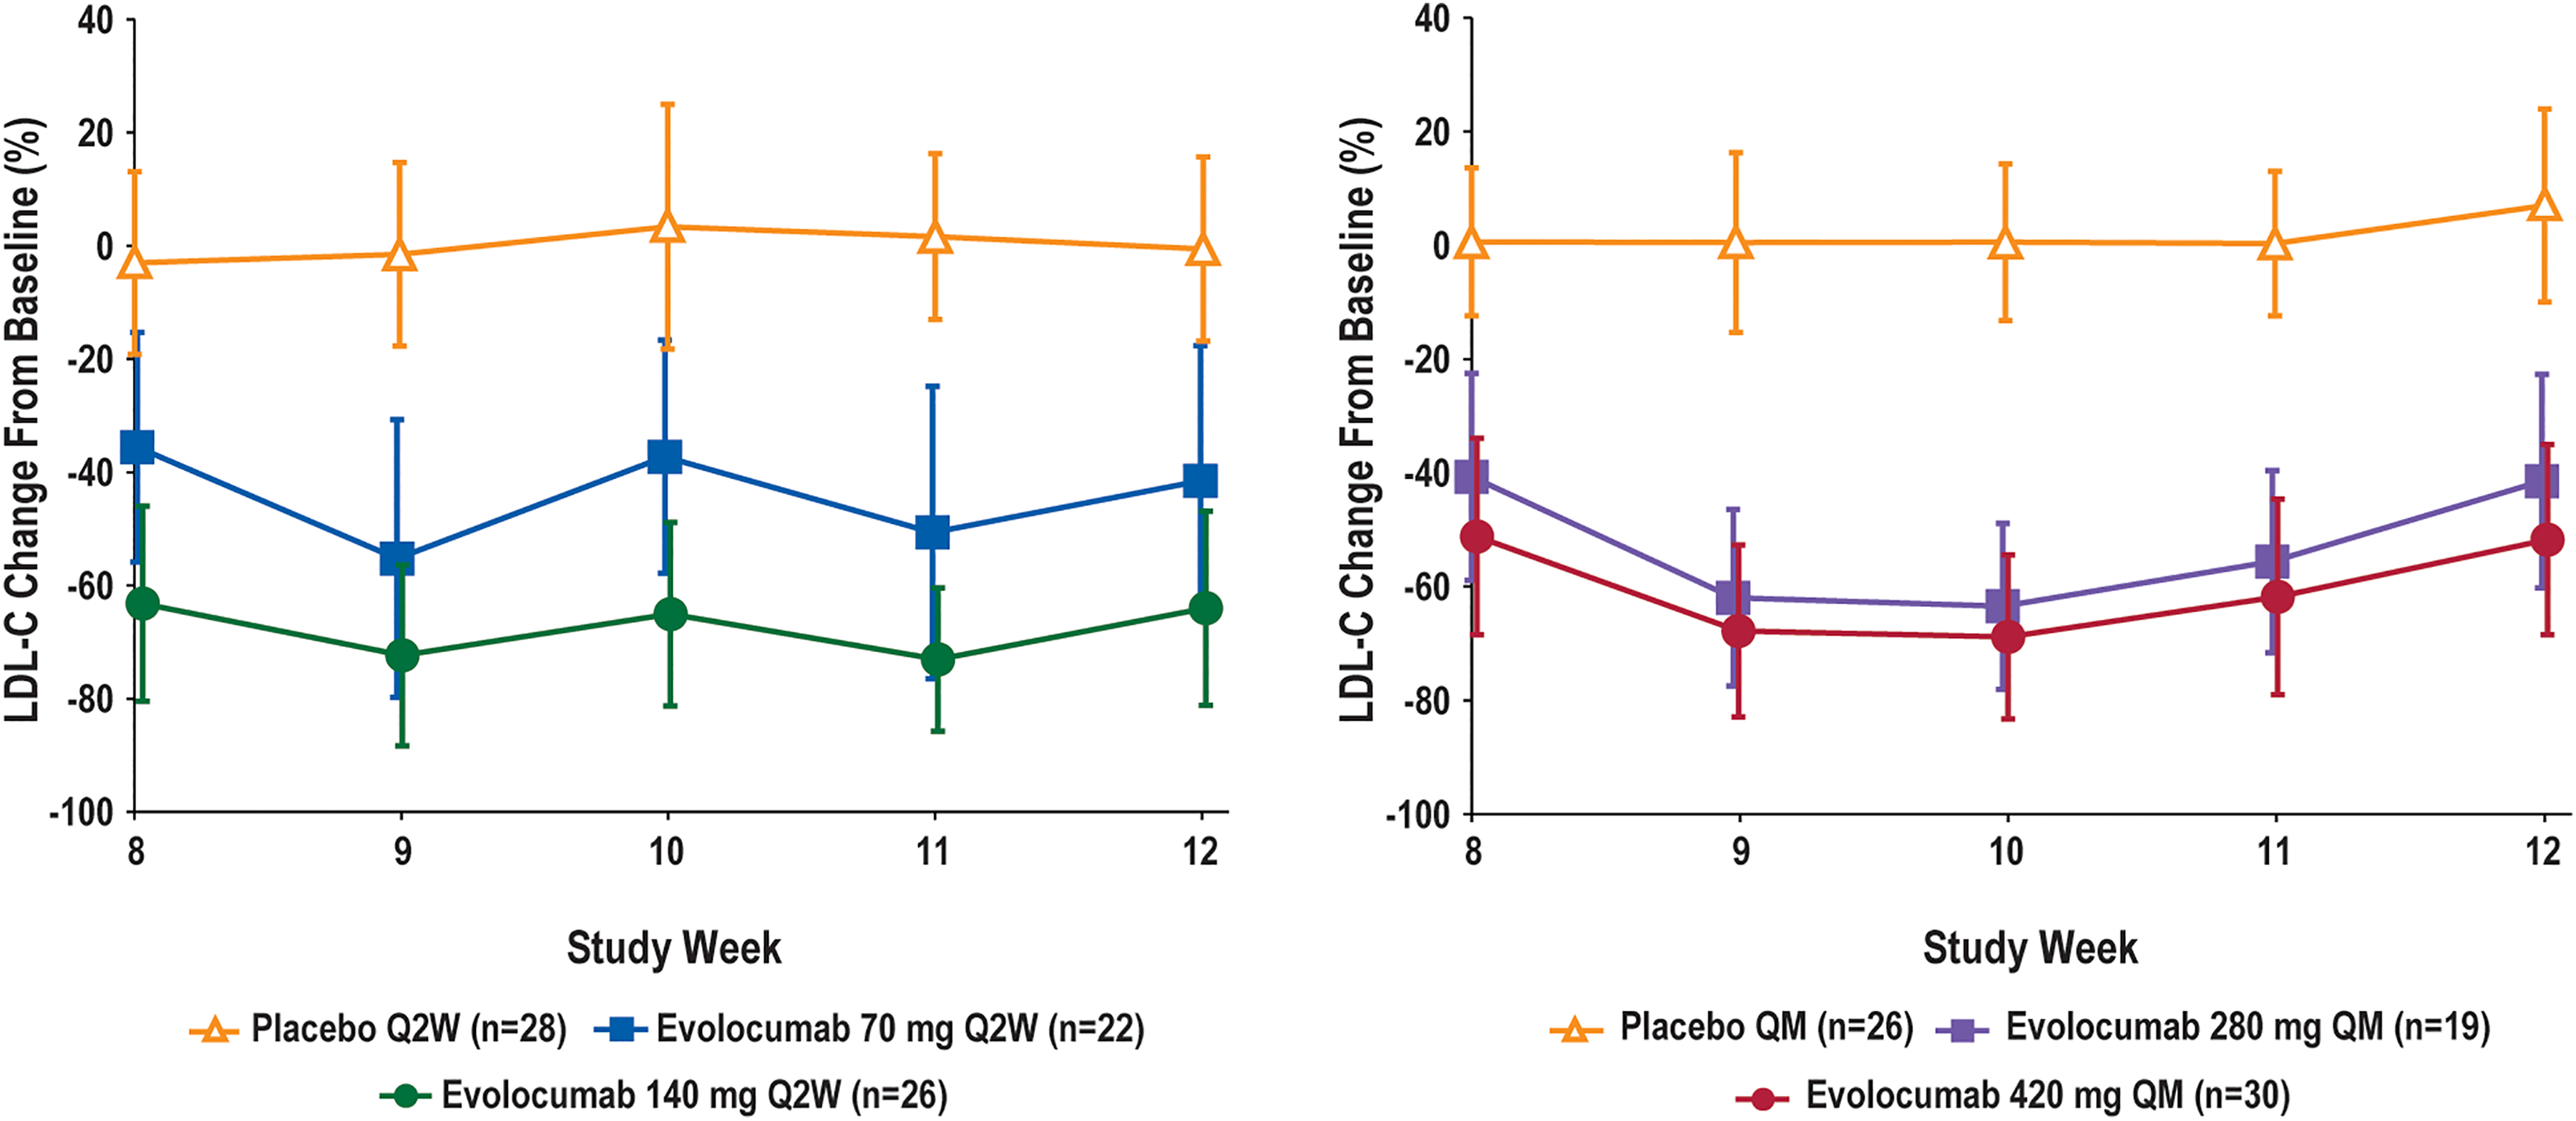
Percentage change from baseline in calculated LDL-C over time (pharmacodynamic substudies). A, Patients treated with evolocumab or placebo Q2W. For the evolocumab 140 mg Q2W dose, peak LDL-C reduction of approximately 70% was observed at weeks 9 and 11, with a return to the trough effect of Q2W dosing at week 12. B, Patients treated with evolocumab or placebo QM. For the evolocumab 420 mg QM dose, peak LDL-C reduction of approximately 70% was observed at week 10, with a return to the trough effect of QM dosing at week 12. Mean (±SD) percentage change from baseline in the calculated LDL-C from weekly assessments at week 8 through week 12. Data for each dose were integrated from the pharmacodynamic substudies. LDL-C, low-density lipoprotein cholesterol; Q2W, once every 2 weeks; QM, once monthly.
Mean (95% Confidence Interval) Percentage Change From Baseline in Calculated LDL-C at Various Time Points.

Abbreviations: AUEC, area under the effect-time curve, calculated as percent change from baseline at week 8 plus the average incremental percent change from baseline over weeks 8 to 12; LDL-C, low-density lipoprotein cholesterol; Q2W, once every 2 weeks; QM, once monthly.
aP value versus evolocumab 140 mg Q2W.
bP value versus evolocumab 420 mg QM.
cWeek 11 for Q2W dosing and week 10 for QM dosing; the midpoint in the dosing interval approximates peak LDL-C reduction.
Time-Averaged Reduction in LDL-C
Changes from baseline in LDL-C at different time points in the main studies are summarized for each treatment group in Table 2. When the data from all post-baseline Q2W visits were combined (mean of weeks 2, 4, 6, 8, 10, and 12), LDL-C reduction from baseline was greatest for evolocumab 140 mg Q2W (mean: 63.0%; 95% CI: 60.3% to 65.7%) or evolocumab 420 mg QM (mean: 62.7%; 95% CI: 60.1% to 65.3%) and was similar between these doses (P = .882). Lesser reductions in LDL-C from baseline across all visits were observed for evolocumab 70 mg Q2W (mean: 41.3%; 95% CI: 38.6% to 44.0%; P < .001 vs 140 mg Q2W), evolocumab 280 mg QM (mean: 55.5%; 95% CI: 52.9% to 58.0%; P < .001 vs 420 mg QM), placebo Q2W (mean: 1.9%; 95% CI: 4.6% reduction to 0.8% increase; P < .001 vs 140 mg Q2W), and placebo QM (mean: 2.5%; 95% CI: 5.1% reduction to 0.1% increase; P < .001 vs 420 mg QM). The similarity of LDL-C lowering across all visits for evolocumab 140 mg Q2W and 420mg QM, as well as the greater duration of effects of these doses compared to lower doses or placebo, extended to the reductions over all visits for other lipids as well (Supplemental Table 2). In the evolocumab 140 mg Q2W and 420 mg QM groups, the mean reductions from baseline across all study visits were 48% for ApoB, 38% to 39% for total cholesterol, 54% to 55% for non-high-density lipoprotein cholesterol and 11% to 14% for triglycerides HDL-C increased by 7% to 8% and ApoA1 increased by 5% to 6%.
The LDL-C changes at the last two visits in the main studies (weeks 10 and 12) were also examined to estimate time-averaged effects on LDL-C (Table 2). Mean reduction from baseline in LDL-C at the mean of weeks 10 and 12 was greatest for evolocumab 140 mg Q2W (mean: 64.5%; 95% CI: 61.4% to 67.6%) or 420 mg QM (mean: 63.5%; 95% CI: 60.5% to 66.6%) and was similar between these doses (P = .672). Lesser reductions in LDL-C from baseline at the mean of weeks 10 and 12 were observed for evolocumab 70 mg Q2W (mean: 44.5%; 95% CI: 41.4% to 47.6%; P < .001 vs 140 mg Q2W), evolocumab 280 mg QM (mean: 56.3%; 95% CI: 53.3% to 59.3%; P < .001 vs 420 mg QM), placebo Q2W (mean: 1.2%; 95% CI: 4.3% reduction to 1.9% increase; P < .001 vs 140 mg Q2W), and placebo QM (mean: 2.0%; 95% CI: 5.1% reduction to 1.0% increase; P < .001 vs 420 mg QM).Within each treatment group, the changes in LDL-C at the mean of weeks 10 and 12 were similar to the changes at the mean of weeks 2, 4, 6, 8, 10, and 12. Similar effects by treatment group were observed for the mean reductions from baseline at weeks 10 and 12 for other lipids as well (Supplemental Table 2). In the evolocumab 140 mg Q2W and 420 mg QM groups, the mean reductions from baseline at the mean of weeks 10 and 12 were 48% to 49% for ApoB, 39% for total cholesterol, 55% to 56% for non–HDL-C, and 12% to 14% for triglycerides HDL-C increased by 8% to 9% and ApoA1 increased by 7%.
In the pharmacodynamic substudies, time-averaged changes in LDL-C were determined with the AUEC for weekly values in the last month of dosing (Table 2). Mean time-averaged reductions in LDL-C from baseline using the weekly values were greatest for evolocumab 140 mg Q2W (mean: 68.3%; 95% CI: 63.0% to 73.5%) and evolocumab 420 mg QM (mean: 62.6%; 95% CI: 57.8% to 67.4%). Lesser reductions in LDL-C from baseline across the weekly visits were observed for evolocumab 70 mg Q2W (mean: 45.2%; 95% CI: 35.9% to 54.5%) and evolocumab 280 mg QM (mean: 57.1%; 95% CI: 51.5% to 62.7%). No mean reduction from baseline was observed across the weekly visits in the placebo groups. When the change from baseline was analyzed as the mean of weeks 10 and 12 for these substudies, the observed changes in LDL-C in each treatment group were similar to those for the corresponding analysis of the main studies. Similar dose-related effects were seen for time-averaged reductions in other lipids as well (Supplemental Table 3). In the evolocumab 140 mg Q2W and 420 mg QM groups, the mean time–averaged reductions from baseline were 48% to 55% for ApoB, 40% to 42% for total cholesterol, 55% to 59% for non–HDL-C, and 11% to 14% for triglycerides HDL-C increased by 8% and ApoA1 increased by 3% to 7%.
Trough Reduction in LDL-C
The trough effect of evolocumab at week 12 (Table 2) underestimated LDL-C reduction compared to time–averaged reduction, particularly in the QM dosing groups. In the main studies, the mean reduction from baseline using the single trough assessment at week 12 was 64.1% (95% CI: 60.7% to 67.6%) for evolocumab 140 mg Q2W and 56.4% (95% CI: 52.9% to 59.9%) for evolocumab 420 mg QM. Evolocumab 70 mg Q2W and 280 mg QM led to mean LDL-C reductions at week 12 of 44.4% (95% CI: 41.0% to 47.8%; P < .001 vs 140 mg Q2W) and 45.4% (95% CI: 42.0% to 48.9%; P < .001 vs 420 mg QM), respectively. Similar results were observed for the change from baseline at a single trough measurement at week 12 for other lipids (Supplemental Table 2). In the pharmacodynamic substudies, trough effects of evolocumab on LDL-C (Table 2) and other lipids (Supplemental Table 3) at week 12 were consistent with the results at week 12 in the main studies.
Intrapatient Peak–Trough Variability
In the pharmacodynamic substudies, an assessment of intrapatient variability was undertaken by measuring the difference between the maximal (peak) and minimal (trough) change from baseline in LDL-C for each patient. Hence, a low value indicates a stable reduction in LDL-C, and larger values indicate greater fluctuations in LDL-C over the dosing interval. An analysis of intrapatient variability in the pharmacodynamic substudies (Figure 2) showed that evolocumab 140 mg Q2W and evolocumab 420 mg QM resulted in median (Q1, Q3) variability of 20.5% (11.8%, 31.2%) and 21.1% (15.1%, 34.9%), respectively; for lower doses, median (Q1, Q3) variability was 31.9% (17.4%, 46.7%) for 70 mg Q2W and 35.1% (16.4%, 49.2%) for 280 mg QM.

Intrapatient variability for change from baseline in calculated LDL-C (pharmacodynamic substudies). Intrapatient variability was measured for each patient as the difference between the maximum and minimum change from baseline in LDL-C at weeks 8, 9, 10, 11, and 12. The boxes present the median and interquartile range. Whiskers present the minimum and maximum, except for one outlier (98.8%) for 420 mg QM. Data for each dose were integrated from the pharmacodynamic substudies. LDL-C, low-density lipoprotein cholesterol; Q2W, once every 2 weeks; QM, once monthly.
Discussion
Evolocumab doses of 140 mg Q2W or 420 mg QM had clinically equivalent effects on LDL-C and secondary lipid parameters. These doses achieved and sustained maximal LDL-C reduction, resulting in less intrapatient variability over the dosing interval, compared to lower dose regimens of 70 mg Q2W and 280 mg QM. These results are consistent with the biology that require sustained (ie, >7 days) binding of free PCSK9 to maintain maximal LDL-C reduction. The intrapatient variability is determined by the duration of PCSK9 inhibition over the dosing interval. The higher Q2W and QM evolocumab doses provide longer inhibition of PCSK9 that translate into longer maximal LDL-C reduction and less intrapatient variability. The approximate peak reduction in LDL-C was 72.8% with evolocumab 140 mg Q2W and 69.0% with evolocumab 420 mg QM, whereas at week 12 (trough effect) these doses reduced LDL-C by 64.1% and 56.4%, respectively, from baseline. Other studies evaluated higher doses of evolocumab such as 280 mg Q2W or an IV dose of 420 mg, 10 but those doses did not result in greater peak LDL-C reductions than evolocumab 140 mg Q2W or 420 mg QM.
Clinical Implications
Both the degree of LDL-C reduction at a single time point and the time-averaged effect over the dosing interval warrant consideration, 21 particularly for a longer acting therapy such as evolocumab. Measurement of a single LDL-C value during Q2W or QM treatment, particularly at the trough just prior to the next dose, may underestimate the magnitude and duration of treatment effect. Phase 1 studies examined the time course of the pharmacodynamic effects of evolocumab with single or repeated doses, using frequent blood samples in dose cohorts that each contained approximately 6 patients. 10 In the phase 1 studies, the magnitude and duration of LDL-C reductions corresponded to the magnitude and duration of PCSK9 reductions with evolocumab treatment. With repeated dosing of evolocumab, peak reduction in LDL-C after each dose was followed by a gradual return toward initial LDL-C, with the highest LDL-C concentrations just prior to the next Q2W or QM dose. Higher doses maintained maximal LDL-C reductions longer than lower doses with the same Q2W or QM regimen. This resulted in a more stable response over the dosing interval for the higher doses, with less difference between the LDL-C reductions at the approximate peak relative to the trough.
Although peak–trough variability in LDL-C reduction was less with the higher doses of evolocumab, the median variability was 21% with either 140 mg Q2W or 420 mg QM. This peak–trough variability reflects a stable effect for a therapy that is administered infrequently (Q2W or QM), especially when most lipid-lowering treatments require at least once daily dosing to maintain effects. As noted above, the smallest trough effect on LDL-C was a reduction of 56.4% (for 420 mg Q2W in the main studies) and the greatest peak effect on LDL-C was a reduction of 72.8% (for 140 mg Q2W in the pharmacodynamic substudies), showing that the effect was stable both across doses and over time. Because lower doses of evolocumab showed greater peak–trough variability, patient factors that influence evolocumab pharmacokinetics and pharmacodynamics are important to consider. Cross-study pharmacokinetics analyses showed that evolocumab exposure is lower in heavier patients, and it may be influenced by other covariate factors. 22 However, none of the observed pharmacokinetic differences was associated with a clinically meaningful effect on LDL-C reduction. 22 Other cross-study analyses have shown that the heaviest patients may experience a more rapid return toward baseline in LDL-C during delays in dosing, or when discontinuing therapy, and they may have a narrower time window for optimal dosing. 23 In this analysis, body mass index was balanced across the dosing cohorts at baseline, suggesting that body weight did not influence the more optimal stability of effect for the higher doses of evolocumab. The intrinsic production rate of PCSK9 may increase with administration of statins, but the elimination of PCSK9 stays in a constant range. After stratifying for statin use, the week 12 LDL-C response to evolocumab was insensitive to quartiles of baseline PCSK9. 24 Thus, although some peak–trough variability in LDL-C reduction may occur with evolocumab doses of 140 mg Q2W or 420 mg QM, particularly in heavier patients or those with other characteristics that may reduce evolocumab exposure, these doses are associated with clinically meaningful reduction in LDL-C, which is maximized at the peak effect and generally more stable across the peaks and troughs than for lower doses of evolocumab.
As this pooled analysis of phase 2 studies had much larger sample sizes but less frequent blood sampling than the phase 1 studies, 2 different approaches were used to estimate the time-averaged effect of evolocumab on lipids in the main studies. One estimate used the mean values across all 6 biweekly visits (weeks 2 to 12), and the other estimate was based on the mean of the last 2 values (weeks 10 and 12). The mean reduction in LDL-C across all biweekly visits was 63.0% for evolocumab 140 mg Q2W and 62.7% for evolocumab 420 mg QM. In clinical practice, patients self-administer evolocumab, and biweekly assessments of lipids between clinic visits may not be practical. This analysis examined whether 2 assessments at steady state (weeks 10 and 12) provided a reasonable estimate of the time-averaged effect of evolocumab on lipids. Compared to the trough effect from a single LDL-C measurement at week 12, the mean LDL-C from weeks 10 and 12 provided a closer approximation of the mean value at all biweekly visits for both Q2W and QM dosing. In the pharmacodynamic substudies, similar results were observed for the mean at weeks 10 and 12 or across weekly visits during the final month (weeks 8-12). Several longer-term clinical studies have shown that LDL-C reductions that are achieved by week 12 persist with continued evolocumab treatment for several years, 7,8,25 which suggests that measurement of LDL-C at the mean of weeks 10 and 12 may predict not only the average reduction to week 12 but also the continued reduction in LDL-C with additional treatment.
Meta-analyses have reported that LDL-C reduction is associated with cardiovascular risk reduction, particularly for statins and medications such as evolocumab that upregulate the LDL-C receptor. 26,27 “The placebo-controlled global assessment of plaque regression with a PCSK9 antibody as measured by intravascular ultrasound” (GLAGOV) study of coronary atherosclerosis among 968 patients with angiographic coronary disease showed that the addition of evolocumab to a statin significantly reduced percentage of atheroma volume at 18 months (week 78) compared to a statin alone. 25 The FOURIER study showed that lowering LDL-C by an average of 59% at 48 weeks, using evolocumab doses of 140 mg Q2W or 420 mg QM, significantly reduced the risk of cardiovascular events. 8 There was no lower LDL-C threshold for the cardiovascular benefit of evolocumab, including patients who achieved an LDL-C <20 mg/dL when evolocumab was added to a statin. 9 Thus, optimal evolocumab dosing is important to achieve the greatest and most stable reductions in LDL-C possible. Although this analysis did not examine safety, evolocumab was tolerated well in each of the studies that were included in the pooled analysis as well as across various levels of achieved LDL-C in the FOURIER study of 27 564 patients. 9,15,17
Study Limitations
A few limitations in this analysis are acknowledged. The analysis pooled data from 2 different evolocumab studies: monotherapy and in combination with a statin. Statins upregulate PCSK9, 28,29 which should increase the clearance of evolocumab due to target-mediated elimination. 14 However, when evolocumab was administered—either as monotherapy or added to a background statin—the change from baseline in LDL-C was generally similar between the 2 populations within each dosing group. 15,17 Measurement errors also require consideration. The pharmacodynamics study used calculated LDL-C measurements. Calculated LDL-C may underestimate true LDL-C at lower LDL-C concentrations, 19 such as those achieved with evolocumab therapy in these studies. However, LDL-C reduction associated with evolocumab 140 mg Q2W or 420 mg QM in these studies was similar to that in the FOURIER study, 8 which reflexively used preparative ultracentrifugation to determine LDL-C when the calculated LDL was <40 mg/dL or triglycerides were >400 mg/dL. Within each study, only a subset of patients was included in the pharmacodynamic substudy with weekly assessments during the last 4 weeks. Participants in this subgroup volunteered for more frequent assessments than others and may have differed from other study participants, and the sample sizes for the substudies were too small for reliable statistical comparisons. Nonetheless, the results for baseline characteristics and for LDL-C reduction in the pharmacodynamic substudies aligned well with the results from the main studies. The LDL-C was collected more frequently in the pharmacodynamic substudies, which provided weekly assessments from weeks 8 to 12 to confirm the U-shaped curve for LDL-C in the QM groups. However, because of the weekly lipid assessments in the substudies, it was not possible to determine if the response curve between Q2W doses also was U-shaped. Finally, the approximate peak effect of evolocumab on LDL-C was based on available data from the weekly assessments in the pharmacodynamic substudies, but the true peak effect could have occurred between those weekly assessments.
Conclusion
Evolocumab 140 mg Q2W or 420 mg QM dosing sustained maximal LDL-C reduction, resulting in less intrapatient variability over the dosing interval compared to lower doses of evolocumab. These findings support the initiation of evolocumab at either 140 mg Q2W or 420 mg QM, depending on patient and prescriber preference, without the need for dose adjustment over time.
Supplemental Material
Supplemental_Tables - Comparison of LDL-C Reduction Using Different Evolocumab Doses and Intervals: Biological Insights and Treatment Implications
Supplemental_Tables for Comparison of LDL-C Reduction Using Different Evolocumab Doses and Intervals: Biological Insights and Treatment Implications by Scott M. Wasserman, Marc S. Sabatine, Michael J. Koren, Robert P. Giugliano, Jason C. Legg, Maurice G. Emery, Sameer Doshi, Thomas Liu, Ransi Somaratne, and John P. Gibbs in Journal of Cardiovascular Pharmacology and Therapeutics
Footnotes
Authors’ Note
Maurice G. Emery is now affiliated to Seattle Genetics, Bothell WA. Thomas Liu is now affiliated to Edwards Life Science, Irvine CA. Ransi Somaratne is now affiliated to NGM Biopharmaceuticals, South San Francisco CA. John P. Gibbs is now affiliated to AbbVie, North Chicago IL.
Acknowledgments
The authors thank Meera Kodukulla, PhD, CMPP (Amgen Inc) and Jonathan Latham, PharmD (on behalf of Amgen Inc) for their assistance with the authors in the preparation and submission of this work.
Authors’ Contribution
Scott M. Wasserman contributed to conception and design, analysis and interpretation, drafted manuscript, critically revised manuscript, gave final approval, and agreed to be accountable for all aspects of work ensuring integrity and accuracy. Marc S. Sabatine, Michael J. Koren, Robert P. Giugliano, and Jason C. Legg contributed to acquisition and interpretation, critically revised manuscript, gave final approval, and agreed to be accountable for all aspects of work ensuring integrity and accuracy.
Declaration of Conflicting Interests
The author(s) declared the following potential conflicts of interest with respect to the research, authorship, and/or publication of this article: At the time of the analysis, Scott M. Wasserman, Jason C. Legg, Maurice G. Emery, Sameer Doshi, Thomas Liu, Ransi Somaratne, and John P. Gibbs were employees and stockholders of Amgen Inc. Marc S. Sabatine has received research grant support through Brigham and Women’s Hospital from Abbott Laboratories, Amgen, AstraZeneca, Critical Diagnostics, Daiichi-Sankyo, Eisai, Genzyme, Gilead, GlaxoSmithKline, Intarcia, Janssen Research and Development, MedImmune, Merck, Novartis, Poxel, Pfizer, Roche Diagnostics, and Takeda, and has been a consultant for Alnylam, Amgen, AstraZeneca, Cubist, CVS Caremark, Esperion, Intarcia, Ionis, Janssen Research and Development, Medicines Company, MedImmune, Merck, MyoKardia, and Zeus Scientific. Michael J. Koren is employed by a company that has received study grants and consulting fees from Amgen and other manufacturers of PCSK9 antibodies. Robert P. Giugliano reports grants and personal fees from Amgen, during the conduct of the study; grants and personal fees from Amgen, Daiichi-Sankyo, and Merck; and personal fees from Amarin, American College of Cardiology, Angel Med, Beckman-Coulter, Boehringer Ingelheim, Bristol-Myers Squibb, CVS Caremark, GlaxoSmithKline, Janssen, Lexicon, Portola, Pfizer, Regeneron, Sanofi-Aventis, St Jude, and Stealth Peptides, outside from the submitted work.
Funding
The author(s) disclosed receipt of the following financial support for the research, authorship, and/or publication of this article: This work was supported by Amgen Inc.
Supplemental Material
Supplemental material for this article is available online.
References
Supplementary Material
Please find the following supplemental material available below.
For Open Access articles published under a Creative Commons License, all supplemental material carries the same license as the article it is associated with.
For non-Open Access articles published, all supplemental material carries a non-exclusive license, and permission requests for re-use of supplemental material or any part of supplemental material shall be sent directly to the copyright owner as specified in the copyright notice associated with the article.