
Abstract
The aim of this study was to investigate whether continuous electrical stimulation affects electrophysiological properties and cell morphology of fetal cardiomyocytes (FCMs) in culture. Fetal cardiomyocytes at day 14.5 post coitum were harvested from murine hearts and electrically stimulated for 6 days in culture using a custom-made stimulation chamber. Subsequently, action potentials of FCM were recorded with glass microelectrodes. Immunostainings of α-Actinin, connexin 43, and vinculin were performed. Expression of ion channel subunits Kcnd2, Slc8a1, Cacna1, Kcnh2, and Kcnb1 was analyzed by quantitative reverse-transcriptase polymerase chain reaction. Action potential duration to 50% and 90% repolarization (APD50 and APD90) of electrically stimulated FCMs were significantly decreased when compared to nonstimulated control FCM. Alignment of cells was significantly higher in stimulated FCM when compared to control FCM. The expression of connexin 43 was significantly increased in stimulated FCM when compared to control FCM. The ratio between cell length and cell width of the stimulated FCM was significantly higher than in control FCM. Kcnh2 and Kcnd2 were upregulated in stimulated FCM when compared to control FCM. Expression of Slc8a1, Cacna1c, and Kcnb1 was not different in stimulated and control FCMs. The decrease in APD50 observed after electrical stimulation of FCM in vitro corresponds to the electrophysiological maturation of FCM in vivo. Expression levels of ion channels suggest that some important but not all aspects of the complex process of electrophysiological maturation are promoted by electrical stimulation. Parallel alignment, increased connexin 43 expression, and elongation of FCM are signs of a morphological maturation induced by electrical stimulation.
Introduction
Acute myocardial infarction and subsequent chronic heart failure are major reasons for mortality in Western countries. Endogenous repair mechanisms do not lead to a relevant regeneration of irreversibly damaged myocardium but to a formation of scar tissue. Cell replacement therapy is a promising approach to overcome this limited endogenous regenerative potential, either by injection of dissociated cardiomyocytes 1,2 or by in vitro generation of engineered heart tissue, which can be surgically attached to host myocardium. 3 –5
For the generation of engineered heart tissue, a parallel alignment of graft cells to optimize force development is important. For both approaches, the expression of gap junctions and an electrophysiological maturation of graft cardiomyocytes is desired, in order to enhance coupling within the graft and between graft and host and to avoid inhomogeneities of electrical properties of graft and host, which are considered proarrhythmic. However, standard culture protocols lead to a random orientation of cardiomyocytes, a poorly organized gap junction arrangement, and immature electrophysiological properties. 2
Electrical stimulation during cultivation has been shown to enhance parallel alignment of cells and gap junction distribution in previous studies. Neonatal rat cardiomyocytes seeded on collagen sponges were aligned and elongated after electrical stimulation, while nonstimulated cells had a round shape. 6 Elongation and alignment due to electrical stimulation were also described for neonatal rat cardiomyocytes cultured on special cell culture chips with microridges 7 and in rat cardiomyocytes cultured in a custom-made bioreactor. 8 Electrical stimulation of neonatal rat cardiomyocytes resulted in an elevated level of connexin 43 expression 8 –10 and a more polarized connexin 43 expression pattern. 7,8 There were also ultrastructural alterations in stimulated cells characterized by a higher volume fraction occupied by sarcomeres and mitochondria in stimulated than in nonstimulated cells. 6 These morphological changes resulted in a higher contraction amplitude. 6
Up to now, information on the influence of electrical stimulation on electrophysiological properties is scarce. Multielectrode array measurements, which were used to quantify the beating frequency of stimulated rat cardiomyocytes (after stopping stimulation) as compared to nonstimulated controls, revealed no effect. 10 The authors provided no data on other relevant electrophysiological parameters. A recent study on the impact of electrical stimulation on electrophysiological properties used 3-dimensional cardiac tissue derived from human pluripotent stem cells (so-called biowires). 11 The authors found a lower excitation threshold and a higher maximum capture rate and conduction velocity in stimulated biowires than that in nonstimulated controls. Human ether-à-go-go related gene (hERG) and inward rectifier potassium current (IK1) densities were significantly increased by electrical stimulation, which was interpreted as sign of electrophysiological maturation. Changes in K+ current densities did not result in lower action potential duration, and no effect of electrical stimulation on other action potential parameters like maximum depolarization rate, action potential peak voltage, or resting membrane potential was observed.
In the present study, we demonstrate that electrical stimulation promotes electrophysiological maturation of cultivated murine fetal cardiomyocytes (FCMs) and significantly affects action potential properties. This supports that electrical stimulation is a valuable tool to advance maturation of cultivated cardiomyocytes in order to improve their potential for cell therapy.
Materials and Methods
All following experiments were approved by the local animal welfare committee and performed in accordance with the Principles of Laboratory Animal Care formulated by the USA National Society for Medical Research and the Guide for the Care and Use of Laboratory Animals.
Harvesting of FCM
Ventricles were harvested from 14.5-day-old (FCMd14) and 18.5-day-old (FCMd18) transgenic Crl:OF1 murine fetuses expressing green fluorescent protein under the control of the cardiac α-actin promoter. 12 Cells were dissociated with collagenase B (1 mg/mL; Roche, Grenzach-Wyhlen, Germany) and resuspended in Dulbecco modified Eagle medium (DMEM) supplemented with 20% fetal bovine serum (FBS; Gibco/Invitrogen, San Diego) and 0.1% penicillin/streptomycin (Gibco/Invitrogen, San Diego) at a concentration of 45.000 cells/µL. Subsequently, 450.000 cells were plated per culture dish (diameter: 3 cm; BD Falcon, Franklin Lakes, New Jersey) filled with 3 mL of DMEM supplemented with 20% FBS and 0.1% penicillin/streptomycin.
For stimulation experiments, FCMd14 was used and either stimulated for 6 days (stimulated FCM) or cultivated for 6 days without stimulation as a control (control FCM). To assess electrophysiological alterations during native murine development, FCMd14 and FCMd18 were cultivated for 2 days (to ensure their attachment, which is mandatory for intracellular action potential measurements) prior to action potential recordings.
Preparation of the Stimulation Chamber and Electrical Stimulation of FCM
A stimulation chamber consisted of the culture dish and a custom-made cover with coated silver wire electrodes. To avoid electrolysis of culture medium, electrodes were coated with agarose: DMEM supplemented with 20% FBS and 0.1% penicillin/streptomycin was mixed with 4% low-melt agarose (Roth, Karlsruhe, Germany) and heated in a microwave. A casting mold was filled with fluid agarose solution and the electrodes were fixed in the mold. Subsequently, the mold was kept in a refrigerator to harden the agarose around the electrodes. Finally, the cover of the stimulation chamber, including the agarose-coated electrodes, was placed on the culture dish. The stimulation chambers were connected by wire to a Grass Stimulator (Grass SD9 Stimulator; Grass Instruments, West Warwick, USA) and placed into an incubator at 37°C and 5% CO2.Fetal cardiomyocytes were stimulated for 6 days with monophasic pulses (amplitude: 1 V, pulse duration: 5 ms) at a stimulation frequency of 10 Hz. Medium was changed every second day. After medium change, the stimulation electrodes were inserted into the culture dish with the same orientation as before medium change to ensure a constant orientation of the electric field. Control FCMs were also cultivated in stimulation chambers and kept under identical conditions, except for electrical stimulation.
Action Potential Measurements
Fetal cardiomyocytes were examined on an inverted fluorescence microscope (Axiovert 200; Zeiss, Oberkochen, Germany). Samples were perfused with DMEM (Gibco/Invitrogen, San Diego) at 37°C and bubbled with 5% CO2 and 95% O2. Intracellular action potential measurements were performed as described earlier 1,2 with conventional glass microelectrodes (WPI, Sarasota) with resistances of 20 to 50 MΩ. Action potentials were recorded by a SEC-10LX amplifier (npi electronic, Tamm, Germany) and the Pulse software (Heka, Lambrecht/Pfalz, Germany). Action potential duration to 50% or 90% of repolarization (APD50, APD90), the ratio of APD50 and APD90 (APD50/90), amplitude, maximal diastolic potential (MDP), maximal upstroke velocity (Vmax), and spontaneous beating frequency were analyzed offline with Mini Analysis software (Synaptosoft, Fort Lee).
Immunostainings and Measurement of Cell Morphology
For immunohistological analyses, FCMs were fixed with 99% methanol (Roth, Karlsruhe, Germany) and permeabilized with 0.3% triton X-100 (Sigma-Aldrich, St. Louis). Preparations were blocked with 5% bovine serum albumin (GE, Fairfield, Connecticut) and stained with anti-α-actinin (clone EA53; Sigma-Aldrich; 1:400), anti-vinculin (clone h-VIN1; Sigma-Aldrich; 1:200), or anti-connexin 43 (clone CXN-6; Sigma-Aldrich; 1:200) diluted as recommended by the manufacturer’s instruction. Primary antibodies were detected with species-matched Alexa-488-conjugated secondary antibodies (Invitrogen, San Diego). Alexa-568-conjugated phalloidin and 4′,6-diamidino-2-phenylindole (Invitrogen, San Diego) were used to stain cell nuclei as recommended by the manufacturer. Images were taken with an Axiovert 200 microscope and Axiovision 4.3 software (Carl Zeiss, Oberkochen, Germany).
To quantify expression of connexin 43, the number of membrane-bound connexin 43 dots per cell was counted manually, and the counted dot number was divided by the number of cells counted. 13 Images of α-actinin stainings were used to determine the angles between longitudinal cell axes and electrical field lines or a fixed horizontal line in controls, respectively, with ImageJ software (ImageJ, National Institutes of Health (NIH), Bethesda, Maryland). Images of vinculin stainings were analyzed with Axiovision 4.3 software to determine cell length, cell width, ratio of cell length to cell width, and cell area.
Gene Expression
After stimulation or control cultivation, cells were dissociated with collagenase B (1mg/ml), washed with PBS without calcium and magnesium, and frozen at −80°C in RLT-Buffer. Subsequently, messenger RNA was isolated from the probes using RNeasy kit (Qiagen, Hilden, Germany) and transcribed to complementary DNA. Commercially available primers against Kcnh2 (no. Mm00465370_m1, amplicon length 62), Kcnd2 (no. Mm01161732_m1, amplicon length 66), Slc8a1 (no. Mm01232254_m1, amplicon length 67), Cacna1c (no. Mm00437917_m1, amplicon length 88), and Kcnb1 (no. Mm00492791_m1, amplicon length 73), and the control gene BACT, all obtained from Applied Biosystems and Invitrogen, were used. Gene expression was quantified by reverse-transcriptase polymerase chain reaction as described earlier. Data were analyzed with REST software tool (Qiagen, Hilden, Germany) as described earlier. 14 Samples of stimulated and control FCM originated from 3 independent isolations/hearts with up to 3 samples per group and isolation. Each sample was paired off with the corresponding group’s mean from the same isolation.
Statistics
Action potential parameters were tested for statistical significance by Student t test or by 1-way analysis of variance with posttest (if more than 2 groups were analyzed) with GraphPad Prism (GraphPad Software Inc., La Jolla, California). Angles between longitudinal cell axes and electrical field lines (or a fixed horizontal line in controls), cell length, cell width, ratio of cell length to cell width, cell area, and the number of connexin 43 dots per cell were tested for statistical significance by Student t test or, if normality test failed, by Mann-Whitney U test with GraphPad Prism. All data are presented as mean ± standard error of the mean. A 2-sided P < .05 was considered statistically significant.
Results
Action Potential Parameters
To demonstrate electrophysiological alterations during native murine development, we performed action potential recordings in FCMd14 and FCMd18. The APD50 was significantly lower in FCMd18 (81.84 ± 6.09 ms, n = 12) than in FCMd14 (95.69 ± 5.46 ms, n = 12, P = .02, Supplemental Figure 1A and Table 1). The APD90 of FCMd18 (110.00 ± 9.00 ms, n = 12) was also significantly lower than that of FCMd14 (152.40 ± 4.54 ms, n = 12, P = .02, Supplemental Figure 1B and Table 1). Detailed values of APD50/90, action potential amplitude, MDP, upstroke velocity, and spontaneous beating frequency are listed in Table 1.
Action Potential Parameters of FCMd14 and FCMd18.a

Abbreviations: APD50, action potential duration to 50% repolarization; APD90, action potential duration to 90% repolarization; APD50/90: ratio between APD50 and APD90; FCMd14, fetal cardiomyocyte at day 14.5; FCMd18, fetal cardiomyocyte at day 18; MDP, maximal diastolic potential; Vmax, maximal upstroke velocity.
aStatistically significant differences are marked (***P < .001, **P < .01, and *P < .05). See Supplemental Figure 1 for corresponding diagrams.
Corresponding to the decline in APD50 and APD90 during native development, significant differences between action potential durations of stimulated and control FCMs were observed. Both APD50 and APD90 of stimulated FCMs were significantly decreased when compared to controls (Figure 1 and Table 2). APD50/90, amplitude, MDP, Vmax, and spontaneous beating frequency did not differ between stimulated FCM and control FCM (Figure 1C-G and Table 2).
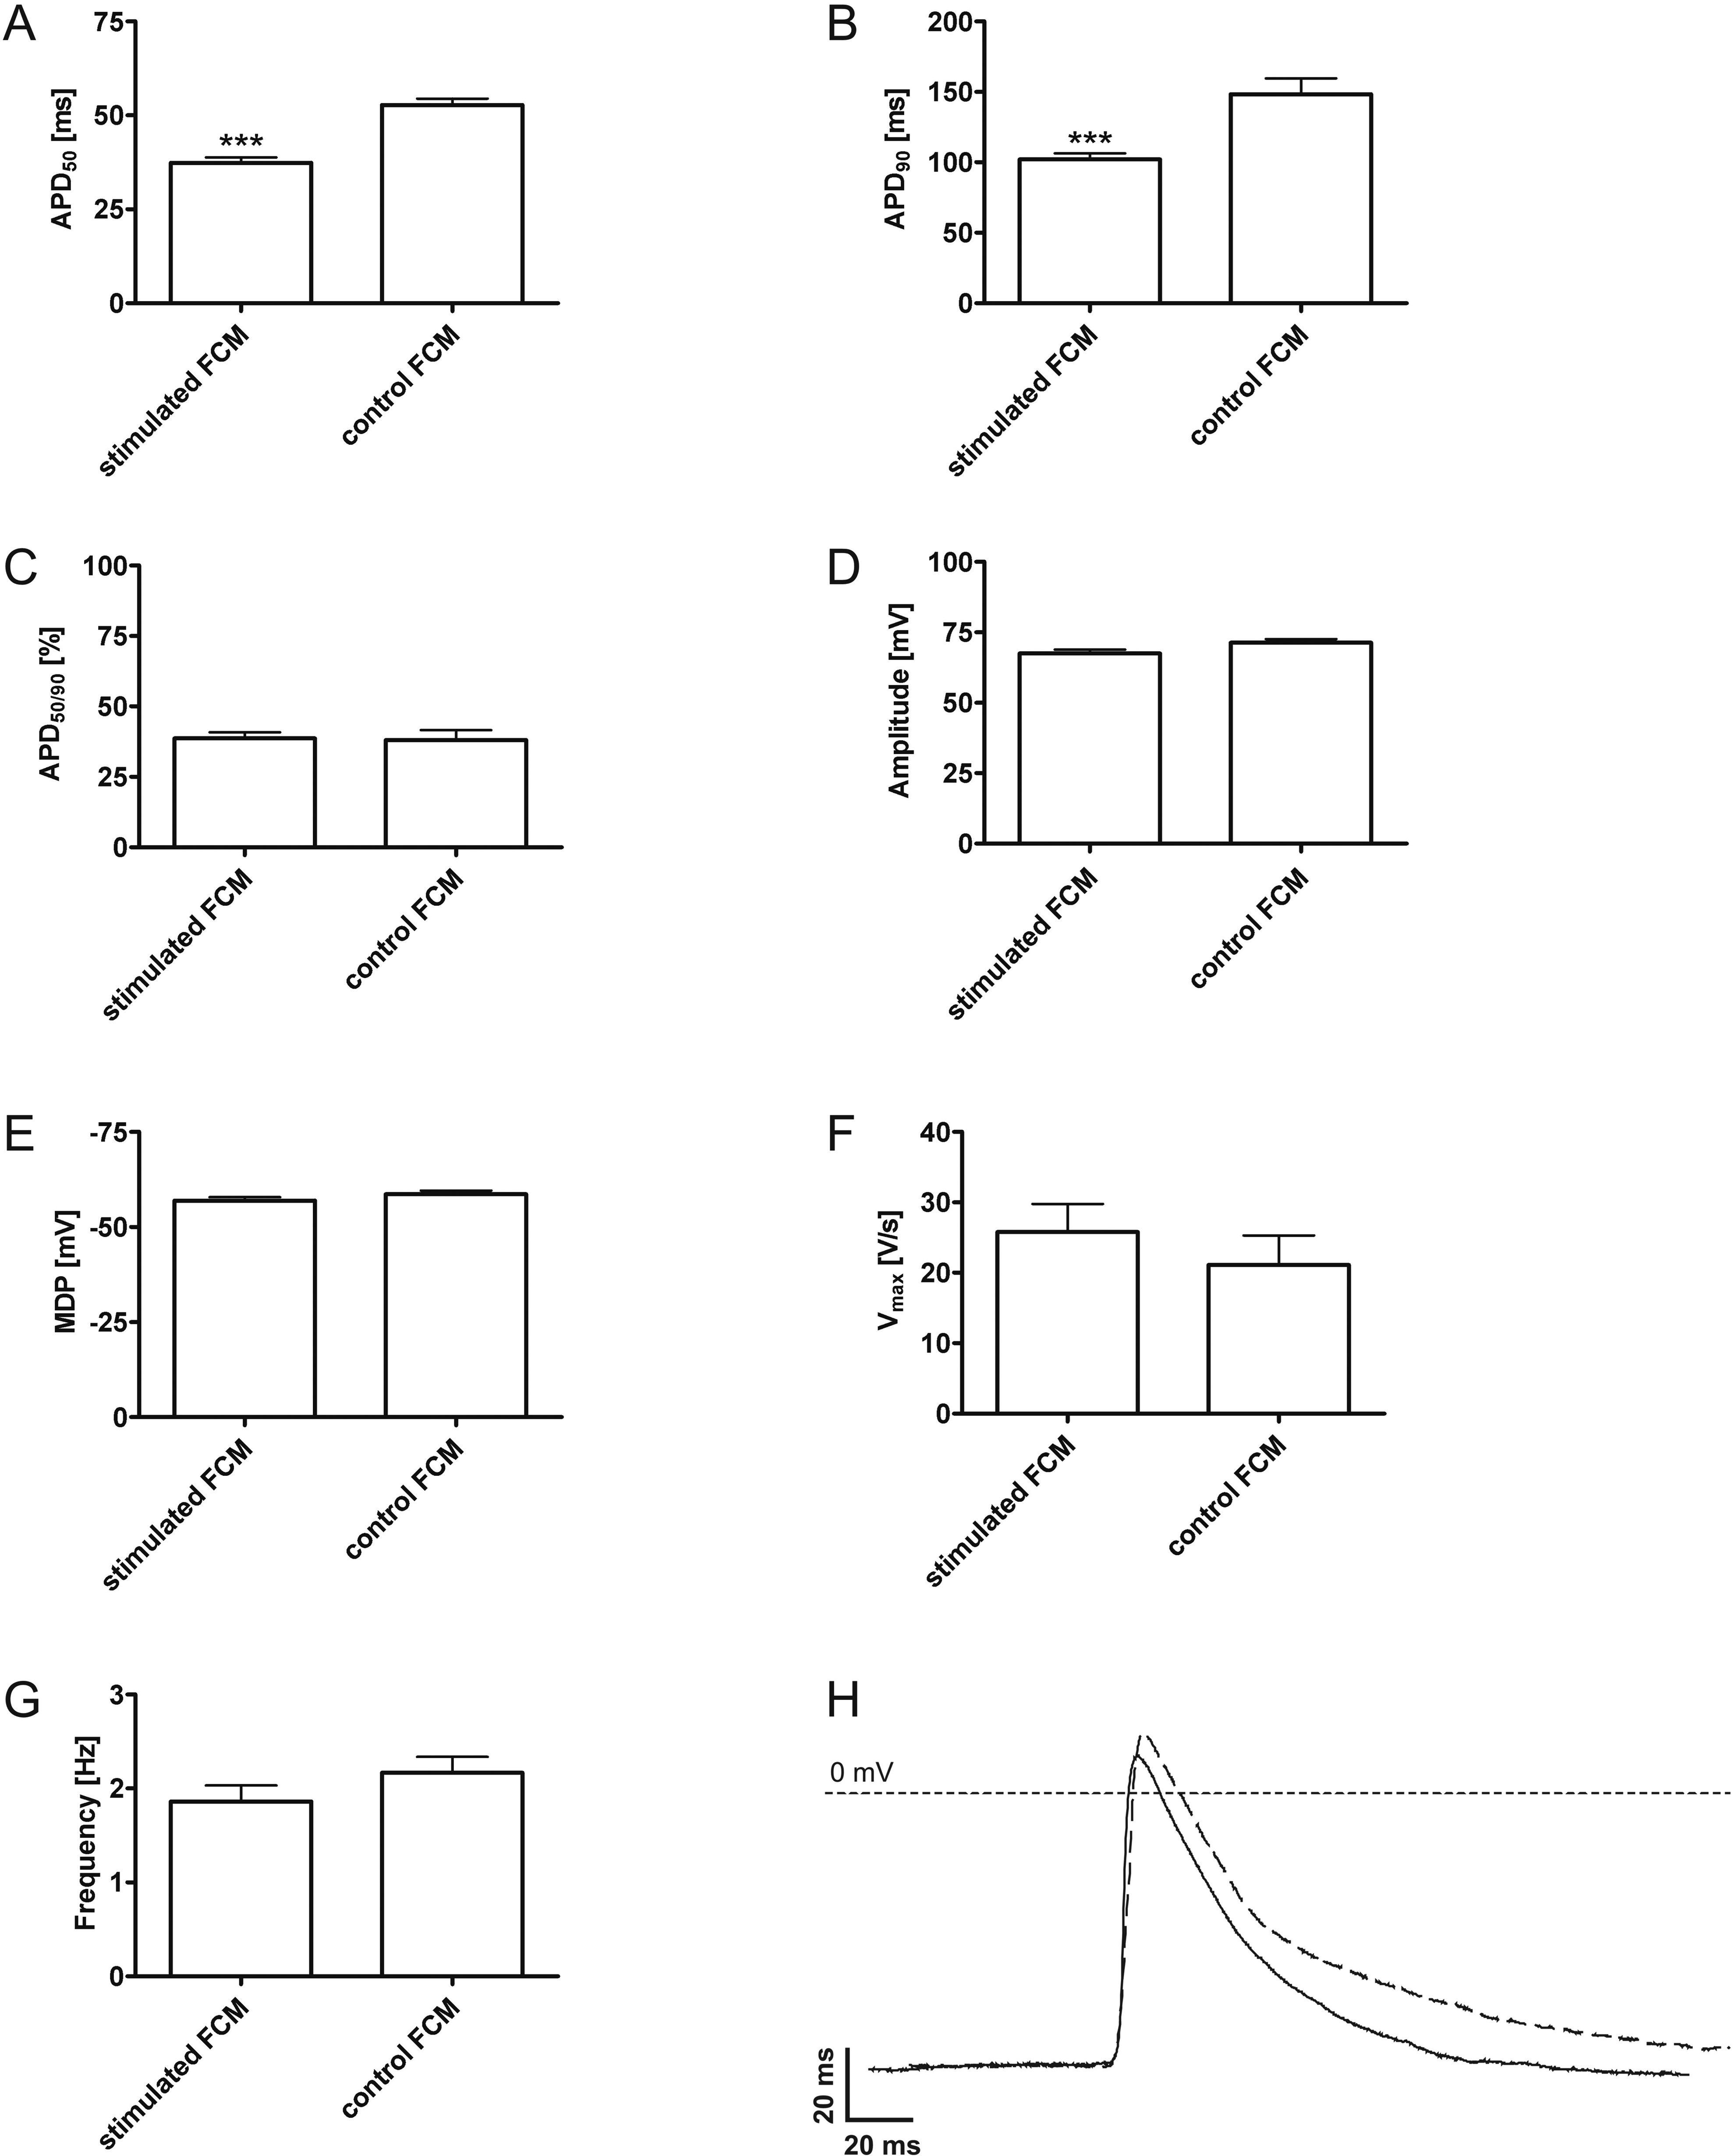
Action potential parameters. Action potential duration to 50% repolarization (APD50, A), action potential duration to 90% repolarization (APD90, B), ratio between APD50 and APD90 (APD50/90, C), action potential amplitude (D), maximal diastolic potential (MDP, E), maximal upstroke velocity (Vmax, F), and spontaneous beating frequency (G) of stimulated FCM and control FCM are presented. Exemplary action potentials of stimulated FCM (solid line) show a faster repolarization than in control FCM (dashed line, H). FCM indicates fetal cardiomyocytes.
Action Potential Parameters of Stimulated FCM and Control.a
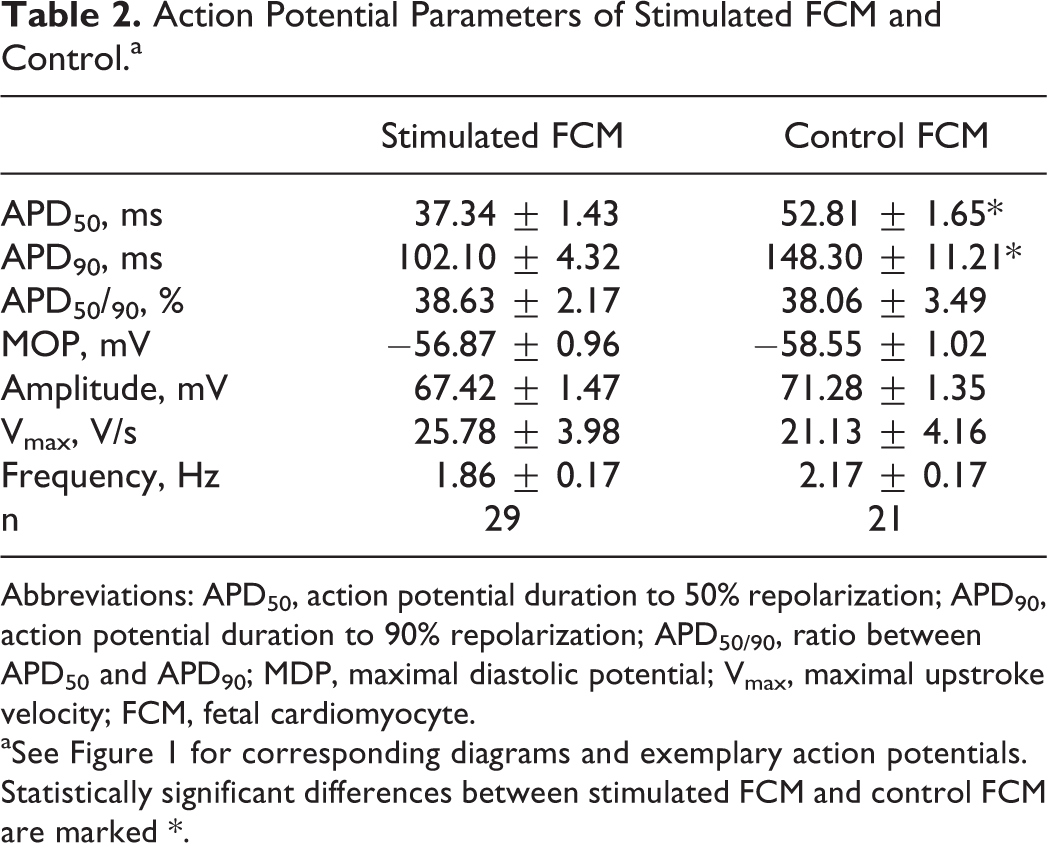
Abbreviations: APD50, action potential duration to 50% repolarization; APD90, action potential duration to 90% repolarization; APD50/90, ratio between APD50 and APD90; MDP, maximal diastolic potential; Vmax, maximal upstroke velocity; FCM, fetal cardiomyocyte.
aSee Figure 1 for corresponding diagrams and exemplary action potentials. Statistically significant differences between stimulated FCM and control FCM are marked *.
Structural Properties
Besides electrophysiological changes due to electrical stimulation, we analyzed the structural organization of the tissue, the cellular morphology of individual cells, and the expression of connexin 43. The angles between electrical field lines and longitudinal axes of stimulated FCM (8.44 ± 1.13°, n = 31 from 3 different preparations, Figure 2) were significantly lower and had a smaller variance than that of angles between longitudinal axes of control FCM and a fixed horizontal line (47.57 ± 3.44°, n = 46 from 3 different preparations, P < .001), that is, stimulated FCM aligned in parallel to the electrical field, whereas control FCM had a random orientation. The number of connexin 43 dots per cell was significantly increased in stimulated FCM (13.05 ± 0.55 dots/cell, n = 19 from 2 different preparations) when compared to control FCM (4.50 ± 0.58 dots/cell, n = 10 from 2 different preparations, P < .0001, Figure 3).
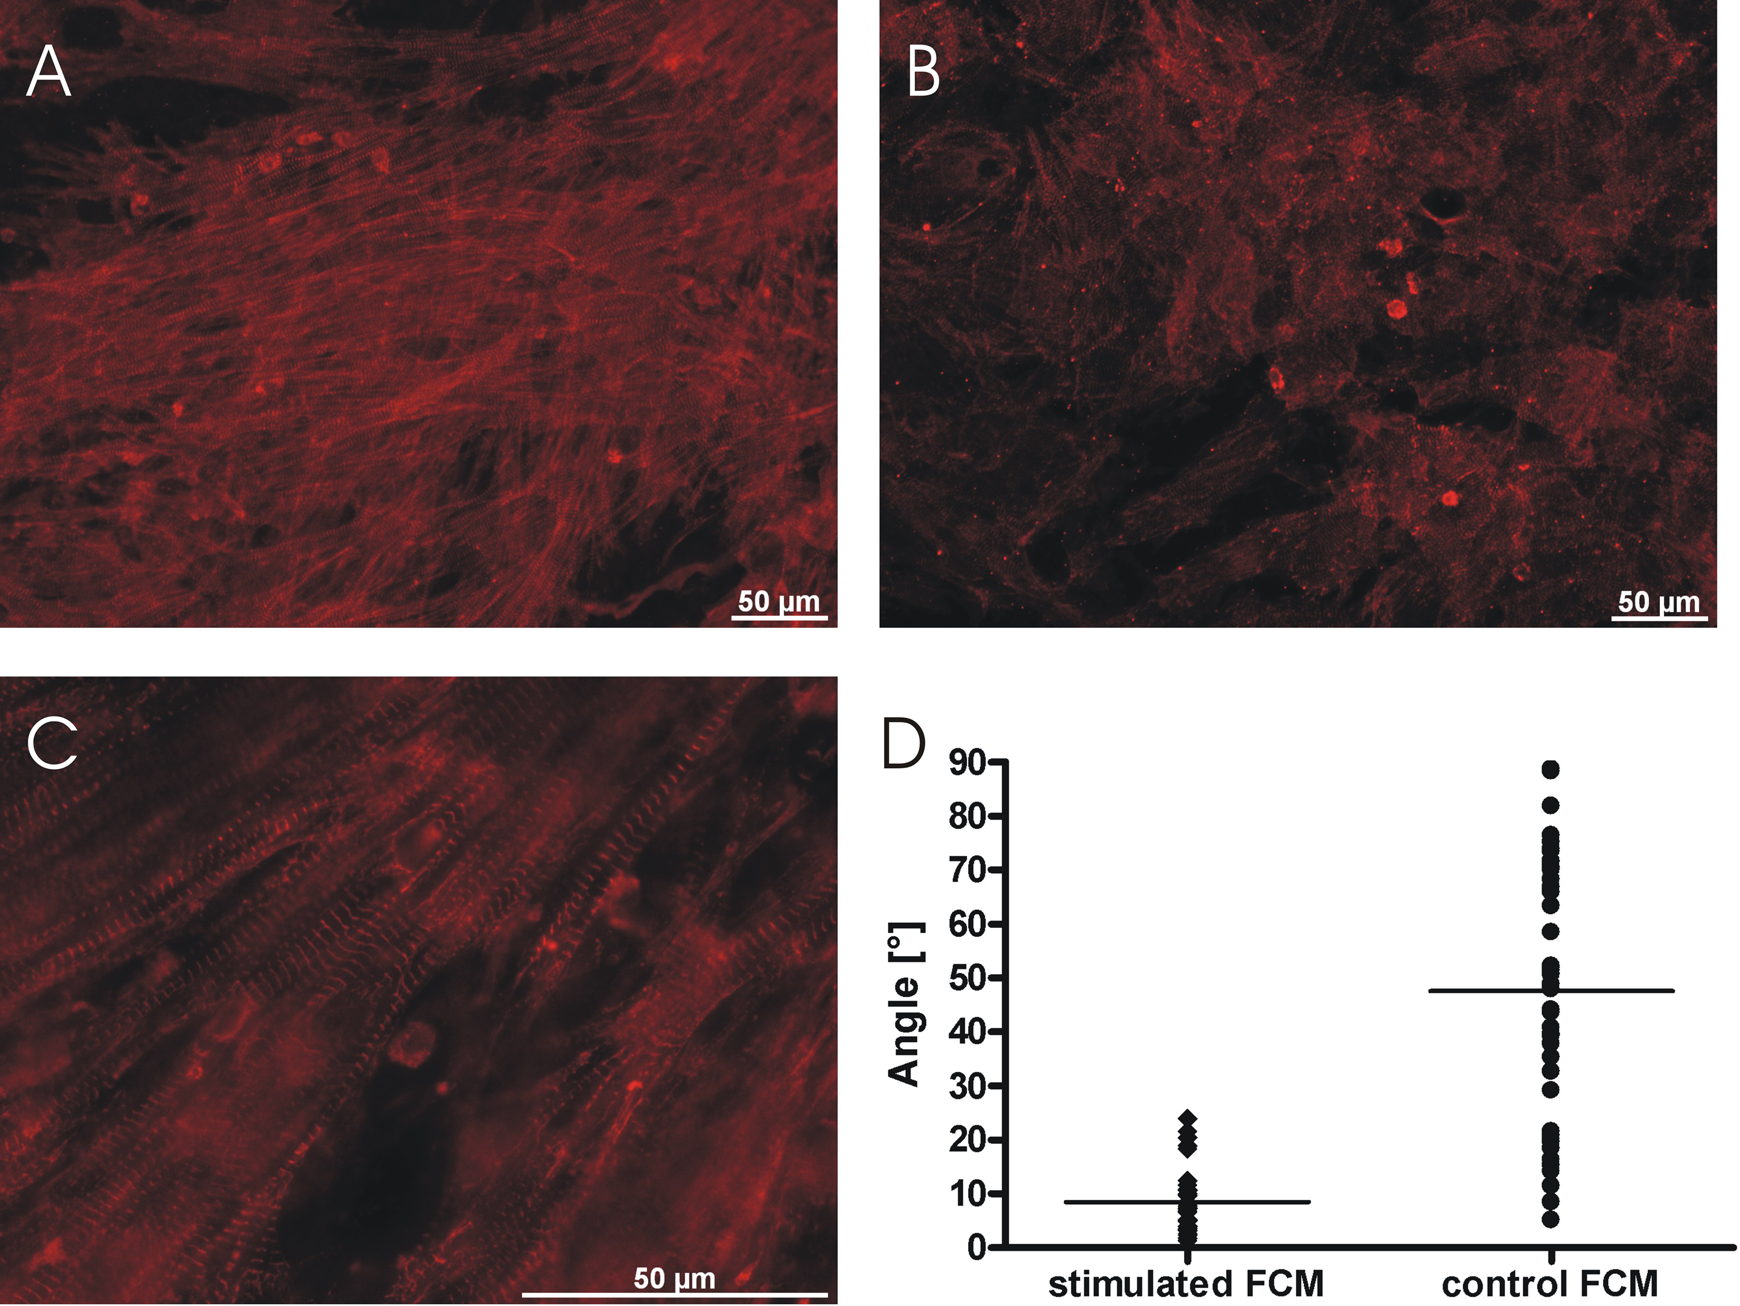
Alignment of stimulated FCM. Representative α-actinin immunostainings showed an alignment of stimulated cells (A, magnified view in C) in parallel to the electrical field and a random orientation of control FCM (B). Stimulated cells possessed a well-developed cross-striation (C). Angles between longitudinal axes of stimulated FCM and electrical field lines were significantly lower than between longitudinal axes of control FCM and a fixed horizontal line (D).
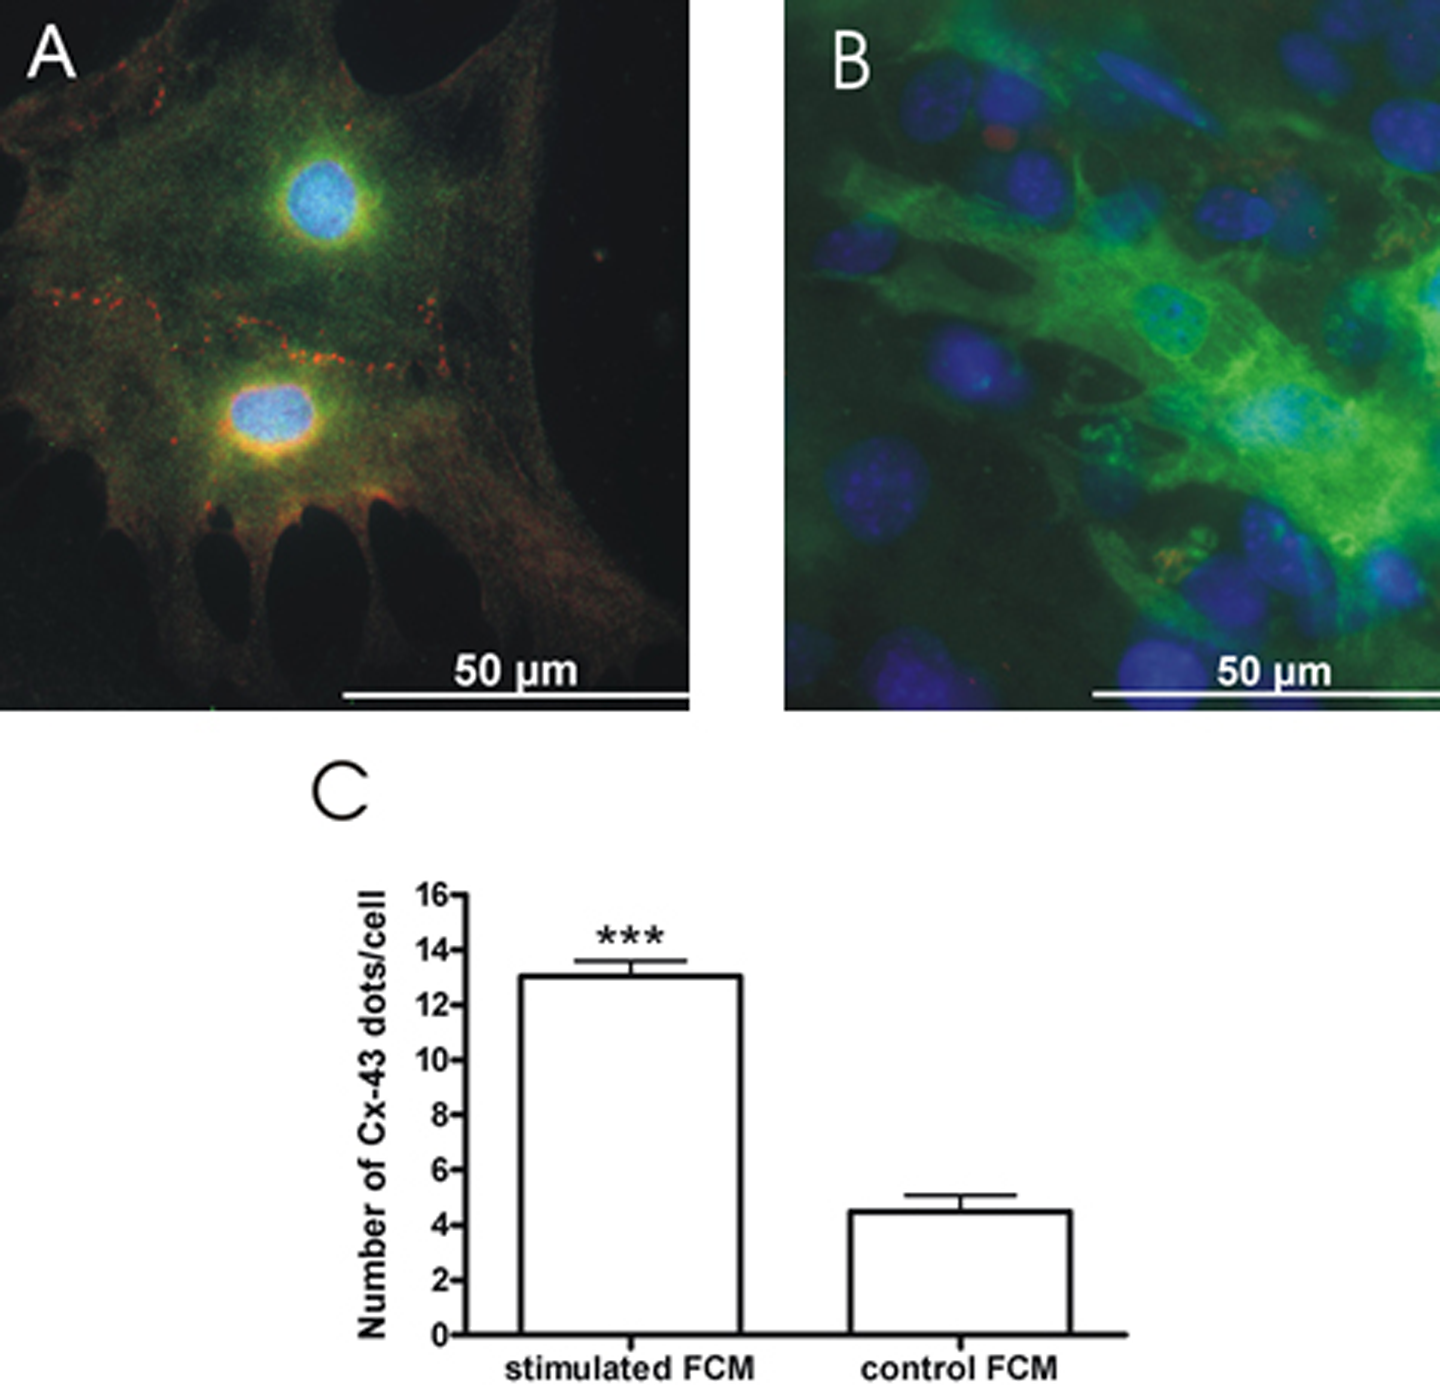
Expression of connexin 43. Merged images with connexin 43 (red), green fluorescent protein (green), and 4′,6-diamidino-2-phenylindole (DAPI; blue) immunostainings of stimulated FCM (A) and control FCM (B). Connexin 43 expression was higher in stimulated than in control FCM. The number of connexin 43 dots per cell of stimulated FCM (13.05 ± 0.55 dots/cell, n = 19 cells from 2 experiments) was significantly increased as compared to control FCM (4.50 ± 0.58 dots/cell, n = 10 cells from 2 experiments, P < .0001, C). FCM indicates fetal cardiomyocytes.
Stimulated FCM (71.51 ± 3.96 µm, n = 15 from 3 different preparations) were significantly longer than control FCM (33.33 ± 2.43 µm, n = 16 from 3 different preparations, P < .0001, Figure 4A). Cell width of stimulated FCM (41.48 ± 3.93 µm, n = 15 from 3 different preparations) was also increased when compared to control FCM (26.32 ± 1.91, n = 16 from 3 different preparations, P = .0014, Figure 4B). Ratio between cell length and cell width of the stimulated FCM (1.99 ± 0.27, n = 15 from 3 different preparations) was higher than in control FCM (1.29 ± 0.07, n = 16 from 3 different preparations, P = .0139, Figure 4C). Cell area of stimulated FCM (1329.83 ± 140.71 µm2, n = 15 from 3 different preparations) was larger than in control FCM (582.41 ± 53.76, n = 16 from 3 different preparations, P < .0001, Figure 4D).

Morphology of individual stimulated FCM. Cell length (A), cell width (B), ratio between cell length and cell width (C), and cell area (D) of stimulated FCM were significantly increased as compared to control FCM. FCM indicates fetal cardiomyocytes.
Ion Channel Expression
We determined the expression of different ion channel subunits to characterize the structural basis of the observed electrophysiological differences. An overview of the analyzed genes, the corresponding ion channel subunits, and currents is given in Supplemental Table 2. Kcnh2 (coding for the K+ channel subunit Kv11.1) was upregulated in the stimulated FCM by a mean factor of 1.4 when compared to control FCM (Figure 5, P = .001). Kcnd2 (coding for the K+ channel subunit Kv4.2) was upregulated in stimulated FCM by a mean factor of 2.2 when compared to control FCM (Figure 5, P = .018). Expression of Slc8a1 (coding for the Na+–Ca2+ exchanger channel subunit NCX1), Cacna1c (coding for the Ca2+ channel subunit Cav1.2), and Kcnb1 (coding for the K+ channel subunit Kv2.1) was not different in stimulated FCM and control FCM (Figure 5, all P > .05).

Ion channel gene expression. Mean expression (mean fold change) of Slc8a1, Kcnh2, Cacna1c, Kcnd2, and Kcnb1 in stimulated versus control FCM (control = 1). Samples of stimulated and control FCM originated from 3 independent isolations/hearts with up to 3 samples per group and isolation. Kcnh2 and Kcnd2, which code for the α-subunits of K+ channels generating IKr and Ito, were significantly upregulated in stimulated versus control FCM (P = .001 and P = .018, respectively). FCM indicates fetal cardiomyocytes.
Discussion
The signals and mechanisms inducing maturation of cardiomyocytes are poorly understood but are of major scientific interest. Electrophysiological and morphological maturation is an important precondition for a safe and efficient cardiac cell therapy, regardless of the mode of cell application, that is, injection of dissociated cardiomyocytes or transplantation of engineered heart tissue constructs. Electrical stimulation during in vitro culture has been shown to enhance structural maturation and alignment of cultivated immature cardiomyocytes. 6 –8 In the present study, we demonstrate that electrical stimulation also affects action potential properties of murine FCM in culture. Electrophysiological alterations were characterized by a decrease in APD50 and an increased expression of Kcnh2 and Kcnd2, which also occur during native perinatal development, pointing to an electrophysiological maturation due to electrical stimulation. Moreover, we found an enhanced cell alignment, increased expression of connexin 43, elongation, and larger size of stimulated murine FCM.
Electrophysiological Maturation
Action potential recordings in FCMd14 and FCMd18 demonstrated a decline in APD50 during native murine development. This finding is in line with previous publications, 11,15 –17 and APD50 is regarded as the most relevant indicator of electrophysiological maturation in mice. Thus, we interpret the decrease in APD50, which was observed in stimulated compared to nonstimulated murine FCM, as a sign of electrophysiological maturation of stimulated cells. Another recently published study has also demonstrated an effect of electrical stimulation on electrophysiological properties. 11 In biowires, that is, 3-dimensional cardiac tissue derived from human pluripotent stem cells, electrical stimulation enhanced excitation threshold, maximum capture rate, and conduction velocity. On the single cell level, densities of the repolarizing currents hERG and IK1 increased after electrical stimulation, but no changes in action potential duration or other action potential parameters were observed. Overall, the authors interpreted electrophysiological alterations in stimulated biowires as maturation. The lack of change in action potential duration in electrically stimulated human biowires, which is in contrast to our data from murine FCMs, may be explained by interspecies differences: While the plateau phase vanishes during native murine perinatal development, 16–17 human cardiomyocytes retain a long plateau phase from fetal to adult stage.
Maximal diastolic potential, which has been shown to remain unchanged during embryonic, fetal, and early neonatal development, 17,18 was not different in stimulated FCM and control FCM. In human biowires, MDP remained unchanged under electrical stimulation, too.
Electrophysiological maturation is a complex process involving changes in the expression levels of many different ion channels. 19 We found an increase in the expression of Kcnd2 and Kcnh2. The Kcnd2 gene encodes for Kv4.2, which is the α subunit of the voltage-gated K+ channel generating the fast transient outward K+ current Itof. 20 The Kcnh2 gene encodes for Kv11.1 (merg1), the α-subunit of the voltage-gated K+ channel generating the delayed rectifier K+ current IKr. 20 –22 During native murine development, Kv4.2 and Kv11.1 have been shown to increase, 19 confirming that the changes in electrophysiological properties described here after electrical stimulation of FCM are consistent with native maturation. Increased Kv4.2 and Kv11.1 expression may have led to a raise in Itof and IKr, resulting in the reduction in APD50 observed here.
On the other hand, expression of Kcnb1, Cacna1, and Slc8a1 was comparable between stimulated and nonstimulated cardiomyocytes in our experiments. During murine heart development, Kcnb1 and Cacna1 or their respective currents actually increase, 23,24 and Slc8a1 is downregulated in late fetal cardiac development. 25 Therefore, electrical stimulation of cultivated FCM may induce electrophysiological alterations similar to native development but may not promote all aspects of the complex process of electrophysiological maturation.
Additionally, an interdependence between gap junction and K+ channel expression has been shown using a connexin 43 knockout mouse model. 26 These data are in line with our findings, suggesting that electrical activation is important for maturation and that the electrophysiological maturation of cardiomyocytes during cardiogenesis in vivo may at least partially depend on electrical activity.
Structural Properties
Murine stimulated FCM aligned along the electrical field lines, whereas control FCM had a random orientation. This finding has also been described for rat cardiomyocytes. 6,7,27 Electrical stimulation led to an increased number of connexin 43 dots in murine FCM, which is consistent with previous data on rat cardiomyocytes showing a higher level of connexin 43 expression 6,9 and a more polarized expression pattern under electrical stimulation. 7 –9,27
Cell length, cell length to width ratio, and cell area increase considerably during native cardiac development. 28 In the present study, these parameters were significantly higher in stimulated than in control FCM, indicating a more mature phenotype of stimulated FCM. Cultivation of neonatal rat cardiomyocytes under continuous electrical stimulation also promoted cell elongation. 8,9 Like in stimulated FCM, cell length increases more than cell width in murine cardiomyocytes during embryonic and neonatal development, leading to an unidirectional growth of these cells. This elongation defines a short and a long axis of the cardiomyocytes, and the myofibrils get aligned to the long axis of the cell. 28
Implications for Cell Therapy
The morphological and functional alterations induced by electrical stimulation of FCM, that is, parallel alignment of cells, higher expression of connexin 43, and electrophysiological maturation, are desirable for in vitro tissue engineering and may also be beneficial for intramyocardial cell therapy with dissociated cardiomyocytes, as electrical coupling may be enhanced and electrophysiological inhomogeneities between graft and host may be reduced. Therefore, electrical stimulation could be a valuable method to precondition cardiomyocytes before transplantation and to make cell therapy more efficient and safe. Future cell therapy studies are warranted to confirm this hypothesis.
Conclusions
The decrease in APD50, the increase in Kcnd2 and Kcnh2, and the morphological alterations promoted by electrical stimulation of FCM in vitro correspond to the maturation of native FCM during fetal development. However, not all aspects of native electrophysiological maturation could be induced by electrical stimulation, for example, the expression of Kcnb1, Cacna1, and Slc8a1 remained unchanged.
These findings improve our understanding of the complex process of cardiomyocyte maturation and may help to optimize strategies of cardiac tissue engineering or cell therapy, for example, through electrical preconditioning.
Footnotes
Acknowledgments
We acknowledge the support provided by the workshops and the animal facility of the Institute of Neurophysiology. Especially, we thank Mr Metzner and his team for the production of stimulation chambers and casting molds as well as Katja Urban for her helpful technical assistance.
Authors’ Note
Sven Baumgartner and Marcel Halbach contributed equally to this work.
Declaration of Conflicting Interests
The author(s) declared no potential conflicts of interest with respect to the research, authorship, and/or publication of this article.
Funding
The author(s) disclosed receipt of the following financial support for the research, authorship, and/or publication of this article: This work was supported by the Boll-Stiftung (grant 210/03-12) and the Else Kröner-Fresenius-Stiftung (grant P79/08//A95/08).