
Abstract
Hypoxia is a consequence of cardiac disease and downregulates mitochondrial metabolism, yet the molecular mechanisms through which this occurs in the heart are incompletely characterized. Therefore, we aimed to use a contracting HL-1 cardiomyocyte model to investigate the effects of hypoxia on mitochondrial metabolism. Cells were exposed to hypoxia (2% O2) for 6, 12, 24, and 48 hours to characterize the metabolic response. Cells were subsequently treated with the hypoxia inducible factor (HIF)-activating compound, dimethyloxalylglycine (DMOG), to determine whether hypoxia-induced mitochondrial changes were HIF dependent or independent, and to assess the suitability of this cultured cardiac cell line for cardiovascular pharmacological studies. Hypoxic cells had increased glycolysis after 24 hours, with glucose transporter 1 and lactate levels increased 5-fold and 15-fold, respectively. After 24 hours of hypoxia, mitochondrial networks were more fragmented but there was no change in citrate synthase activity, indicating that mitochondrial content was unchanged. Cellular oxygen consumption was 30% lower, accompanied by decreases in the enzymatic activities of electron transport chain (ETC) complexes I and IV, and aconitase by 81%, 96%, and 72%, relative to controls. Pharmacological HIF activation with DMOG decreased cellular oxygen consumption by 43%, coincident with decreases in the activities of aconitase and complex I by 26% and 30%, indicating that these adaptations were HIF mediated. In contrast, the hypoxia-mediated decrease in complex IV activity was not replicated by DMOG treatment, suggesting HIF-independent regulation of this complex. In conclusion, 24 hours of hypoxia increased anaerobic glycolysis and decreased mitochondrial respiration, which was associated with changes in ETC and tricarboxylic acid cycle enzyme activities in contracting HL-1 cells. Pharmacological HIF activation in this cardiac cell line allowed both HIF-dependent and independent mitochondrial metabolic changes to be identified.
Introduction
Hypoxia is an intrinsic component of numerous cardiac diseases, including myocardial infarction, hypertrophy, and heart failure. 1 However, our understanding of hypoxia’s contribution to the complex pathophysiology of these disease states, and of the molecular pathways involved, is incomplete. Cell metabolism is highly influenced by oxygen levels, and in hypoxia, cardiomyocyte metabolism is “remodeled,” with increased anaerobic glycolysis and decreased rates of respiration. 2,3 In the heart, mitochondria are the primary cellular oxygen consumers and account for approximately 90% of cardiac adenosine triphosphate (ATP) production. 4 Therefore, mitochondrial metabolism is an important regulatory target during hypoxia. In rats chronically housed in hypoxia, we found cardiac mitochondrial respiration to be downregulated; mediated by specific decreases in the electron transport chain (ETC) complexes I, II, and IV and the tricarboxylic acid (TCA) cycle enzyme aconitase. 5 However, the mechanisms responsible for these adaptations are currently unclear and require investigation.
In metazoan cells, the response to hypoxia is largely orchestrated by the transcription factor, hypoxia inducible factor (HIF). Hypoxia inducible factor 1α is the best characterized isoform of this protein and activates target genes involved in cellular hypoxic adaptation, such as vascular endothelial growth factor (VEGF), which stimulates angiogenesis. 6 Hypoxia inducible factor 1α is important for mediating metabolic changes in hypoxia and stimulating transcription of lactate dehydrogenase (LDH) and glucose transporter 1 (GLUT1), which increase glycolysis, facilitating the switch from oxidative to anaerobic glycolytic metabolism in the presence of decreased oxygen levels. 7 –9 A number of mitochondrial HIF-1α targets have been identified in noncardiac tissues and cells; these include pyruvate dehydrogenase kinase 1 (PDK1), which inactivates pyruvate dehydrogenase thereby preventing the oxidative decarboxylation of pyruvate to acetyl-coenzyme A, 10 and a cytochrome c oxidase (COX) 4-1 to COX4-2 subunit switch in ETC complex IV, which maintains respiratory efficiency in hypoxic liver and lung. 11 Additionally, HIF-1α-dependent mitochondrial autophagy removes mitochondria and represses mitochondrial biogenesis to maintain oxygen homeostasis during prolonged hypoxia. 12 Thus, HIF-1α is involved in regulating mitochondrial metabolism during hypoxia but whether additional mitochondrial HIF-dependent and independent targets of hypoxia exist is less certain.
The molecular mechanisms underlying hypoxic adaptation have been investigated in a variety of cell types but studies in cardiac cells have been limited by the lack of adult characteristics and short culture viability of embryonic and neonatal cardiomyocytes. The HL-1 mouse cardiomyocyte cell line has recently emerged as a useful model of cardiac physiology as cells maintain a differentiated contracting phenotype over many passages in cell culture and exhibit cardiomyocyte-specific hypoxia inducible genes. 13 –16 Establishing a relevant cell culture system to dissect the molecular mechanisms involved in hypoxic responses in the heart may enable a greater understanding of the metabolic effects of hypoxia. In addition, it may provide an easily accessible model for testing pharmacological hypoxia-mimetics, which may be useful clinically for preconditioning the heart prior to myocardial infarction.
Although previous studies have cultured HL-1 cardiomyocytes in hypoxia, 14 the metabolic changes induced by hypoxia have not been completely characterized in this cell line. In contrast to adult cardiomyocytes in vivo, HL-1 cells are highly glycolytic 17 and have a more irregular mitochondrial organization. 18 Thus, investigation of the mitochondrial response to hypoxia in this cell line is necessary to ascertain its utility as a model system to complement in vivo studies of the metabolic responses of cardiomyocytes to hypoxia.
Therefore, this study aimed to establish a cell culture model of hypoxia and pharmacological HIF activation in HL-1 cardiomyocytes and to use this to investigate whether the mitochondrial enzymes that are downregulated in hypoxia are regulated by HIF-dependent or independent mechanisms.
Materials and methods
HL-1 Cardiomyocyte Cell Culture
HL-1 cardiomyocytes, a kind gift from William Claycomb (Louisiana State University), were grown in flasks precoated with 5 μg/mL fibronectin and 0.02% gelatin. Cells were maintained in Claycomb medium (Sigma, United Kingdom), supplemented with 10% fetal bovine serum (FBS), 0.3 mmol/L ascorbic acid, 0.1 mmol/L norepinephrine, 2 mmol/L glutamine, 100 U/mL penicillin and 100 μg/mL streptomycin, and incubated under standard culture conditions (37°C, 5% CO2, and 95% humidity). Once cells were confluent and beating, they were transferred to a hypoxic incubator (2% O2, 5% CO2, and 93% N2) for 6 to 48 hours or treated with the HIF activator, dimethyloxalylglycine (DMOG), at a concentration of 1mmol/L for 24 hours. Aliquots of culture media were collected during the experiments and concentrations of lactate, glucose, and LDH were measured using an automated clinical chemistry analyzer (Horiba ABX, United Kingdom). Cells were harvested and used immediately for respiration and confocal microscopy, lysed for Western blotting (in the presence of protease inhibitor) and real-time polymerase chain reaction (PCR), or frozen for enzyme assays.
Cell Proliferation Assays
HL-1 cells (500 000 cells per well) were seeded in 6-well plates and incubated for 24 hours to allow cell adherence. Cells were exposed to hypoxia (6 to 48 hours), trypsinized, and counted using a hemocytometer under a light microscope. Cell viability was subsequently assessed using a trypan blue dye exclusion assay (Sigma).
Western Blotting
Protein expression levels were measured in cells using sodium dodecyl sulfate polyacrylamide gel electrophoresis and Western blotting, as described previously. 19 Membranes were stained with ponceau dye, to assess uniform loading and transfer of proteins, and all samples were run in duplicate on separate gels to confirm results. Band intensities were quantified using UN-SCAN-IT gel software (Silk scientific, Utah, USA). Citrate synthase antibody was purchased from Alpha Diagnostic International (San Antonio, USA); α-ketoglutarate dehydrogenase and medium-chain fatty acyl-coenzyme A dehydrogenase (MCAD) antibodies were purchased from Santa Cruz (Texas, USA); antimembrane-associated fatty acid-binding protein (anti-FABPm) antibody was as used previously 19 ; GLUT1 primary antibody was purchased from Abcam (Cambridge, UK); HIF-1α and HIF-2α antibodies were obtained from Novus Biological (Cambridge, UK) and antibodies against cleaved and uncleaved caspase 3 and for PDK1 were purchased from Cell Signalling Technology (Danvers, USA).
RNA Extraction and Real-Time Quantitative Reverse Transcriptase PCR
Total RNA was extracted and purified from ≤5 × 10⁶ confluent HL-1 cells, using a QIAGEN RNeasy Mini Kit (QIAGEN, United Kingdom). RNA concentration and purity were determined by measuring the absorbance at 230, 260, and 280 nm, using a NanoDrop spectrophotometer (NanoDrop technologies, Wilmington, USA). Complementary DNA was synthesized from RNA using a high-capacity reverse transcriptase kit (Applied Biosystems, Paisley, UK) according to the manufacturer’s instructions. Primers to VEGF were designed using Primer3 software, based on interpretation of Ensembl Genome Browser search results and were obtained from Eurofins MWG Operon (United Kingdom). The VEGF primer sequences were forward: 5′-CAGGCTGCTGTAACGATGAA-3′and reverse: 5′-GCATTCACATCTGCTGTGCT-3′, and for β-actin were forward: 5′-GATCTGGCACCACACCTTCT-3′and reverse: 5′-GGGGTGTTGAAGGTCTCAAA-3′. Real-time PCR amplification was performed using the Applied Biosystems StepOnePlus Real-time PCR system (AB 44 International, Canada), as described previously 20 with postamplification melting curves acquired to verify the specificity of PCR products. Relative quantification of VEGF expression normalized to the housekeeping gene, β-actin was performed using the 2-ΔΔCt method. 21
Confocal Microscopy
HL-1 cells (100 000 per well) were seeded on 13-mm glass cover slips in 24-well plates and incubated for 24 hours to allow cell adherence. Following exposure to hypoxia or normoxia for 24 hours, cells were labeled with 50 nmol/L mitotracker Red CMXRos (Invitrogen, Paisley, UK) for 15 minutes and fixed with 4% paraformaldehyde for 10 minutes. Fixed cells were permeabilized with 0.1% Triton-X100 (Sigma) for 10 minutes, blocked for 30 minutes in FBS (2%) and BSA (2%) and incubated with GLUT1 (Abcam) or complex IV (Mitosciences, Oregon, USA) primary antibodies, for 1 hour, followed by Alexa 488 goat antirabbit and goat antimouse secondary antibodies, respectively (Invitrogen) for 30 minutes. Cover slips were mounted on microscope slides in vectoshield with 4′,6-diamidino-2-phenylindole nuclear stain (Vector Labs, Peterborough, UK). Images were acquired using a Zeiss LSM 510 META confocal microscope (Carl Zeiss, Germany) and processed using Zeiss LSM image browser software. Mitochondrial distribution in mitotracker-stained cells was quantified according to the method of Spinazzi et al. 22
Respiration Measurements
HL-1 cells (approximately 2 × 10⁶) were harvested by incubation with 0.05% trypsin-EDTA at 37°C and washed twice in KME buffer (100 mmol/L KCl, 50 mmol/L morpholonepropanesulfonic acid [MOPS], 0.5 mmol/L ethylene glycol tetraacetic acid, pH 7.4). Cells were resuspended in respiratory media (100mmol/L KCl, 50 mmol/L MOPS, 1mmol/L EGTA, 5mmol/L KH2PO4, and 1 mg/mL BSA, pH 7.4), and oxygen consumption was measured in a Clark-type oxygen electrode (Strathkelvin, United Kingdom). Respiration was measured following sequential addition of pyruvate (5 mmol/L) and malate (2.5 mmol/L), the ATP synthase inhibitor, oligomycin (2 mmol/L), and the metabolic uncoupler, carbonyl cyanide p-trifluoromethoxy phenylhydrazone (FCCP; 10 mmol/L). For initial oxygen consumption experiments in this cell line, respiration rates were also measured in the presence of glucose (12 mmol/L) and oleic acid (0.4 mmol/L). Cell respiration rates were calculated using Strathekelvin 782 oxygen system V3.0 software and normalized to cell protein content, measured with a bicinchoninic acid protein assay detection kit (Pierce, United Kingdom).
Electron Transport Chain Complex Activity Assays
Enzyme activities of ETC complexes I-IV, aconitase, and citrate synthase were measured in freeze-thawed cells using methods based on published protocols. 23
Statistics
Data are expressed as mean ± standard error of the mean and were analyzed using unpaired t tests or a 1-way analysis of variance with a Tukey post hoc test (IBM SPSS statistics 19). Values of P < .05 were taken to be statistically significant.
Results
Metabolic Characterization of HL-1 cells
To ascertain whether HL-1 cardiomyocytes have active mitochondrial oxidative and fatty acid metabolic pathways, as the adult heart does, respiration was measured with glucose, pyruvate, and oleic acid, and proteins involved in TCA cycle and fatty acid metabolism were investigated. This revealed that HL-1 cells were able to metabolize all 3 substrates with appreciable rates of oxygen consumption (Figure 1A-C). Additionally, mitochondrial proteins including the TCA cycle enzyme, α-ketoglutarate dehydrogenase, PDK1, and the fatty acid metabolism-associated enzymes, MCAD and membrane-associated fatty acid-binding protein, could be easily detected (Figure 1D). This demonstrated that HL-1 cells are capable of performing oxidative metabolism, including oxidation of fatty acids; both salient features of cardiac metabolism.
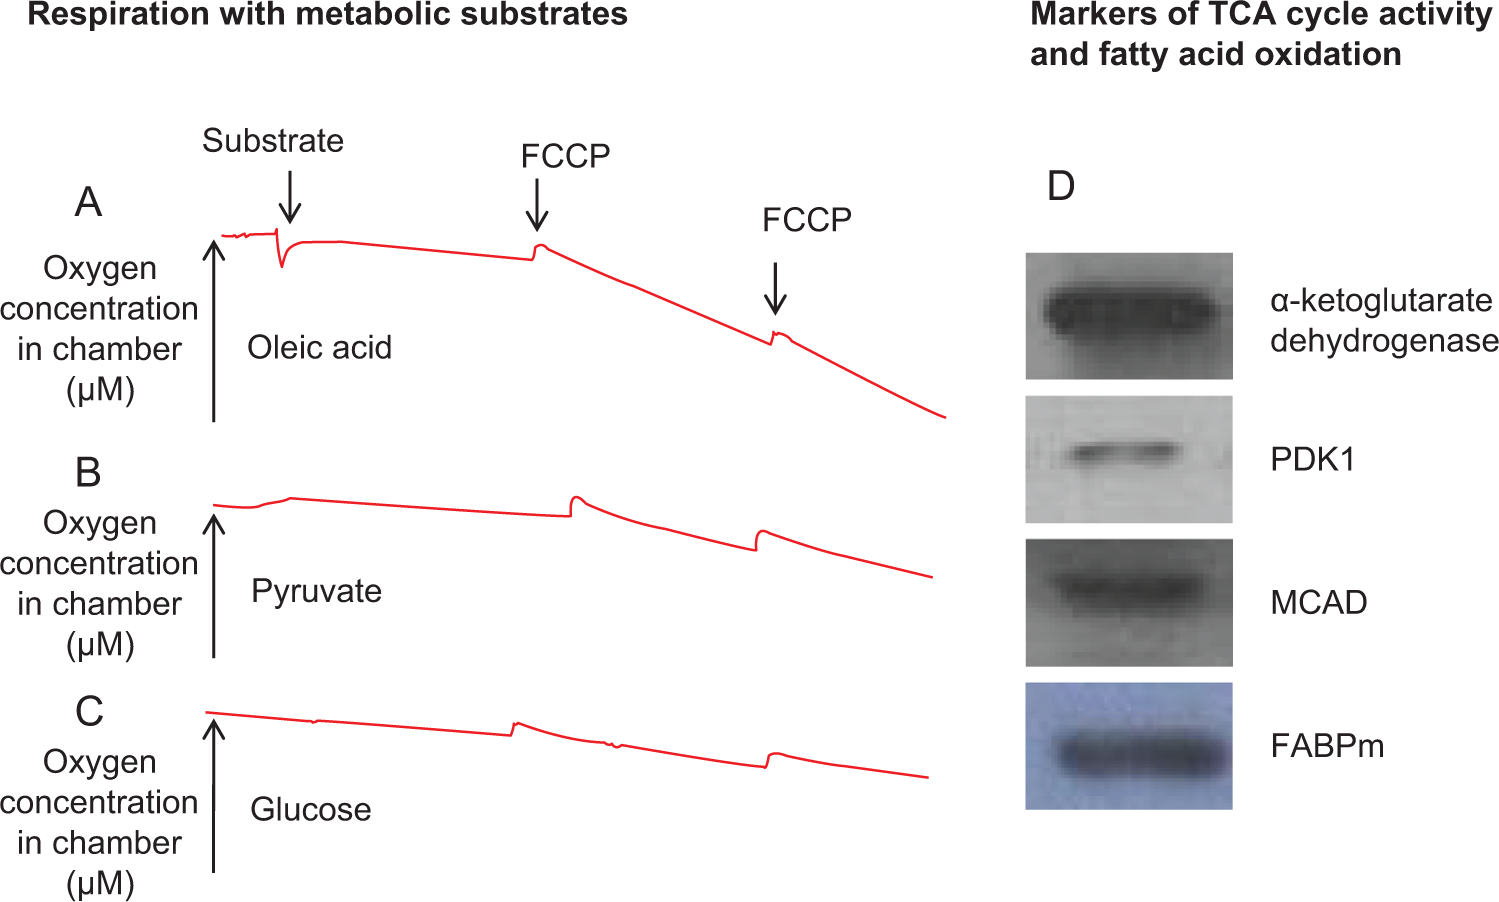
Metabolic characterization of HL-1 cardiomyocytes: Respiration of HL-1 cells with oleic acid (A), pyruvate (B), and glucose (C). Representative traces for each substrate. Metabolic proteins involved in the TCA cycle and fatty acid oxidation (D); n = 3 to 6 per group. TCA indicates tricarboxylic acid.
Hypoxic Cell Culture
HL-1 cardiomyocytes were exposed to hypoxia for 6, 12, 24, and 48 hours, in order to establish a suitable time point for study of hypoxia-induced metabolic changes. When cells were counted after 6 to 24 hours of hypoxia, cell numbers did not differ from controls (Figure 2A), indicating that this length of hypoxic exposure did not impair cell proliferation rates. However, there were significantly fewer cells compared with controls after 48 hours of hypoxia. Markers of cellular damage and death, LDH released into the cell culture media, and cellular-cleaved caspase 3 protein levels were increased 2-fold and 4-fold, respectively, after 48 hours of hypoxia, compared with controls (Figure 2B and C), attributing the decreased cell numbers to increased cell death. There were no changes in these markers after 6 to 24 hours of hypoxia; therefore, 24 hours of hypoxia was chosen for subsequent experiments.

Characterization of cell responses to hypoxic culture. Proliferation of cells during hypoxic incubation (A), LDH concentration in culture media (B), and cellular levels of cleaved caspase 3 protein (C) *P < .01 versus controls; n = 3 per group. LDH indicates lactate dehydrogenase.
To study the hypoxic signaling pathways in our cells, protein levels of HIF-1α were measured in cells following 6 to 24 hours of hypoxia. There was an 8-fold increase in HIF-1α protein levels relative to normoxic controls after 6 hours of hypoxia, with a further increase to 14-fold by 12 hours, and levels remained greater than controls at 24 hours of hypoxia (Figure 3A). This indicated that cells were sensing the decreased oxygen levels and instigating appropriate hypoxic responses. To corroborate this, levels of the HIF-1α target genes, PDK1 and VEGF, were measured at the protein and messenger RNA levels, respectively, and found to be increased by 34% and 37% after 24 hours of hypoxia (Figure 3B and C). Protein levels of the homologous HIF-2α protein were increased by 72% after 24 hours of hypoxia (Figure 3D); a response consistent with upregulation of HIF signaling during hypoxia.

Characterization of HIF-mediated responses to hypoxia. HIF-1α protein levels (A) and protein and mRNA levels of its target genes PDK1 (B) and VEGF (C). HIF-2α protein levels (D). *P < .01 versus controls; + P < .05 versus 6 hours and 24 hours; n = 4 to 6 per group. HIF indicates hypoxia inducible factor; mRNA, messenger RNA; PDK1, pyruvate dehydrogenase kinase 1; VEGF, vascular endothelial growth factor.
Adaptation of Glucose Utilization During Hypoxia
Protein levels of the HIF-1α-regulated GLUT1 were measured and found to be increased more than 5-fold relative to controls between 6 and 24 hours of hypoxia (Figure 4A). Analysis of GLUT1 protein in cells by confocal microscopy after 24 hours of hypoxia verified this increase and also revealed increased plasma membrane localization of GLUT1 in hypoxic cells (Figure 4D). Thus, hypoxia modifies both the expression and the cellular localization of GLUT1 in order to increase the cellular capacity for glucose uptake.

Elevated glycolysis following hypoxia. GLUT1 protein levels in cells after 6 to 24 hours of hypoxia (A), lactate production (B), and glucose levels (C) in culture media following 6 to 24 hours of hypoxia. *P < .01 versus control cells; # P < .01 versus control and 6 hours, n = 3 to 6 per group. Confocal microscopy images of HL-1 cardiomyocytes after 24 hours of normoxia or hypoxia (D). Images show cells stained for nuclei with DAPI (1), GLUT1 protein marked with Alexa Fluor 488 secondary antibody (2), mitochondria stained with mitotracker (3), and the merged image (4). GLUT1 indicates glucose transporter 1; DAPI, 4′,6-diamidino-2-phenylindole.
Changes in cellular glucose utilization were then assessed. There was a 2-fold increase in lactate release relative to controls, with lactate concentrations increasing by 1.7 mmol/L in hypoxic cells and 0.5 mmol/L in normoxic cells after 6 hours. Lactate levels were elevated relative to controls at each subsequent time point (Figure 4B). Glucose levels in the cell culture media were unchanged relative to controls after 6 and 12 hours of hypoxia but decreased from 23 mmol/L to 19 mmol/L after 24 hours of hypoxia (Figure 4C).
Mitochondrial Oxidative Metabolism
Cells incubated with mitotracker dye exhibited altered mitochondrial distribution after hypoxia, with the mitochondrial network appearing more fragmented, compared with normoxic cells (Figure 5A). This fragmentation pattern was more evident after staining with anticomplex IV antibody (Figure 5B). Quantification of mitotracker-stained images showed more fragmentation in cells cultured under hypoxia (Figure 5C), albeit this was not significant (P < .09). Mitochondrial oxidative capacity was then assessed by measuring respiration in intact cells after 6, 12, and 24 hours of hypoxia. Respiration rates were measured with pyruvate and malate and also with carbonyl cyanide p-trifluoromethoxyphenylhydrazone (FCCP); a metabolic uncoupler which enables maximal rates of oxygen consumption to be measured in the absence of mitochondrial respiratory control. After 24 hours of hypoxia, oxygen consumption was decreased by 30% relative to control cells under both basal and FCCP-stimulated conditions (Figure 6). Importantly, rates of respiration with oligomycin, an ATP synthase inhibitor, did not differ between control and hypoxic cells, indicating that the decreased respiration rates observed after 24 hours of hypoxia were not due to impaired mitochondrial membrane integrity. Therefore, 24 hours of hypoxia chronically downregulated mitochondrial respiration in cardiac cells.
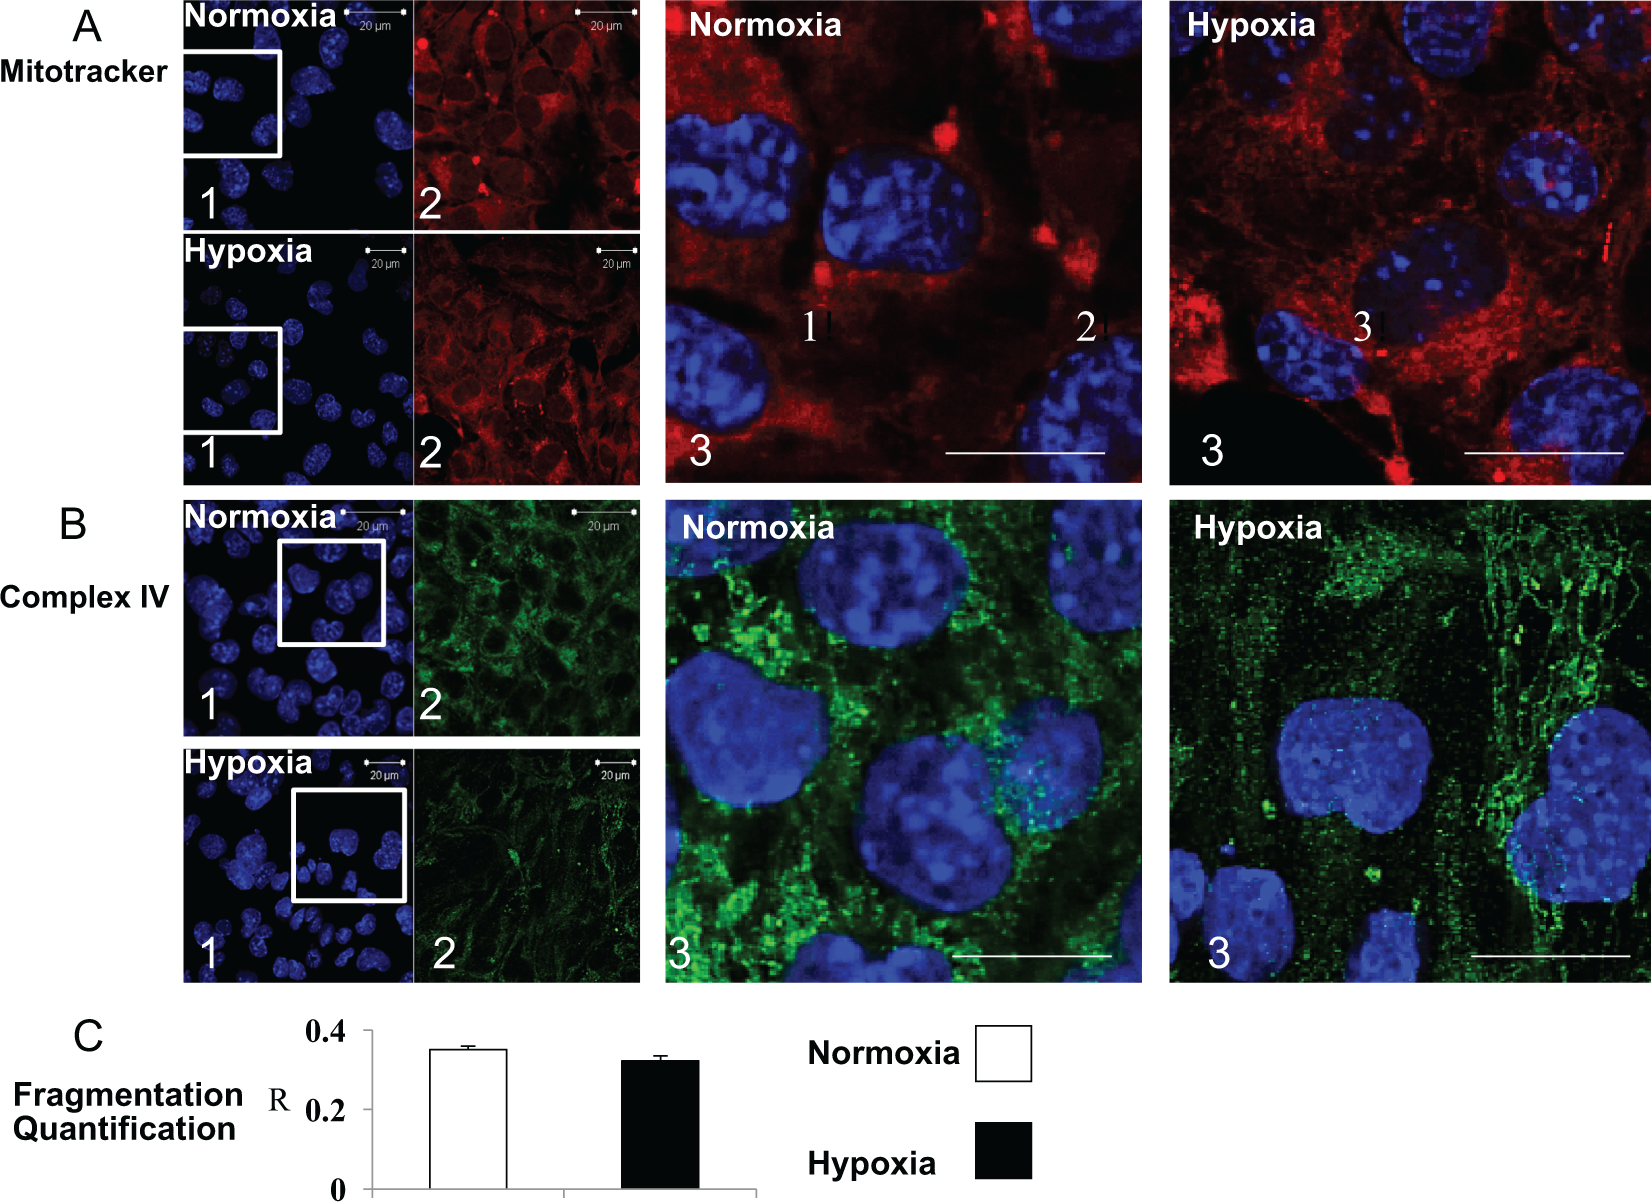
Mitochondrial responses to hypoxia. Mitochondrial morphology after normoxia or 24 hours of hypoxia. Images show nuclei stained with DAPI (1), mitochondria stained with mitotracker (A) or complex IV (B) primary antibody (2), and the merged image (3). Scale bars on large images are 10 µm. C, Quantification of mitochondrial fragmentation (mitotracker-stained cells), where R (between 0 and 1) is a parameter that reflects mitochondrial distribution; calculated from the ratio between average and maximal fluorescence of a defined region of interest, an entire cardiomyocyte in this case (F/Fmax). A lower value of R reflects a less homogeneous mitochondrial distribution. DAPI indicates 4′,6-diamidino-2-phenylindole.

Decreased mitochondrial respiration and enzyme activities following hypoxia. Cellular oxygen consumption rates with pyruvate and malate, oligomycin, and FCCP after 6 to 24 hours of hypoxia, *P < .05 versus control cells, n = 4 to 7 per group. Enzyme activities of ETC complexes I, II, and IV, aconitase, and citrate synthase in control and hypoxic cells (6 to 24 hours). *P < .01 versus control and 6 to 12-hour hypoxic cells, n = 3 to 6 per group. FCCP indicates carbonyl cyanide p-trifluoromethoxy phenylhydrazone.
Mitochondrial Enzyme Activities
To identify the mitochondrial enzymes responsible for the decreased oxygen consumption after 24 hours of hypoxia, the enzymatic activities of ETC complexes I, II, and IV and of aconitase were measured, as these enzymes have been shown to be downregulated following chronic in vivo hypoxia. 5 In line with the respiration data, there were no differences in any enzyme activities after 6 and 12 hours of hypoxia. However, after 24 hours of hypoxia, the activities of ETC complexes I and IV were decreased by 81% and 96%, respectively (Figure 6). In contrast, complex II activity did not differ to that of control cells after 24 hours of hypoxia. The activity of aconitase, an enzyme in the first span of the TCA cycle, was decreased by 72% in cells after 24 hours of hypoxia which would also contribute to the decreased respiration. The activity of citrate synthase, a marker of mitochondrial content, did not differ significantly to that of controls at any hypoxic time point, indicating that the decreased enzymatic activities observed were not due to decreased mitochondrial numbers following hypoxia but due to selective downregulation of these mitochondrial enzymes.
Mechanisms of Altered Mitochondrial Enzyme Activity
Changes in mitochondrial enzyme activities in hypoxia may be mediated by HIF transcription factors or by HIF-independent mechanisms. To identify whether the altered enzyme activities in cells after hypoxia were HIF dependent, cells were treated with the pharmacological HIF activator, dimethyloxalylglycine (DMOG), for 24 hours. DMOG is a cell-permeable competitive inhibitor of the prolyl hydroxylase cofactor, 2-oxoglutarate, thereby activating HIF in the absence of hypoxia. DMOG treatment upregulated HIF-1α protein levels similar to hypoxia, with induction of the HIF-1α target genes and proteins, GLUT1, PDK1, and VEGF after 24 hours (Figure 7A). In addition, DMOG-stimulated HIF activation downregulated cellular oxygen consumption with pyruvate by 44% and 43% under basal and FCCP-stimulated conditions, respectively (Figure 7B). Thus, pharmacological HIF activation, in the absence of hypoxia, is sufficient to decrease mitochondrial oxygen consumption in HL-1 cells.

Characterization of cell responses to DMOG treatment. HIF-1α protein activation and upregulation of target genes and proteins (GLUT1 and PDK1 protein and VEGF mRNA) following exposure to DMOG (A). Oxygen consumption rates of DMOG-treated cells with pyruvate and malate, oligomycin, and FCCP (B). *P < .01 versus control cells, n = 4 to 5 per group. DMOG indicates dimethyloxalylglycine; HIF, hypoxia inducible factor; GLUT1, glucose transporter 1; PDK1, pyruvate dehydrogenase kinase 1; VEGF, vascular endothelial growth factor; mRNA, messenger RNA; FCCP, carbonyl cyanide p-trifluoromethoxy phenylhydrazone.
After 24 hours of DMOG treatment, the activities of ETC complex I and of aconitase were decreased by 30% and 26%, respectively (Figure 8). This indicates that these enzymes are modified by HIF-dependent pathways during hypoxia. In contrast, the activity of complex IV was not significantly different between control and DMOG-treated cells, indicating that the hypoxia-induced downregulation of complex IV could be attributed to HIF-independent mechanisms. The unchanged citrate synthase and complex II activities after DMOG treatment demonstrate that mitochondrial numbers were not altered by HIF activation, similar to hypoxia. Therefore, cardiac mitochondrial enzyme activities were modified by both HIF-dependent and HIF-independent mechanisms in the hypoxic heart.

Mitochondrial enzyme activities following DMOG treatment. Enzyme activities of ETC complexes I, II, and IV, citrate synthase, and aconitase in control and DMOG-treated cells (24 hours). *P < .01 versus control cells, n = 4 to 5 per group. DMOG indicates dimethyloxalylglycine; ETC, electron transport chain.
Discussion
Hypoxia occurs during heart disease and failure, and mitochondria have been identified as important targets of hypoxic adaptation. 24 Cultured neonatal cardiomyocytes are a useful system in which mechanisms involved in hypoxia are studied but are limited by their short survival time in culture and lack of adult characteristics. Consequently, we identified hypoxia-induced metabolic alterations in HL-1 cells, with increased anaerobic glycolysis and decreased mitochondrial oxygen consumption after 24 hours of hypoxia. Importantly, hypoxia decreased the enzyme activities of ETC complexes I and IV and of aconitase in cells, which occurred via both HIF-dependent and HIF-independent mechanisms as determined using the pharmacological HIF activator, DMOG.
Cell Culture Model of Cardiac Hypoxia
HL-1 cells are particularly relevant to the study of cardiac substrate utilization as they metabolize fatty acids as does the adult heart. These cells are differentiated beating cardiomyocytes, which gives our study a distinct advantage over other studies which have utilized other noncardiac or nonbeating cell lines, as our findings are directly relevant to the contracting heart and its characteristic gene expression patterns. The strong linear relationship between contractile function and oxidative metabolic rates in animal studies 19,25 reinforces why using a contracting cell line has added advantages when investigating metabolism. The existence of HIF-1α upregulation and target gene induction in these cells in response to hypoxia validated the use of this cell line to investigate hypoxia-induced metabolic changes. By limiting observations to 24 hours of hypoxia when cells were still viable, we were able to observe metabolic adaptations to hypoxia in the absence of cell death.
Cells showed increased lactate production after 6 hours of hypoxic cell culture, demonstrating that hypoxia increased anaerobic glycolytic rates from an early time point. Additionally, GLUT1 protein levels were increased in cells and located at the plasma membrane following 24 hours of hypoxia, which may facilitate cellular glucose uptake for metabolism. This agrees with in vivo studies of hypoxia, in which cardiac glycolytic enzymes were upregulated 26 and provided further confirmation that our HL-1 cells were suitable for assessing metabolic responses to hypoxia.
Mitochondrial Oxidative Metabolism is Downregulated by Hypoxia
In HL-1 cells exposed to hypoxia for 24 hours, there was a clear decrease in oxygen consumption in the absence of a decrease in citrate synthase. Thus, there was a selective decrease in the activity of specific hypoxia-regulated mitochondrial enzymes, rather than loss of mitochondria or a global suppression of mitochondrial metabolic enzymes. The decrease in respiration was not present at earlier time points, indicating that 24 hours of hypoxia was the optimal time to observe modified oxidative metabolism in HL-1 cells. The fact that these cells were able to alter their oxidative capacity upon hypoxic exposure showed that these cells are more metabolically similar to the adult heart in vivo than has been claimed in other studies. 17
The mitochondrial network in HL-1 cells was rearranged after 24 hours of hypoxia, in agreement with in vivo hypoxia studies showing increased mitochondrial numerical density but decreased mitochondrial size. 27 Some studies have associated mitochondrial fragmentation with mitochondrial dysfunction and mitophagy, 28 but the maintained citrate synthase activity in our cells would seem to contradict this, suggesting that overall mitochondrial content was preserved via remodeling after 24 hours of hypoxia.
To investigate the decreased oxygen consumption by HL-1 cells following 24 hours of hypoxia, we found that the enzyme activities of the ETC enzymes, complex I and complex IV, and of the TCA cycle enzyme, aconitase, were decreased after 24 hours of hypoxia, fitting with the decreased cellular oxygen consumption at this time point. These results are consistent with results from in vivo studies, in which these complexes were downregulated in both enzymatic activity assays and in oxygen consumption studies using isolated mitochondria from chronically hypoxic rat hearts. 5 Interestingly, the activity of complex II in HL-1 cells was not decreased after 24 hours of hypoxia, whereas it was decreased in mitochondria from chronically hypoxic rat hearts. This may be because the hypoxia-induced downregulation of complex II takes place on a longer time scale than is possible to see in 24 hours of hypoxic cell culture. This, therefore, indicates that a different mechanism regulates the activity of complex II compared with the other hypoxia-regulated enzymes.
Hypoxia Inducible Factor-Dependent Regulation of Mitochondrial Respiration
The HIF pathway is the most characterized mechanism for regulating gene expression during hypoxia and instigates a number of metabolic changes in cells including upregulation of GLUT1 and LDH to increase glycolysis during hypoxia, 3 a more oxygen-efficient means of ATP production. A number of mitochondrial targets of HIF-1α have been identified in other cell lines, with PDK1 downregulating PDH activity and pyruvate decarboxylation. 10,29 Therefore, it is feasible that this transcription factor also directly targets ETC enzymes.
Cells treated with DMOG for 24 hours had decreased oxygen consumption rates similar to those after 24 hours of hypoxia, indicating that HIF activation is a sufficient mechanism to downregulate oxygen consumption in hypoxia. However, when the enzyme activities of ETC complexes I, II, and IV and of aconitase were assayed, only those of complex I and aconitase were decreased, indicating that these enzymes are downregulated by HIF-dependent mechanisms. The HIF dependence of aconitase and complex I downregulation during hypoxia is consistent with the findings of Chan et al, 30 which suggested that the iron–sulfur clusters in these enzymes are affected by HIF-1α-mediated downregulation of iron-sulfur cluster assembly protein (ISCU) during hypoxia. These effects were also observed in cancer cell lines, with ISCU suppression decreasing complex I and aconitase activities. 31 In contrast, the activity of complex IV in the present study decreased with hypoxia, but not with DMOG treatment, demonstrating HIF-independent regulation of the terminal complex of the ETC. Work by Fukuda et al 11 provided evidence for a HIF-dependent subunit switch in complex IV from the COX4-1 to the COX4-2 isoform in human liver and lung cells, to increase respiration efficiency during hypoxia. Our results show no evidence for HIF-dependent alteration in complex IV enzyme activity in the heart, which reveals the value of using a cardiac cell line to investigate cardiac-specific metabolic responses to hypoxia. A microarray analysis of MCF7 cells by Elvidge et al 8 supports the existence of HIF-independent mechanisms in the hypoxic response, as a number of genes were upregulated by hypoxic exposure but not by DMOG treatment. Hypoxia activates a number of transcription factors in addition to HIF-1α, including nuclear factor κB, AP-1, p53, peroxisome proliferator-activated receptor coactivator 1α, and c-Myc (reviewed in Kenneth and Rocha), 32 which may regulate the activity of complex IV. There is already some evidence for HIF-independent regulation of metabolism, for example, AP-1 was shown to increase uncoupling protein 3 expression in skeletal myocytes in a HIF-1α-independent manner. 33 There is also evidence that the VEGF gene promoter contains sp-1 binding sites, which can upregulate its expression independently of HIF-1α. 34,35 Future studies are therefore required to determine which mechanisms modify complex IV activity during hypoxia as well as the transcription factors that mediate them. One limitation of this study is that DMOG is a nonspecific inhibitor of hypoxia inducible factors. Therefore, we cannot rule out the possibility that the drug treatment affected targets other than HIF-1α in our DMOG-treated cells. Our experiments could be validated with a more specific HIF- inhibiting compound or with HIF-1α-targeted small interfering RNA molecules in future work. Nonetheless, our results show evidence for HIF-independent mechanisms of metabolic adaptation to hypoxia in the heart, since mitochondria ETC complexes were differentially regulated by hypoxia and by DMOG treatment.
In conclusion, we have established and validated a cardiac cell culture model of hypoxia using the HL-1 cardiomyocyte cell line. After 24 hours, cells had increased glycolysis and decreased mitochondrial oxygen consumption. Thus, we have extended the work done in previous studies by characterizing changes in both glycolysis and mitochondrial metabolism during hypoxia.
The enzyme activities of ETC complexes I and IV and of aconitase were downregulated as a consequence of hypoxia, directed by HIF-dependent mechanisms in the cases of complex I and aconitase, and by a HIF-independent mechanism in the case of complex IV. Thus, this work has demonstrated that hypoxia-mediated changes in cardiac mitochondrial function are a conserved target of both HIF-dependent and independent signaling pathways. This finding demonstrates the potential of the HL-1 cardiomyocyte cell line for investigation of the mechanisms involved in cardiac metabolic adaptation to hypoxia and suggests its utility for studying these mechanisms in more detail in the future.
Footnotes
Acknowledgments
We thank Jun Jie Tan, Suat-Cheng Tan, and Stefania Monterisi for their technical advice, and Prof Chris Schofield and Kar Kheng Yeoh for providing us with DMOG.
Declaration of Conflicting Interests
The author(s) declared no potential conflicts of interest with respect to the research, authorship, and/or publication of this article.
Funding
The author(s) disclosed receipt of the following financial support for the research, authorship and/or publication of this article: This work was supported by funding from the British Heart Foundation (grant numbers RG/07/004/22659 and FS/10/53/28679) and Diabetes UK (grant number 11/0004175).