
Abstract
Aim:
To compare the effect of manidipine 20 mg plus rosuvastatin 10 mg versus olmesartan 20 mg plus rosuvastatin 10 mg on markers of insulin resistance in patients with mixed dyslipidemia, hypertension, and impaired fasting glucose (IFG).
Methods:
This study had a prospective, randomized, open-label, blinded endpoint (PROBE) design. A total of 40 patients with IFG, mixed dyslipidemia, and stage 1 hypertension were included. Following dietary intervention, patients were randomly allocated to rosuvastatin (10 mg/d) plus olmesartan (20 mg/d) or manidipine (20 mg/d). The primary end point was the between-group difference in changes in the Homeostasis Model Assessment Insulin Resistance (HOMA-IR) index following 3 months of treatment. Secondary end points included changes in fasting plasma glucose (FPG), fasting insulin levels, and glucosylated hemoglobin.
Results:
At the end of the 3-month treatment period, a significant increase in HOMA-IR index by 14% (from 2.4 [0.5-7.9] to 2.7 [0.5-5.2], P = .02 versus baseline) was seen in the olmesartan plus rosuvastatin group. On the contrary, no significant change in HOMA-IR index was observed in the manidipine plus rosuvastatin group (1.7 [0.5-5.2] to 1.7 [0.8-6.0], P = NS versus baseline, P = .04 versus olmesartan plus rosuvastatin group). An increase in fasting insulin levels was observed in the olmesartan plus rosuvastatin group (+8%, from 10.1 [2.0-29.6] to 10.9 [2.0-19.1] μU/mL, P < .05 versus baseline), while no significant change was seen in the manidipine plus rosuvastatin group (+3%, from 7.3 [2.0-17.6] to 7.5 [1.9-15.6] μU/mL, P = NS versus baseline, P = .02 versus olmesartan plus rosuvastatin group). Fasting plasma glucose and glycosylated hemoglobin did not change significantly in any group.
Conclusion:
Manidipine seems to ameliorate the possible statin-associated increase in insulin resistance as compared with olmesartan in patients with IFG, hypertension, and mixed dyslipidemia.
Introduction
Managing patients with the metabolic syndrome necessitates a set of global treatment measures. 1 Hypertension as well as atherogenic dyslipidemia should be managed aggressively, combined with lifestyle changes and smoking cessation. In this regard, the majority of patients with the metabolic syndrome are likely to require combination therapy with statins and antihypertensive agents at the same time. Implementing therapeutic strategies that may prevent the development of diabetes or even revert the prediabetic stage is mandatory, especially in this patient group. 2
Concerns have been recently raised regarding the effects of statins on carbohydrate metabolism. In the Justification for the use of statins in Prevention: an Intervention Trial Evaluating Rosuvastatin (JUPITER) trial, an increase in the incidence of new-onset diabetes (NOD) associated with rosuvastatin treatment was observed. 3 Indeed, we have previously shown that rosuvastatin dose-dependently increased insulin resistance. 4
We have previously demonstrated that the combination of rosuvastatin 10 mg with olmesartan 20 mg for 3 months was associated with a significant increase in HOmeostasis Model Assessment Insulin Resistance (HOMA-IR) index. 5
Manidipine is a long-acting dihydropyridine-derivative calcium-channel antagonist, which has been associated with beneficial effects on insulin sensitivity. 6 ,7
The present study was undertaken to compare the effect of rosuvastatin 10 mg with olmesartan 20 mg versus rosuvastatin 10 mg with manidipine 20 mg on markers of insulin resistance in patients with mixed dyslipidemia, stage 1 hypertension, and impaired fasting glucose (IFG).
Materials and Methods
Participants
Patients attending the Outpatient Lipid Clinic of the University Hospital of Ioannina, Greece, were recruited. Eligible patients were those with IFG (fasting plasma glucose [FPG] 100-125 mg/dL [5.6-6.9 mmol/L]), mixed dyslipidemia (low-density lipoprotein cholesterol [LDL-C] >160 mg/dL [4.14 mmol/L] plus triglycerides [TGs] >150 mg/dL [1.69 mmol/L]), and stage 1 hypertension (systolic blood pressure [SBP] 140-159 mm Hg and/or diastolic BP [DBP] 90-99 mm Hg). Patients were excluded if they had any of the following: (1) history of diabetes (FPG >126 mg/dL (7 mmol/L) or use of antidiabetic drugs), (2) history of cardiovascular disease (CVD), (3) TGs >400 mg/dL (4.52 mmol/L), (4) renal disease (serum creatinine >1.5 mg/dL [114 μmol/L]), (5) hypothyroidism (thyroid-stimulating hormone [TSH] >5 IU/mL), (6) liver dysfunction (alanine aminotransferase [ALT] and/or aspartate aminotransferase [AST] activity greater than 3-fold the upper limit of normal [ULN] in more than 2 consecutive measurements), (7) receiving lipid-lowering or antihypertensive treatment during the last 3 months prior to recruitment, and (8) females that did not take sufficient contraceptive measures. Prior to any clinical or laboratory evaluation as well as before any dietary or drug therapeutic intervention, all participants gave written informed consent and the study protocol was approved by our institutional ethics committee.
Study Design
This was a prospective, randomized, open-label, blinded end point (PROBE) study. All patients received a 12-week dietary intervention in accordance with the National Cholesterol Education Program Adult Treatment Panel III (NCEP ATP III) guidelines and the Dietary Approaches to Stop Hypertension (DASH) diet.8–10 All participants completed 4-day diet records at baseline and at the end of the treatment period. A dietitian prescribed a low fat and sodium diet for each patient. There were no differences in lifestyle recommendations provided between the study groups.
Patients who continued to meet the inclusion criteria after the dietary intervention were randomly allocated to open label: (1) rosuvastatin 10 mg/d plus olmesartan 20 mg/d (n = 20) or (2) rosuvastatin 10 mg/d plus manidipine 20 mg/d (n = 20). Randomization was performed by means of a computer-generated sequence of random numbers. Compliance with study medication was assessed at week 12; patients were considered compliant if they took 80% to 100% of the prescribed number of tablets. All patients were instructed to follow the prescribed diet during the study.
The primary end point was the between-group difference in changes in HOMA-IR index after 3 months of treatment. Secondary end points included the between-group difference in changes in fasting insulin levels, FPG, glycosylated hemoglobin (HbA1c), and serum lipids.
Clinical Evaluation
Blood pressure measurements were performed in the right arm, by triplicate, following 10 minutes rest, at each visit. Measurements were carried out by trained nurses, who were blinded to treatment allocation, in the sitting position using an electronic sphygmomanometer (Microlife WatchBP Office, Microlife AG, Switzerland).
Biochemical Parameters
All laboratory determinations were carried out blindly after an overnight fast. Levels of FPG, total cholesterol (TC), high-density lipoprotein cholesterol (HDL-C), and TGs as well as serum activities of AST, ALT, gamma-glutamyl transpeptidase (γGT), alkaline phosphatase (ALP), and creatinine kinase (CK) were determined enzymatically in the laboratory of the University Hospital of Ioannina using an Olympus AU 600 analyser (Olympus Diagnostica GmbH, Hamburg, Germany). Low-density lipoprotein cholesterol was calculated using the Friedewald formula (LDL-C = TC − TGs/5 − HDL; provided that TGs were <400 mg/dL; 4.52 mmol/L).
Fasting insulin levels were measured by an AxSYM insulin assay microparticle enzyme immunoassay on an AzSYM analyzer (Abbott Diagnostics, Illinois). HOMA-IR index was calculated as follows: HOMA-IR = fasting insulin (mU/L) × fasting glucose (mg/dL)/405. 11 The determination of HbA1c was based on a latex agglutination inhibition assay (Randox Laboratories Ltd, Antrim, UK). The HbA1c values are expressed as percentage of the total hemoglobin concentration. The sensitivity of the method is 0.25 g/dL of HbA1c and the within run and between run precision <6.67% and <4.82%, respectively.
Statistical Analysis
We used G*Power 3.0.10 to calculate sample size. Based on previous studies we estimated that rosuvastatin treatment would increase HOMA-IR index by 25%, while the effect of olmesartan on HOMA-IR index was thought to be neutral. Power analysis revealed that a sample size of 20 patients per group would give a 90% power to detect differences between groups at an α level lower than .05. The Kolmogorov-Smirnov test was used to evaluate whether each parameter followed a Gaussian distribution and logarithmic transformations were accordingly performed.
Values are given as mean standard deviation (SD) and median (range) for parametric and nonparametric data, respectively. The differences of study parameters at baseline and posttreatment values were evaluated by paired samples t test (or Wilcoxon rank test for non-Gaussian variables). Analysis of covariance (ANCOVA), adjusted for baseline values, was used for the comparisons between treatment groups.
Significance was set up at P < .05. Analyses were performed using the Statistical Package for the Social Sciences (SPSS) 16.0 (SPSS Inc, Chicago, Illinois).
Results
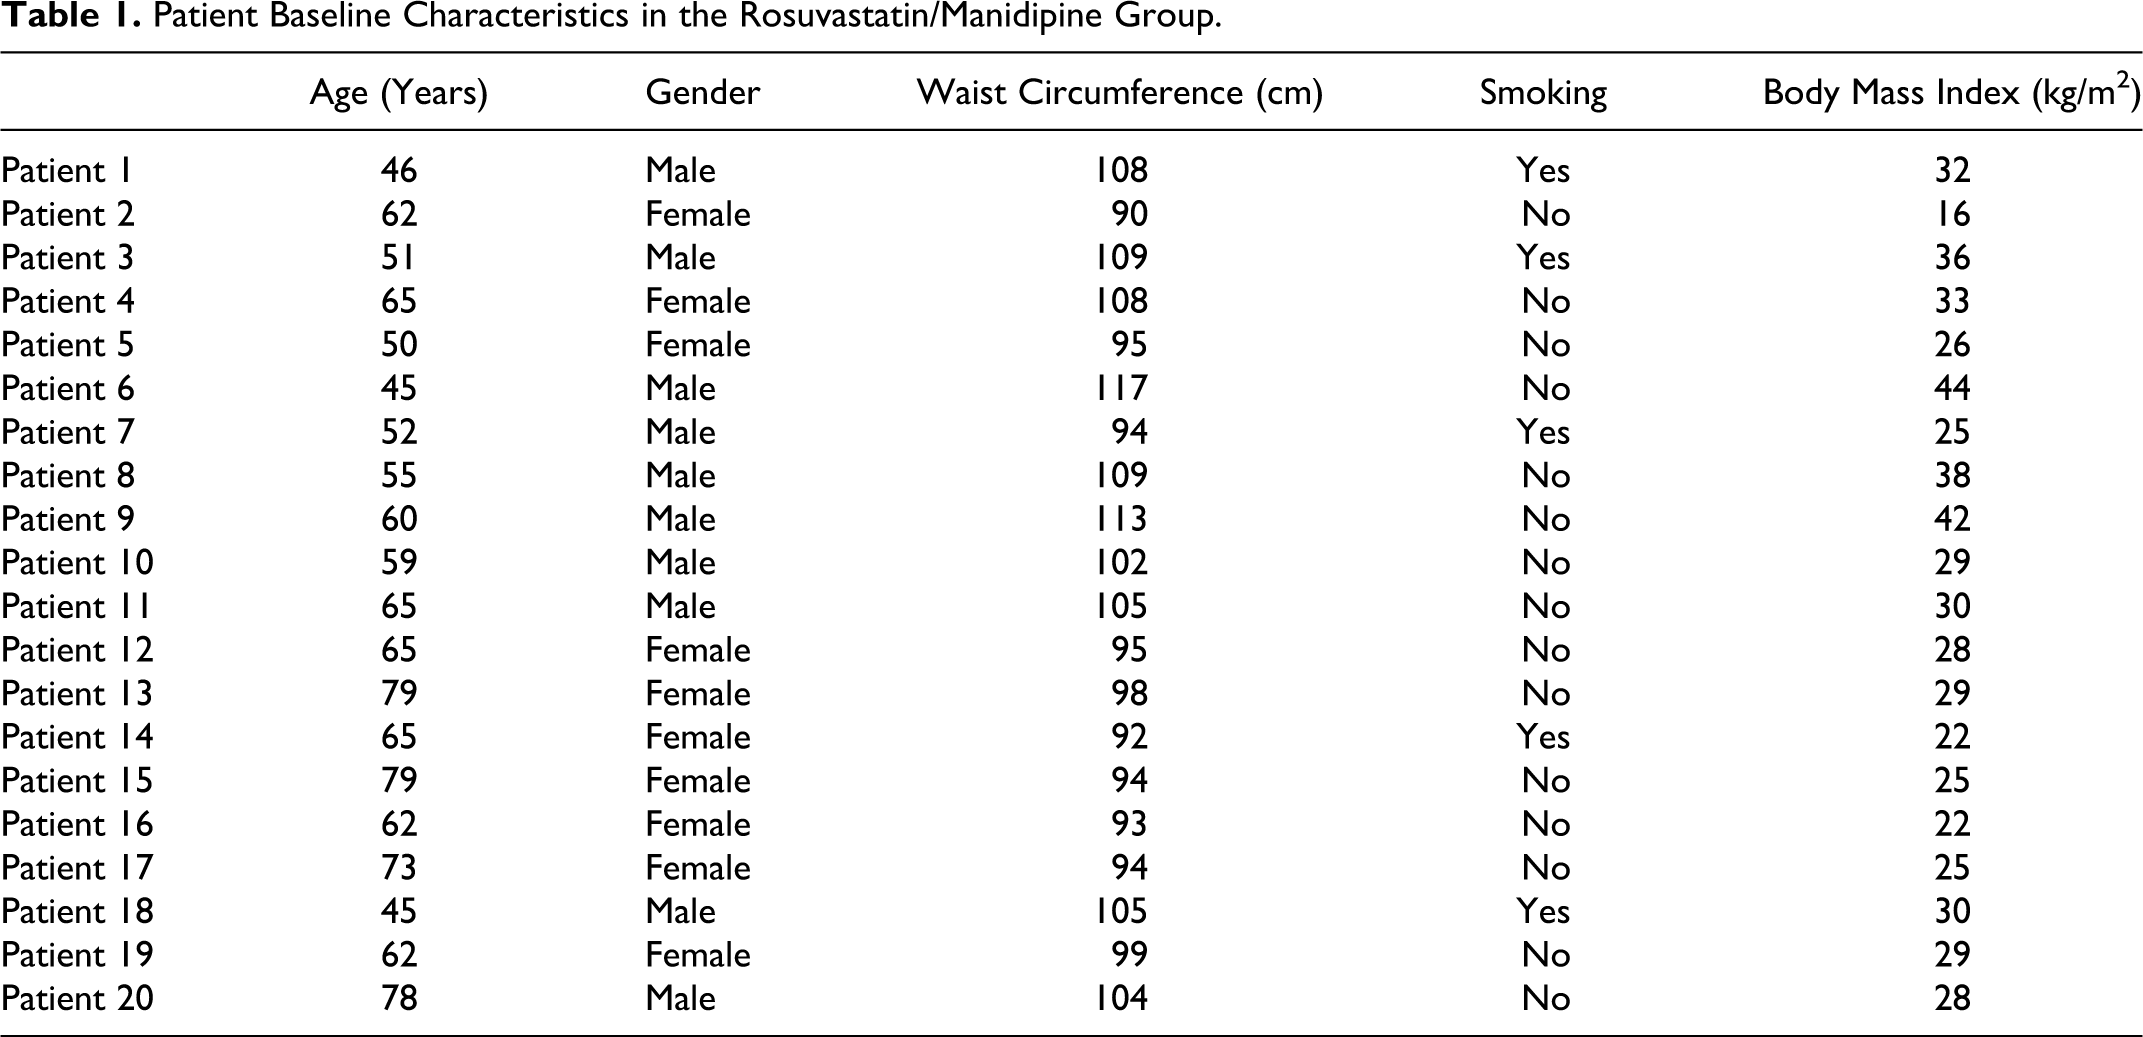
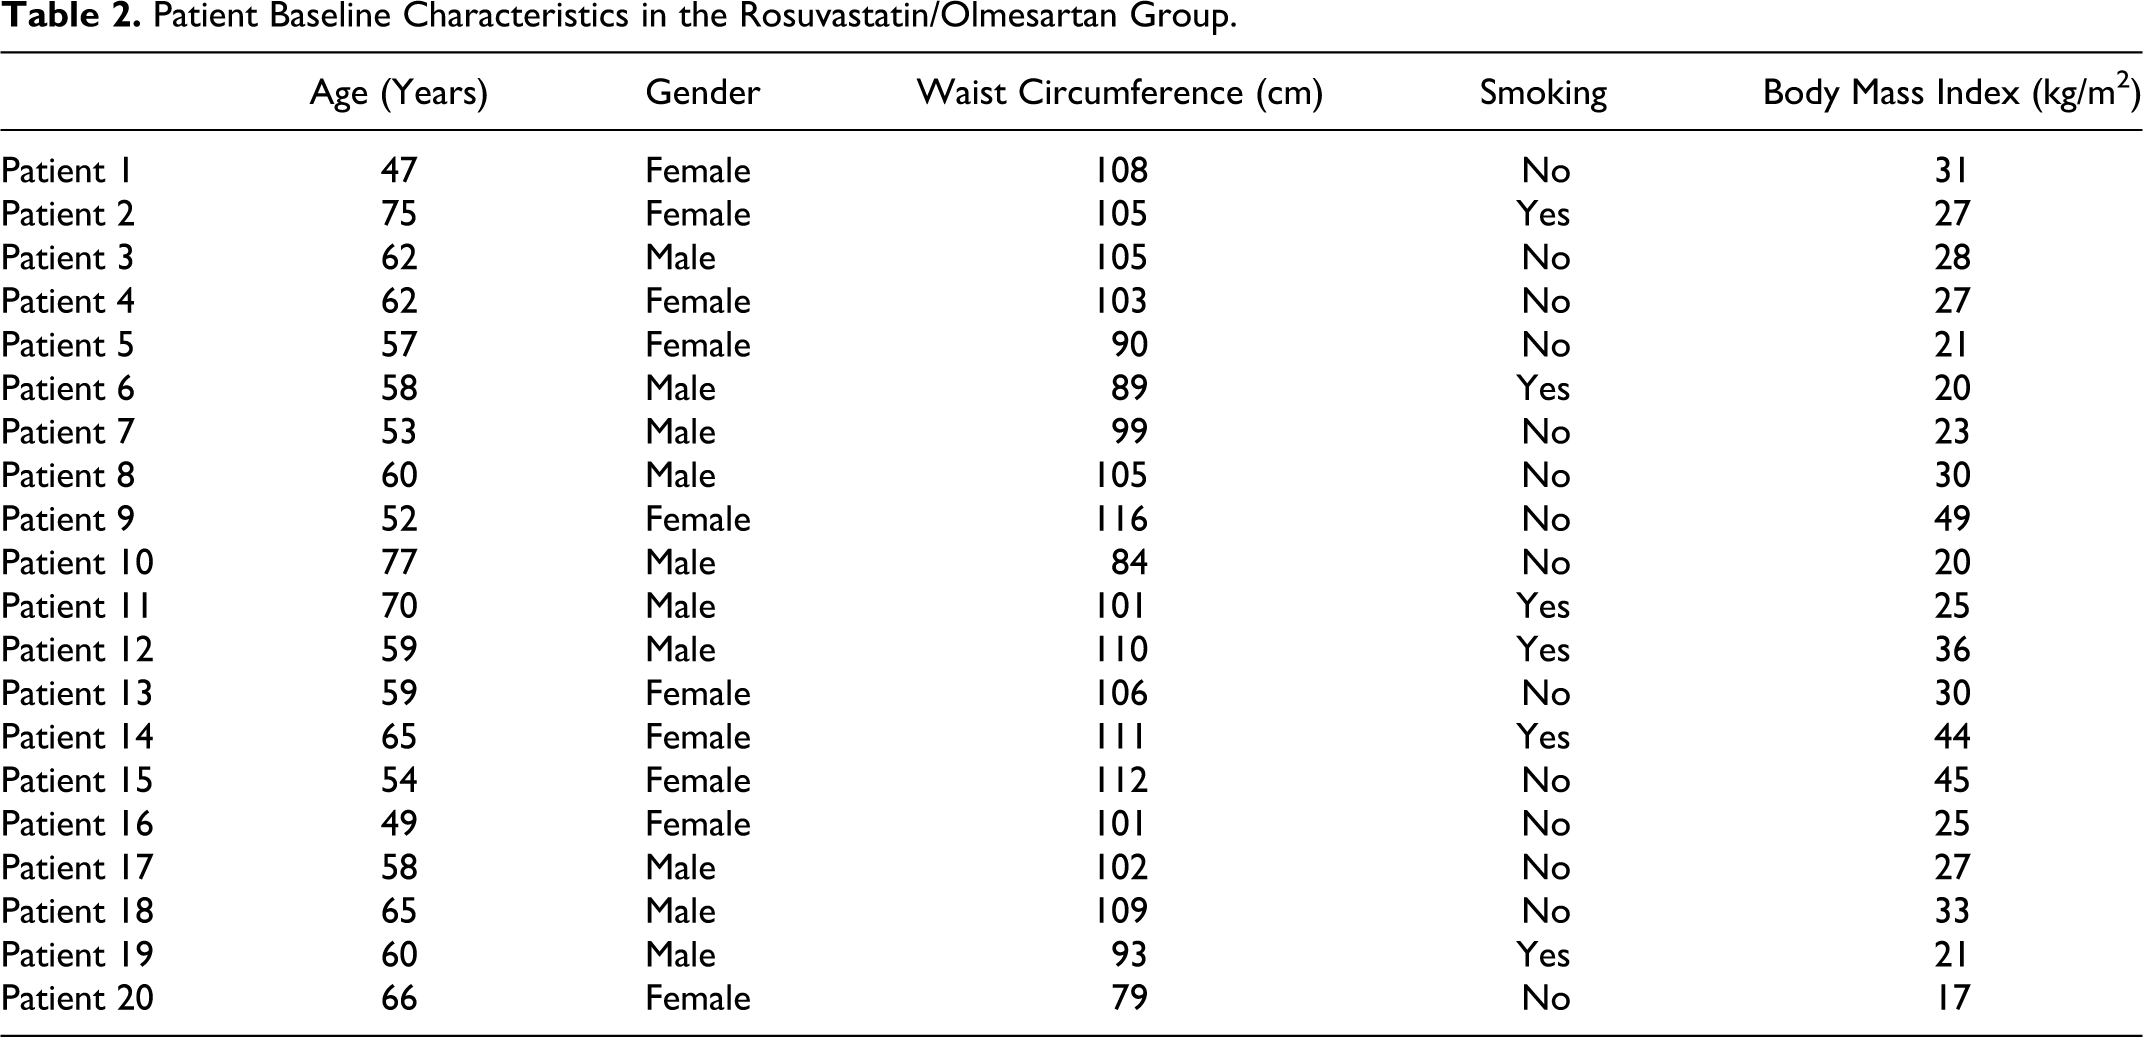
Forty patients were enrolled. After 3 months of dietary interventions, all patients continued to meet the inclusion criteria. Patients’ demographics and baseline clinical characteristics are presented in Tables 1 and 2. No significant differences regarding baseline data were found between groups (Tables 1 and 2).
Patient Baseline Characteristics in the Rosuvastatin/Manidipine Group.
Patient Baseline Characteristics in the Rosuvastatin/Olmesartan Group.
At the end of the 3-month treatment period, a significant increase in HOMA-IR index by 14% (from 2.4 [0.5-7.9] to 2.7 [0.5-5.2], P = .02 versus baseline) was seen in the olmesartan plus rosuvastatin group. On the contrary, no significant change in HOMA-IR index was observed in the manidipine plus rosuvastatin group (1.7 [0.5-5.2] to 1.7 [0.8-6.0], P = NS versus baseline, P = .04 versus olmesartan plus rosuvastatin group; Table 3). An increase in fasting insulin levels was observed in the olmesartan plus rosuvastatin group (+8%, from 10.1 [2.0-29.6] to 10.9 [2.0-19.1] μU/mL, P < .05 versus baseline), while no significant change was seen in the manidipine plus rosuvastatin group (+3%, from 7.3 [2.0-17.6] to 7.5 [1.9-15.6] μU/mL, P = NS versus baseline, P = .02 versus olmesartan–rosuvastatin group; Table 3). Both FPG and HbA1c did not significantly change in any group (Table 3).
Glucose Metabolism Indices, Systolic and Diastolic Blood Pressure, and Lipid Values at Baseline and After 12 Weeks of Treatment. a

Abbreviations: HDL-C, high-density lipoprotein cholesterol; LDL-C, low-density lipoprotein cholesterol; RM, rosuvastatin–manidipine; RO, rosuvastatin–olmesartan; HOMA-IR, HOmeostasis Model Assessment Insulin Resistance.
aValues are expressed as mean SD (except for fasting serum insulin, HOMA-IR, and triglycerides that are expressed as median (range)).
b P = .02 versus RO group.
c P < .05 versus baseline.
d P = .04 versus RO group.
e P < .01 versus baseline.
The anthropometric indices, including body weight, waist circumference, and body mass index (BMI) were not altered in any group. During drug treatment, significant reductions in SBP and DBP compared with baseline (P < .01 for both groups) were observed in both groups, with no significant differences between groups (Table 3). Significant reductions in TC, TGs, and LDL-C were observed in all groups, while HDL-C remained unchanged compared with baseline. No intergroup differences in lipid changes were noticed (Table 3).
None of the participants dropped out. Compliance rate was >80% in all participants. All regimens were well tolerated during the study. No patient in any group had liver enzyme elevation >3-fold ULN or CK >10-fold ULN. No patient complained about muscle aches or pain. Ankle edema was observed in 2 patients in the manidipine plus rosuvastatin group. No patient complained about cough, headache, palpitations, or dizziness. There was no difference in compliance between groups. Neither cardiovascular nor other serious adverse events were reported during the study.
Discussion
We compared the effects of rosuvastatin combined with olmesartan versus manidipine on markers of insulin resistance in patients with hypertension, dyslipidemia, and IFG. Both combinations were equally effective in treating dyslipidemia and hypertension. However, a significant increase in HOMA-IR index was noticed in the rosuvastatin plus olmesartan group, whereas the combination of rosuvastatin with manidipine was not associated with changes in HOMA-IR index.
Hypertensive individuals with IFG are at high risk for the development of diabetes. 2 ,12 Thus, special attention should be paid to this patient group to prevent new diabetes. Concerns that statins may be associated with mild adverse effects on glucose metabolism have been raised. Large-scale clinical trials and meta-analyses have demonstrated that statin therapy may be associated with a small increase in new diabetes onset. 3 ,13 –15 In addition, small prospective studies from our group have shown that rosuvastatin may be associated with dose-related adverse effects on insulin resistance. 4 ,16
Manidipine compared with other calcium channel blockers shares unique characteristics. 17 A number of studies suggest that manidipine may reduce insulin resistance and have renal protective properties.18–23 Experimental studies have shown that manidipine, but not amlodipine or lercanidipine, activates peroxisome proliferator–activated receptor gamma (PPAR-γ) in 3T3-L1 rat adipocytes. 24 In the Manidipine in hypertensive patients with metabolic syndrome (MARIMBA) study, manidipine was compared with amlodipine in nondiabetic patients with the metabolic syndrome. 23 Manidipine but not amlodipine significantly reduced albuminuria, HOMA-IR index, and plasma tumor necrosis factor-α (TNF-α), while it increased plasma adiponectin levels. Manidipine may also have a better safety profile compared with amlodipine by reducing the incidence of ankle edema. 25
In our study, the combination of manidipine with rosuvastatin did not significantly affect HOMA-IR index in hypertensive prediabetic patients with mixed hyperlipidemia. Therefore, we suggest that manidipine ameliorated the possible rosuvastatin-associated increase in insulin resistance.
Olmesartan does not affect PPAR-γ receptors and probably has neutral effects on insulin resistance. We have previously demonstrated that the combination of rosuvastatin 10 mg with olmesartan 20 mg was associated with significant increases in HOMA-IR index. 5 Similarly, in the present study an increase in HOMA-IR index was seen when olmesartan was combined with rosuvastatin.
Study Limitations
A control group receiving rosuvastatin as monotherapy was not included since it was considered unethical to further delay antihypertensive treatment in these high-risk patients. Additional limitations include the open-label design and the relatively short period of follow-up (12 weeks). Another limitation of the present study was the small number of participants. However, power analysis was used to determine number of participants in each group. Nevertheless, we may not have been able to control for confounding with regression models due to the small n. No oral glucose tolerance test (OGTT) was performed in patients with IFG to identify diabetic patients.
The method of assessing insulin resistance, HOMA-IR index, is a widely used and sensitive method. However, hyperinsulinemic–euglycemic clamp and hyperglycemic clamp is considered the gold standard for measuring insulin sensitivity and insulin secretion, respectively. On the other hand, this was an adequately powered study, and clinical and laboratory parameters were blindly assessed with regard to treatment allocation. Moreover, all comparisons were adjusted for baseline levels.
Conclusions
Manidipine seems to ameliorate the possible rosuvastatin-associated increase in insulin resistance as compared with olmesartan in patients with IFG, hypertension, and mixed dyslipidemia. Whether this effect is associated with less new diabetes remains unknown.
Footnotes
Authors’ Note
The authors Evangelos N. Liberopoulos, Christos V. Rizos, and Moses S. Elisaf were involved in the design of the study; Evangelos N. Liberopoulos, Elisavet Moutzouri, and Fotis Barkas conducted the study; Elisavet Moutzouri, Fotis Barkas, and Evangelos N. Liberopoulos were involved in data collection; Elisavet Moutzouri, and Christos V. Rizos were involved in data analysis; Evangelos N. Liberopoulos, Elisavet Moutzouri, George Liamis, and Moses S. Elisaf were involved in data interpretation; and Evangelos N. Liberopoulos and Elisavet Moutzouri were involved manuscript writing.
Declaration of Conflicting Interests
The author(s) declared no potential conflicts of interest with respect to the research, authorship, and/or publication of this article.
Funding
The author(s) received no financial support for the research, authorship, and/or publication of this article.