
Abstract
Introduction
Large Cell Carcinoma (LCC) is a rare, aggressive subtype of non‐small cell lung cancer marked by rapid progression and limited treatment options. Prognostic assessment in this population has rarely been addressed, and conventional models based on American Joint Committee on Cancer staging often fail to capture the complex biological behavior of LCC. Machine learning approaches, however, have the potential to integrate diverse clinical data, thereby enhancing prognostic accuracy and supporting personalized treatment strategies.
Methods
We conducted a retrospective study utilizing the Surveillance, Epidemiology, and End Results (SEER) Program database to develop and validate multiple machine learning-based prognostic models for Overall Survival (OS) in a cohort of 1,867 LCC patients. A rigorous analytical framework was implemented, incorporating feature selection via Lasso-Cox regression and the Boruta algorithm. Model performance was assessed using time-dependent Area Under the Curve (AUC), calibration plots, decision curve analysis, and Brier scores. Advanced interpretability techniques including SHapley Additive exPlanations, partial dependence plots, and Restricted Cubic Splines (RCS) were applied to elucidate the prognostic impact of key features.
Results
Among the models evaluated, the Random Survival Forest (RSF) demonstrated superior discriminatory power and robust calibration compared to traditional Cox regression and other machine learning methods. Specifically, the RSF model achieved AUC values of 0.858 (95% CI: 0.838–0.878) for 3-year OS prediction and 0.863 (95% CI: 0.84–0.886) for 5-year OS prediction in the training set. Key prognostic factors identified included tumor size, metastatic status, and treatment interventions, with RCS analysis revealing significant non-linear relationships between tumor size and survival outcomes.
Conclusions
Our machine learning framework, especially the RSF algorithm, exhibits strong predictive performance for OS in LCC patients. The development of an accessible, web-based platform enhances clinical applicability by offering a novel, data-driven approach to personalized treatment planning and risk stratification.
Keywords
Introduction
Large Cell Carcinoma (LCC) is a distinct and aggressive subtype of Non-Small Cell Lung Cancer (NSCLC) characterized by undifferentiated, large polygonal cells that lack the definitive features of lung adenocarcinoma(LUAD) or squamous cell carcinoma(LUSC), making it a diagnosis often reached by exclusion. 1 Despite representing a relatively small proportion of lung cancers, LCC is associated with rapid progression, early metastasis, and a poor prognosis,2,3 with smoking being the primary risk factor. 4 Its histopathological ambiguity, combined with the absence of well-defined molecular markers, complicates both diagnosis and treatment, thereby limiting the effectiveness of targeted therapies. As a result, in the absence of a standard treatment protocol for LCC, therapeutic decisions are often guided by the established treatment strategies for NSCLC. 5
Given its rarity and aggressive nature, accurately identifying prognostic factors in LCC is essential for optimizing patient care. Traditional systems like the AJCC staging framework primarily depend on Tumor-Node-Metastasis (TNM) features, which are well-suited for common subtypes such as LUAD and LUSC. However, these models fall short in capturing the unique biological behavior of LCC. Its unpredictable progression and absence of targetable molecular drivers mean that TNM-based predictions often miss the mark. Consequently, clinicians currently lack reliable tools to stratify LCC patients into risk groups, tailor treatment sequencing, or accurately predict outcomes.
Recent advances in machine learning offer considerable promise by integrating diverse clinical, molecular, and demographic data to generate more accurate, individualized predictions. Yet, despite these technological strides, no machine learning-based prognostic model for LCC has been developed using large-scale population data. This gap underscores the urgent need for innovative research to harness machine learning and construct a robust, population-based prognostic tool specifically tailored to LCC patients. Such a model could transform clinical decision-making, enhance patient outcomes, and pave the way for more personalized treatment strategies in this challenging cancer subtype.
This study utilizes the Surveillance, Epidemiology, and End Results (SEER) database to construct and validate machine learning-based prognostic models for LCC. A rigorous comparative analysis was conducted to benchmark the predictive performance of these ML models against traditional prognostic methodologies, including Cox proportional hazards regression and the AJCC staging system. The analysis culminated in the development of a novel, web-based prognostic classifier featuring an intuitive interface designed to synthesize complex prognostic features. By incorporating dynamic visual analytics, this tool translates model outputs into clinically interpretable risk stratifications, thereby equipping clinicians with a data-driven decision-support instrument to optimize therapeutic strategies for LCC patients.
Methods
This retrospective study was conducted in accordance with the TRIPOD+ AI guidelines. 6 The methodological framework was adapted from our previous work, 7 in which a standardized model development and performance evaluation strategy was established. The present study utilized exclusively open-access databases and did not involve direct human or animal participation. Ethical approval was obtained from the Medical Ethics Committee of Maoming People’s Hospital, which granted an exemption due to the use of publicly available, de-identified data. Accordingly, the requirement for informed consent was waived.
Data Source and Access
The Surveillance, Epidemiology, and End Results (SEER) Program, initiated by the National Cancer Institute (NCI) in 1973, is a cornerstone of cancer surveillance in the United States. Designed to systematically collect and analyze data on cancer incidence, survival, prevalence, and mortality, SEER serves as a critical resource for researchers, clinicians, and policymakers. By tracking cancer trends across diverse populations, it informs public health strategies and advances understanding of cancer etiology, treatment outcomes, and disparities. This retrospective study accessed the SEER dataset under the SEER Research Data Agreement, and eligible patients were selectively identified based on predefined inclusion and exclusion criteria. Clinicopathological variables were extracted using SEER*Stat software version 8.4.0.1 (https://seer.cancer.gov/data-software/).
Patient Characteristics and Study Endpoint
Patient selection was based on the SEER database using the International Classification of Diseases for Oncology, Third Edition (ICD-O-3) histology codes. In this study, LCC was defined according to the SEER histology grouping framework rather than the most recent World Health Organization classification. Specifically, cases were identified using histology codes corresponding to the SEER-defined “Large Cell Carcinoma” category, which includes not only LCC, not otherwise specified (NOS; ICD-O-3 code 8012), but also related histologic subtypes grouped under this category for population-based reporting purposes. These subtypes include large cell neuroendocrine carcinoma (8013), lymphoepithelioma-like carcinoma (8082), basaloid carcinoma (8123), and clear cell carcinoma (8310), among others, as defined in the SEER Program Coding and Staging Manual. This approach is consistent with prior SEER-based epidemiological studies and ensures reproducibility within registry-based research. Patients were excluded if they lacked complete demographic or clinicopathological information, including age, sex, race, marital status, tumor location, size, laterality, or AJCC stage. Additional exclusions involved incomplete treatment history (surgery, chemotherapy, radiotherapy) or missing survival/follow-up data.
Overall survival (OS), the primary endpoint, was calculated from the date of diagnosis to death from any cause. Statistical analyses utilized SEER-derived feature to ensure consistency and minimize bias.
Baseline Characteristics and Demographics
The clinical and demographic characteristics of the study population were systematically analyzed. Continuous features were summarized using means and standard deviations, while categorical features were reported as frequencies and percentages. All available clinicodemographic and tumor-related features from the SEER database were initially considered as potential predictors of OS and subsequently subjected to rigorous selection using the Lasso and Boruta algorithms. These included demographic characteristics (age, sex, race, and marital status), tumor features (primary site, tumor size, grade, laterality, and AJCC TNM stage), metastatic status (bone, brain, liver, and lung metastases), and treatment-related variables (surgery of the primary site, chemotherapy, and radiotherapy).
Feature Engineering and Addressing Data Imbalance
To enhance model performance and address data imbalance, the study implemented a structured approach to feature engineering and class balancing. Spearman correlation analysis was initially conducted to assess monotonic relationships between features, with significant associations visualized through a heatmap.
For machine learning preprocessing, categorical features were transformed using one-hot encoding, converting them into binary matrices to ensure compatibility with predictive models. To mitigate class imbalance in outcome labels, the Synthetic Minority Over-sampling Technique (SMOTE) was applied. SMOTE generates synthetic samples for the minority class by selecting a data point, identifying its k-nearest neighbors, and interpolating new instances between them. This approach not only balances class distribution but also enhances the model’s ability to detect subtle patterns in underrepresented classes, ultimately improving predictive accuracy and mitigating bias toward the majority class.
Predictive Model Construction and Validation
To ensure a rigorous and unbiased analytical framework, eligible patients were randomly divided into training and validation datasets in a 7:3 ratio. The training dataset was exclusively used for feature selection, model development, and parameter tuning, while the validation dataset was strictly held out for independent performance evaluation to ensure the robustness and generalizability of the findings. Within the training set, the classification threshold was optimized using 10-fold cross-validation, with the objective of maximizing the time-dependent area under the receiver operating characteristic curve (AUC), thereby enhancing predictive accuracy and model stability.
To identify key prognostic features while avoiding data leakage, a two-step feature selection strategy was implemented entirely within the training dataset. First, Lasso-Cox regression was applied using the lambda.1se criterion to perform initial dimensionality reduction and select candidate predictors. Subsequently, the Boruta algorithm was employed to further refine feature selection, retaining only the most informative and stable features while minimizing redundancy. Using these selected features, traditional prognostic models were developed with Cox regression, while the AJCC staging model was constructed based on its predefined criteria. Additionally, four machine learning algorithms—XGBoost (XGB), Random Survival Forest (RSF), Artificial Neural Network (ANN), and Decision Trees (DT)—were trained to determine the most effective predictive model for OS.
Each machine learning model underwent hyperparameter tuning to optimize predictive performance and computational efficiency. The tuning process was conducted using a parallelized grid search, ensuring reproducibility by setting a fixed random seed.
Model performance was validated using 10-fold cross-validation, with predictive accuracy assessed via the concordance index (surv.cindex). Additionally, multicore parallelization was employed to enhance computational efficiency. This comprehensive approach ensured the development of a robust, high-performing prognostic framework.
Model Evaluation and Performance Metrics
The performance of the model was rigorously assessed using a variety of well-established metrics to ensure its robustness and reliability. Time-dependent Receiver Operating Characteristic (ROC) curve analysis was conducted to calculate the AUC, providing a key measure of the model’s discriminatory ability between different outcomes. Calibration analysis was employed to evaluate the alignment between predicted probabilities and actual outcomes, aiming for a close fit to the 45° diagonal in the calibration plot, which represents perfect calibration. Decision Curve Analysis (DCA) was used to assess the clinical utility of the model by analyzing net benefits across various probability thresholds, thereby helping to evaluate its practical applicability in clinical decision-making. Lastly, the Brier score, which quantifies predictive accuracy in survival analysis, was calculated by assessing the squared differences between predicted and observed outcomes. A lower Brier score indicates better predictive accuracy, with a score of zero signifying perfect predictions.
Model Interpretation
To improve the transparency and interpretability of the model, SHapley Additive exPlanations (SHAP) were employed to elucidate the contribution of each feature to the model’s predictions. SHAP identifies and quantifies the influence of each input feature providing a clearer understanding of how individual features impact model outcomes. The beeswarm summary plot, a prominent feature of SHAP, visually represents the effect of features on the model’s predictions, offering a comprehensive view of their relative importance. This visualization facilitates the identification of key predictors, ensuring that model results are both reliable and interpretable for clinicians.
To further explore the influence of individual features, the study also implemented breakdown and partial dependence analyses. Breakdown analysis provides a detailed, case-specific interpretation of model predictions, offering insights into how each feature contributes to individual predictions. This is particularly useful for understanding the nuanced, case-specific effects of features.
Conversely, partial dependence analysis evaluates the effect of specific features on the model’s predicted outcomes, while accounting for the influence of all other features. This method is particularly valuable for understanding complex models such as ensemble methods or neural networks, where the relationships between input features and outcomes may be non-linear. Partial Dependence Plots (PDPs) were utilized to isolate and explore the impact of key features, shedding light on their role in shaping the model’s predictions.
Additionally, the study incorporated Restricted Cubic Splines (RCS) to explore the relationship between continuous features and patient prognosis. This method enables the investigation of non-linear relationships, providing a more nuanced understanding of the role of continuous features in the predictive model.
Statistical Analysis
Statistical analyses were conducted using R software (version 4.4.1, https://www.r-project.org/) with two-tailed tests and a significance threshold set at P<0.05. The development of the prognostic model was supported by a range of R packages, including “tidyverse,” “mlr3proba,” “mlr3extralearners,” “survival,” “rcssci,” and “mlr3verse.” For enhanced user interaction and visualization, a web-based dynamic model was developed using the “shinydashboard” R package, facilitating real-time model access and decision support for clinicians.
Results
Study Population Characteristics
Baseline Characteristics of Enrolled LCC Patients

SD= Standard Deviation
Spearman correlation analysis demonstrated significant positive correlations among brain, liver, lung, and bone metastases, suggesting a propensity for multiple metastatic sites to co-occur. Conversely, chemotherapy exhibited a positive association with metastases, particularly bone and liver metastases, reflecting its frequent administration in advanced-stage disease (Supplementary Figure 1).
Identification of Key Predictors and Model Construction
This study performed a comprehensive analysis, evaluating a broad array of features, including demographic factors, tumor characteristics, and treatment modalities, all of which were considered as covariates in both Lasso-Cox regression and Boruta analyses. As depicted in Figure 1A and B, the initial Lasso-Cox regression analysis excluded race, marital status, tumor grade, tumor laterality, radiotherapy, and metastasis to bone and lung as independent predictors of OS. Subsequent feature selection through Boruta analysis refined this process, identifying nine key prognostic factors: chemotherapy, tumor size, T stage, age, M stage, surgery of the primary site, N stage, and metastasis to the liver and brain (Figure 1C). Building on these findings, traditional prognostic models were developed using Cox regression. To enhance the accuracy of survival predictions, additional prognostic models were constructed using machine learning algorithms, with the aim of improving the precision and reliability of outcome forecasts for LCC patients. Feature selection process using Lasso-Cox regression and Boruta analysis (A, B) Lasso-Cox regression results; (C) Boruta analysis output. SPS=Surgery of Primary Site
Model Discrimination Ability and Performance
Figure 2 presents the performance metrics for both the training and validation datasets. Among the models evaluated, the RSF model exhibited the highest discriminatory power. In the training dataset, it achieved time-dependent AUC values of 0.858 (95% CI: 0.838–0.878) for 3-year OS prediction and 0.863 (95% CI: 0.84–0.886) for 5-year OS prediction. This strong performance was consistent in the validation dataset, with AUCs of 0.841 (95% CI: 0.808–0.874) for 3-year OS prediction and 0.808 (95% CI: 0.764–0.845) for 5-year OS prediction. In contrast, the traditional Cox regression model demonstrated lower discriminatory ability. In the training dataset, the Cox model achieved AUCs of 0.814 (95% CI: 0.791–0.837) and 0.81 (95% CI: 0.783–0.837) for 3- and 5-year OS predictions, respectively. However, its performance showed signs of slight overfitting in the validation dataset, where AUCs elevated to 0.828 (95% CI: 0.794–0.862) and 0.805 (95% CI: 0.77–0.847) for 3- and 5-year predictions, respectively. Performance comparison of receiver operating characteristic (ROC) curves for 3-year (A, C) and 5-year (B, D) survival predictions in the training cohort (A, B) and validation cohort (C, D)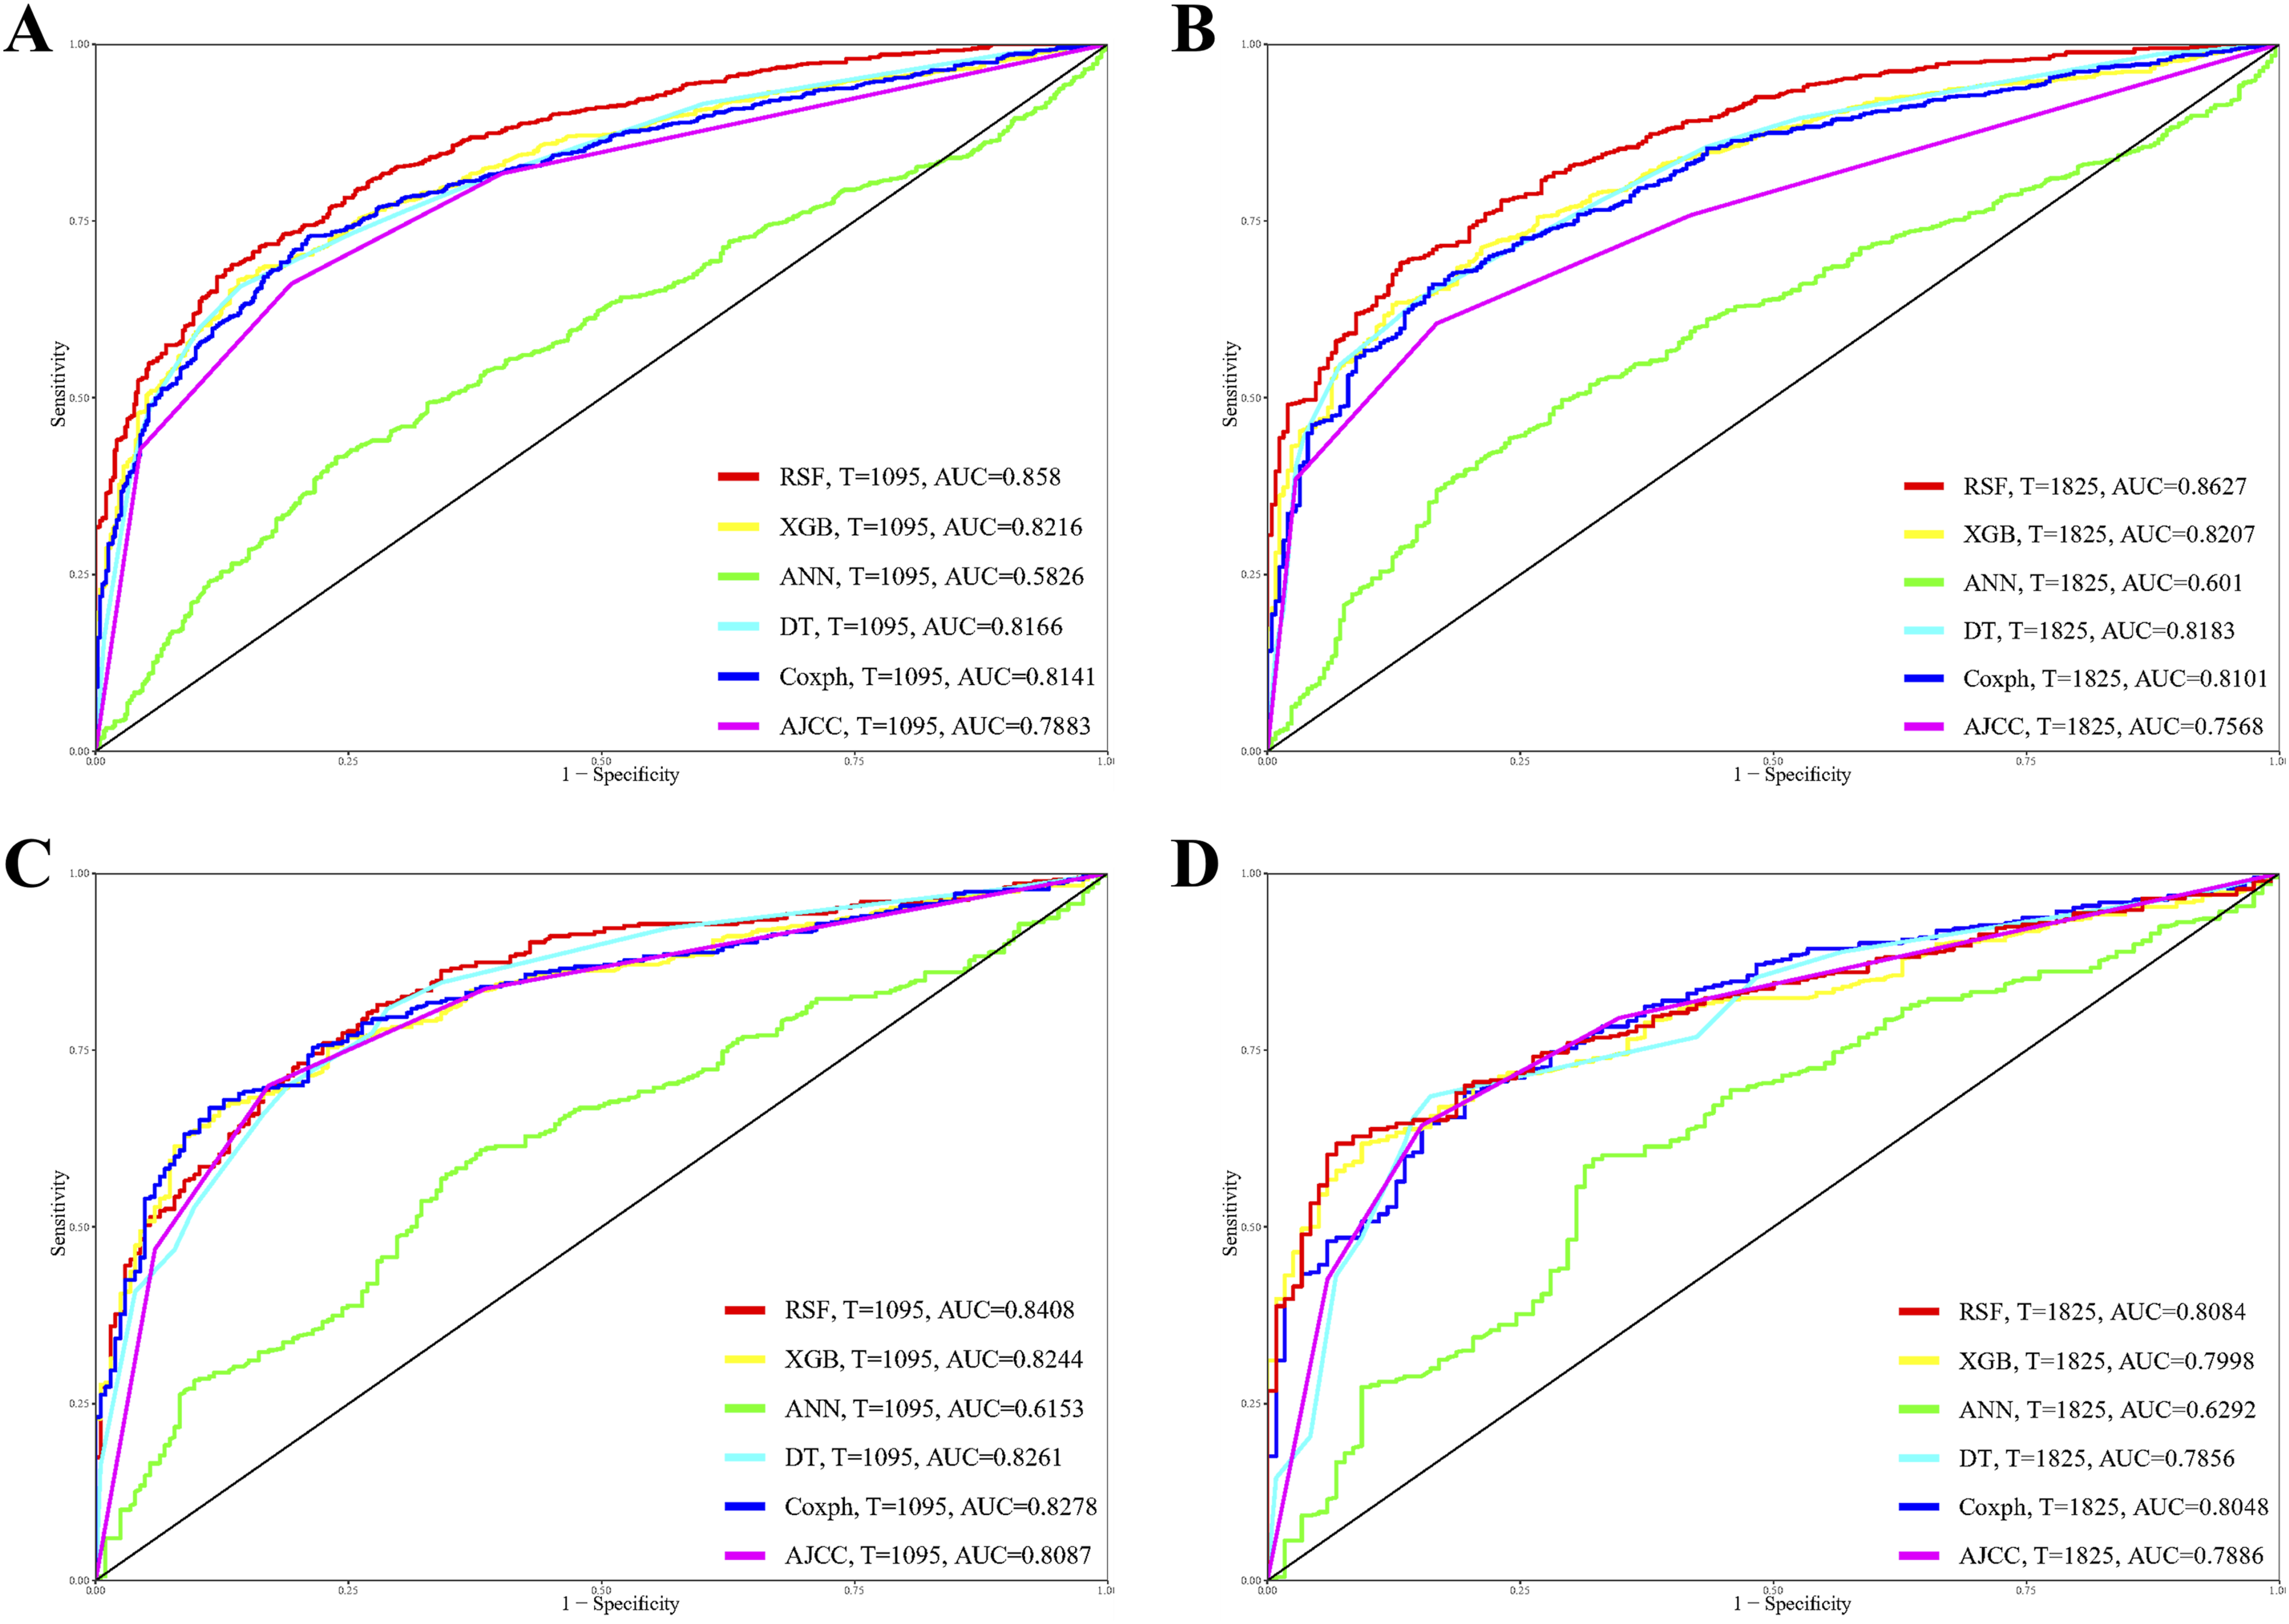
Assessment of the Area Under Curve and Brier Score Across the Developed Models

Assessment on DCA, Calibration, and Brier Score
Supplementary Figure 3 presents the DCA plots for both the training and validation datasets, demonstrating that the RSF model outperforms other machine learning and traditional models in predicting OS for LCC patients. Additionally, Supplementary Figure 4 illustrates the RSF model’s superior calibration performance compared to all other evaluated models. The model’s predicted survival probabilities closely align with the observed outcomes, indicating strong calibration. The robustness of the RSF model’s predictions is further supported by its Brier scores, as detailed in Table 2. In the training dataset, the RSF model achieved Brier scores of 0.15 and 0.137 for 3- and 5-year prognostications, respectively. In the validation dataset, the RSF model maintained strong performance, with Brier scores of 0.158 and 0.162, respectively.
Together, these results highlight the clinical utility of the RSF model in providing reliable, time-dependent survival predictions for LCC patients.
Model Interpretation
Given the RSF model’s strong predictive performance for OS, SHAP plots were utilized to determine feature importance and their impact on prognosis. As illustrated in Figure 3A, features with higher SHAP values correspond to an elevated risk of poor prognosis in LCC. The color gradient, ranging from dark blue (low values) to light green (high values), visually represents feature intensity. Notably, tumor size exerts the greatest influence on mortality risk, followed by liver metastasis, M stage, brain metastasis, T stage, chemotherapy, surgery of primary site, N stage, and age. Analysis of categorical features indicates that higher positive SHAP values for M1 status, T4 classification, and the presence of liver metastases are strongly associated with an elevated risk of mortality. Conversely, categories such as M0 and certain surgical interventions exhibit negative SHAP values, suggesting a more favorable prognosis. The variability in box plot distributions across each categorical feature underscores the heterogeneity of patient characteristics and highlights the importance of personalized risk assessment (Figure 3B). SHAP summary plots for the RSF model (A) overall SHAP values and (B) SHAP value distribution for categorical features, illustrating their impact on model predictions
To gain deeper insights into individual predictions, a breakdown analysis was conducted on the first patient in the cohort (Figure 4). The absence of chemotherapy was linked to poorer survival outcomes. In contrast, several features contributed to a more favorable prognosis, including surgical intervention at the primary tumor site, an early AJCC stage (T2N0M0), younger age, smaller tumor size, and the absence of metastasis to the brain and liver. This patient-level analysis highlights the key features influencing survival predictions. Breakdown analysis using features derived from the first member of the cohort in the RSF model
Figure 5 presents partial dependence survival profiles, illustrating the impact of various clinical features on predicted survival over time. Among categorical features, brain and liver metastases are strongly associated with lower survival probabilities, highlighting the detrimental effect of distant metastases. Similarly, M1 patients exhibit worse survival outcomes than M0 patients, reinforcing the prognostic significance of metastatic status. Lymph node involvement also plays a crucial role, with survival probabilities declining as N stage progresses, particularly in N3 patients. Tumor burden, reflected by T stage, follows a similar trend, where patients with T1 tumors have the most favorable prognosis, while those with T4 experience the poorest outcomes. Treatment-related factors further influence survival, as patients who underwent surgery at the primary tumor site demonstrate significantly improved outcomes compared to those who did not. Additionally, chemotherapy is associated with a survival benefit, whereas the absence of known chemotherapy treatment correlates with poorer prognosis. Partial dependence profiles showing the influence of categorical features on model performance
For continuous features, larger tumor size is linked to a progressive decline in survival probabilities, emphasizing its critical role as a prognostic factor. Similarly, increasing age corresponds to reduced survival, with older patients experiencing significantly worse outcomes compared to younger individuals (Figure 6A). Collectively, these findings underscore the prognostic significance of age, metastatic burden, nodal involvement, tumor size, tumor stage, and treatment interventions in LCC, offering valuable insights for refining risk stratification and guiding therapeutic decision-making. Partial dependence profiles showing the influence of continuous features on model performance(A) and RCS examining the relationship between the continuous features and survival outcome
Non-Linear Prognostic Impact of Age and Tumor Size on Survival
RCS analysis was conducted to assess the potential non-linear associations between age, tumor size, and patient prognosis. The inflection point for OS was identified as 1. After adjusting for other prognostic features, Figure 6B highlights a significant non-linear correlation between tumor size and mortality (p = 0.023), with a threshold of 53.47 mm. In contrast, Figure 6C indicates that the non-linear relationship between age and mortality risk is not statistically significant (p > 0.05). These findings suggest that while age does not exhibit a substantial non-linear impact on mortality, tumor size plays a crucial prognostic role in predicting patient outcomes.
Creation of a Predictive System Hosted on a Web Server
Building upon the robust RSF model, this study introduces a web-based application designed to facilitate the predictive assessment of OS using patient data. Developed to support researchers with limited expertise in machine learning, the platform provides an intuitive and automated framework for model setup, training, and evaluation. The user-friendly interface, depicted in Supplementary Figure 5, enhances accessibility and usability. The application is available at: https://lungcare-innovators-research-team.shinyapps.io/LCC-prognosis-predictor/.
Discussion
In this study, we analyzed a cohort of 1,867 patients with LCC to evaluate prognostic outcomes. Our findings demonstrate that the RSF algorithm outperforms conventional prognostic methods, such as Cox proportional hazards regression and the AJCC staging system, in predicting OS. SHAP analysis further identified tumor size as the most influential prognostic feature. Based on the optimized RSF framework, we developed an interactive web-based tool that provides clinicians with individualized risk assessments, thereby supporting more informed treatment decisions and personalized patient management. This work represents a novel application of machine learning in prognostic modeling for LCC, addressing a critical gap in current oncology research by integrating advanced computational techniques with clinical practice.
The AJCC staging system is widely used to predict prognosis in LCC; however, it is limited by its focus on tumor anatomy, thereby neglecting critical biological and molecular factors that influence metastatic potential and treatment response. 8 This limitation underscores the need for more comprehensive predictive tools that integrate a broader spectrum of clinical data to enhance prognostic accuracy. In this context, machine learning emerges as a promising alternative by harnessing clinical, genetic, and imaging data to identify complex patterns. Such approaches can yield more precise prognostic predictions, facilitate personalized treatment strategies, and potentially reveal novel therapeutic targets, ultimately advancing patient care and cancer research.9,10 Despite these promising developments, a substantial gap remains in creating models specifically tailored to predict survival outcomes in LCC, irrespective of whether traditional or machine learning-based methods are applied.
Numerous studies have investigated mortality risk in LCC patients.11-14 For instance, Yao et al1 12 conducted a retrospective analysis using SEER data that included 11,349 elderly LCC patients and 129,118 patients with other NSCLC subtypes. Following propensity score matching, Kaplan–Meier analysis and multivariate Cox regression demonstrated that LCC patients had significantly poorer survival outcomes compared to those with other NSCLC types. Their study further identified prognostic factors for LCC, including white race, male gender, non-upper lobe tumor location, advanced stage, older age at diagnosis, bone and liver metastases, single marital status, absence of lymphadenectomy, lack of surgical intervention, and omission of chemotherapy. Similarly, Liu et al1 11 evaluated five clinical prognostic parameters in a cohort of 3197 LCC patients, highlighting factors such as advanced age, male gender, later stage, and tumors located in the main bronchus or overlapping lesions. In another study, Zheng et al1 14 identified four independent prognostic factors associated with the risk of synchronous brain metastases in LCC, namely age, T stage, bone metastasis, and chemotherapy. Additionally, Hu et al1 13 constructed a prognostic model for resected LCC patients, revealing that age, stage, and treatment modalities were independent predictors of overall survival in early-stage LCC.
Despite these valuable insights, many of the aforementioned studies focused solely on identifying prognostic factors using traditional statistical methods, without developing comprehensive prognostic models tailored to LCC. Furthermore, several investigations concentrated on specific LCC subpopulations, thereby limiting the generalizability of their findings. In contrast, the model presented in this study is specifically designed for LCC. By applying an extensive, geographically diverse dataset and employing advanced machine learning techniques, our approach offers enhanced precision in mortality prediction and holds promise for broader applicability in future prognostic assessments.
The prognostic evaluation using both Lasso and Boruta algorithms consistently identified nine independent predictive features, aligning with previous research. SHAP analysis indicated that among categorical features, tumor size, liver metastasis, and M stage exerted the greatest influence on survival outcomes. Further analyses confirmed that brain and liver metastases are strongly associated with reduced survival probabilities, while patients with M1 status experienced worse outcomes compared to those with M0. Additionally, as lymph node involvement progressed, particularly in N3 patients, survival probabilities declined. Tumor burden, reflected by T stage, also played a significant role, with T1 tumors correlating with the most favorable prognosis and T4 tumors with the poorest outcomes. Treatment factors were equally important: patients who underwent surgery at the primary tumor site and received chemotherapy demonstrated improved survival outcomes. Analysis of continuous features further revealed that larger tumor size and increasing age were associated with a progressive decline in survival. In summary, these results underscore the critical impact of tumor characteristics, metastatic status, and treatment interventions on patient prognosis, thereby providing a robust framework for predicting survival outcomes in this population.
Although the RSF model demonstrated slightly higher time-dependent AUC values compared with the Cox regression model, partial overlap in the corresponding confidence intervals was observed, suggesting that the difference in discrimination may not be statistically significant when considered in isolation. To provide a more comprehensive and clinically meaningful evaluation, model performance was assessed using multiple complementary metrics, including discrimination (time-dependent AUC), calibration (calibration curves), Brier score, and clinical utility (DCA). Notably, the RSF model consistently exhibited superior calibration performance, lower Brier scores, and greater net clinical benefit across a wide range of threshold probabilities in DCA compared with the compared with both the traditional Cox model and other machine learning models. These findings indicate that, despite overlapping AUC confidence intervals, the RSF model demonstrates more robust overall performance.
Nevertheless, several limitations warrant consideration. First, histologic classification was based on SEER ICD-O-3 coding, which groups multiple related subtypes under LCC for registry purposes. In contrast, the contemporary WHO classification recognizes several of these entities as distinct pathological subtypes. Consequently, our cohort represents a broader, historically defined LCC-related group rather than a strictly homogeneous entity, which may introduce heterogeneity and limit clinical interpretability for narrowly defined LCC populations. However, this approach enhances generalizability within real-world, population-based datasets. Second, the retrospective design may introduce selection bias, and the SEER database lacks detailed clinical parameters, such as genetic profiles (e.g., PIK3A, CDKN2A, TP53), smoking history, treatment specifics, and comorbidities—all of which have been linked to patient prognosis.15-17 Although rigorous methods including Lasso regularization, Boruta feature selection, and cross-validation were applied to mitigate overfitting, the rarity of LCC makes assembling sufficiently large and representative cohorts for external validation inherently challenging. Therefore, external validation using multicenter, independent datasets remains essential to further establish the generalizability and robustness of the model.
Conclusions
This study presents a machine learning-based prognostic tool for LCC that empowers clinicians to customize treatment strategies and optimize follow-up scheduling in the post-surgical setting. By stratifying patients according to individualized risk profiles, this model addresses a critical gap in managing this understudied population, thereby advancing precision in clinical decision-making.
Supplemental Material
Supplemental Material - Comparative Analysis of Machine Learning Algorithms for Prognostic Prediction in Pulmonary Large Cell Carcinoma
Supplemental Material for Comparative Analysis of Machine Learning Algorithms for Prognostic Prediction in Pulmonary Large Cell Carcinoma by Fan Yang, Chaowen He, Dongxuan Huang, Xiaoyi Hu, and Min Liang in Cancer Control.
Footnotes
Acknowledgments
The authors thank Mrs. Yunru Fan and Dr. Alexandra Lam for coordinating and supporting the development and preparation of the manuscript.
Ethical Considerations
The present study utilized exclusively open-access databases and did not involve direct human or animal participation. Ethical approval was obtained from the Medical Ethics Committee of Maoming People’s Hospital, which granted an exemption due to the use of publicly available, de-identified data. Accordingly, the requirement for informed consent was waived.
Author Contributions
ML: Conceptualization (lead); funding acquisition (lead); writing – review and editing (supporting). FY: Data curation (equal); formal analysis (equal); writing – original draft (equal); writing – review and editing (equal). CW.H: Writing – review and editing (supporting). DX.H: Writing – review and editing (supporting). XY.H: Writing – review and editing (supporting).
Funding
The authors received no financial support for the research, authorship, and/or publication of this article.
Declaration of Conflicting Interests
The authors declared no potential conflicts of interest with respect to the research, authorship, and/or publication of this articlNone.
Data Availability Statement
Supplemental Material
Supplemental material for this article is available online.
Appendix
References
Supplementary Material
Please find the following supplemental material available below.
For Open Access articles published under a Creative Commons License, all supplemental material carries the same license as the article it is associated with.
For non-Open Access articles published, all supplemental material carries a non-exclusive license, and permission requests for re-use of supplemental material or any part of supplemental material shall be sent directly to the copyright owner as specified in the copyright notice associated with the article.