
Abstract
Introduction
Brain metastases (BM) represent a common and fatal progression in small cell lung cancer (SCLC), yet prognostic tools for this population remain underdeveloped. This study aimed to establish and externally validate a machine learning–based model to predict overall survival (OS) in SCLC patients with BM.
Methods
We extracted clinical data from 2392 SCLC patients with BM from the SEER database to construct prognostic models using Cox regression, AJCC staging, and four machine learning algorithms: Random Survival Forest (RSF), Extreme Gradient Boosting (XGB), Elastic Net (Enet), and Artificial Neural Network (ANN). Key features were selected via Lasso-Cox regression. Model performance was evaluated using time-dependent AUC, calibration curves, Brier scores, precision-recall (PR) curves, and decision curve analysis (DCA). SHAP and partial dependence plots were applied for model interpretability. External validation was conducted using an independent hospital-based cohort of 85 patients, with comparability to the SEER cohort addressed through inverse probability of treatment weighting (IPTW).
Results
Among all models, the RSF algorithm demonstrated the best overall performance. In the training cohort, it achieved AUCs of 0.738 and 0.809 for 1-year and 2-year OS, respectively. In the internal validation cohort, AUCs were 0.718 and 0.748, and in the external validation cohort, 0.686 and 0.802, respectively. The RSF model also showed favorable calibration and the lowest Brier scores across datasets. SHAP analysis ranked chemotherapy, liver metastasis, N stage, and age as the most influential prognostic features. A web-based calculator was developed to enable real-time individualized risk prediction.
Conclusions
This study presents a robust, interpretable, and externally validated RSF-based model for predicting OS in SCLC patients with BM. The model offers clinically relevant insights and is accessible via an online tool, supporting its potential integration into personalized treatment planning.
Keywords
Introduction
Small cell lung cancer (SCLC) is a highly aggressive subtype of lung cancer, accounting for approximately 15% of all lung cancer cases. 1 Despite initial sensitivity to chemotherapy and radiotherapy, SCLC is characterized by rapid disease progression, early dissemination, and a high propensity for distant metastasis. 2 Among metastatic sites, the brain is one of the most common and devastating locations for SCLC spread, with brain metastases (BM) occurring in up to 40-50% of patients during the course of the disease. 3 The presence of BM significantly worsens prognosis and quality of life, with median survival often measured in months despite advances in treatment strategies.4,5
Accurate prediction of survival outcomes in SCLC patients with BM is critical for informing clinical decision-making, optimizing individualized treatment plans, and identifying patients who may benefit from more aggressive or palliative approaches. However, existing prognostic models are limited in their performance and generalizability, often relying on conventional statistical methods and a small number of clinical variables.6–8 Moreover, the inherent heterogeneity of SCLC and the complex interplay between clinical, demographic, and treatment-related factors further complicate outcome prediction. 9
In recent years, machine learning has emerged as a powerful tool for survival analysis and risk stratification in oncology. 10 By utilizing large-scale datasets and uncovering non-linear associations among diverse features, machine learning algorithms have demonstrated superior predictive performance over traditional approaches in several cancer types. 11 Nevertheless, limited studies have specifically targeted survival prediction in SCLC patients with BM using sufficiently large cohorts, and external validation remains rare.
To address this unmet need, we developed and externally validated a machine learning–based prognostic model to predict survival in SCLC patients with BM. The model was constructed using data from the Surveillance, Epidemiology, and End Results (SEER) program and subsequently validated using an independent cohort from our institution. By integrating population-based data with real-world clinical records and employing explainable ML techniques, our study aims to deliver a robust, interpretable, and generalizable tool to support personalized prognostication in this challenging patient population.
Methods
This retrospective study was reported in accordance with the TRIPOD + AI guidelines. 12
Data Source and Access
The SEER program is a comprehensive population-based cancer registry system maintained by the National Cancer Institute (NCI) of the United States. It collects detailed information on cancer incidence, patient demographics, tumor characteristics, treatment modalities, and survival outcomes. Covering approximately 34.6% of the U.S. population, the SEER database is widely regarded as a reliable resource for epidemiological and clinical cancer research. For this study, we extracted data from the SEER*Stat software (version 8.4.0.1) using the [SEER Research Plus Data,18 registries, covering the period 2000-2018] dataset. All patients with a diagnosis of SCLC and BM were identified using the International Classification of Diseases for Oncology, Third Edition (ICD-O-3) histology code 8041.
For external validation of the prognostic model, we used a single-center cohort consisting of 85 patients diagnosed with SCLC and BM at our institution during the same study period. Ethical approval for the use of institutional data was obtained from the Ethics Committee of Maoming People’s Hospital (Approval No. PJ2025MI-K078-01).
Eligibility Criteria and Outcome Measures
Benefiting from the large sample size of the SEER database and to preserve the real-world distribution of variables, this study adopted a complete-case analysis approach, excluding all entries with missing data. To ensure the robustness and reliability of the prognostic modeling, cases with missing data in critical continuous or categorical features such as age, sex, race, tumor size, tumor laterality, tumor location, and tumor stage were excluded. Patients lacking complete information on treatment modalities (i.e., surgery or radiotherapy) or those without documented survival time and follow-up status were also excluded. Consequently, multiple imputation techniques were not employed in this study. A detailed flowchart of the cohort selection process is presented in Supplementa Figure 1.
To retain sample size and maintain alignment with real-world clinical conditions, certain non-essential features with inherent missingness such as marital status and metastatic status to bone, brain, or liver were retained by introducing an “unknown” category. This strategy reflects the practical limitations of clinical documentation, where specific diagnostic assessments may not have been performed, or patients may have declined to disclose personal information.
The primary endpoint of this study was overall survival (OS), defined as the time from initial diagnosis to death from any cause. Patients who were alive at the time of last follow-up were censored.
Descriptive Analysis of the Study Cohort
The clinical and demographic characteristics of the study cohort were systematically analyzed. Continuous features were summarized using means and standard deviations, while categorical features were reported as frequencies and percentages. The analysis aimed to identify independent prognostic factors associated with survival in patients with SCLC and BM. Key features assessed included demographic factors (age, sex, race, and marital status), clinicopathological features (tumor location, laterality, size, histological grade, and stage), and treatment-related features (surgical resection, chemotherapy, and radiotherapy).
Feature Transformation and Resampling Strategy
To enhance model performance and address class imbalance, a structured approach to feature engineering and data preprocessing was implemented. Spearman correlation analysis was initially conducted to assess monotonic relationships among continuous and ordinal features. The results were visualized using a heatmap to identify potential multicollinearity and inform features selection.
Categorical features were processed using one-hot encoding, converting each category into binary indicators to ensure compatibility with machine learning algorithms. To correct for class imbalance in the outcome feature, the Synthetic Minority Over-sampling Technique (SMOTE) was applied. SMOTE is an established resampling method that generates synthetic examples of the minority class by interpolating between existing observations and their k-nearest neighbors. This approach improves class distribution, mitigates bias toward the majority class, and facilitates the learning of decision boundaries associated with underrepresented outcomes, thereby enhancing the model’s generalizability and predictive accuracy.
Covariate Balancing Using Stabilized IPTW
To minimize baseline discrepancies between the SEER training cohort and the external validation cohort, we applied stabilized inverse probability of treatment weighting (IPTW) based on propensity scores. A logistic regression model was used to estimate the probability of an individual belonging to the external validation cohort as a function of baseline covariates, including demographic characteristics, tumor features, and treatment modalities.
Stabilized IPTW weights were calculated to reduce the influence of extreme values and enhance estimate precision. Specifically, weights were defined as the marginal probability of treatment divided by the propensity score for treated individuals, and the marginal probability of non-treatment divided by the complement of the propensity score for untreated individuals. To improve the stability of effect estimates in the IPTW analysis, extreme weights were truncated at the 1st-99th percentiles. This stabilization helps maintain the sample size scale and improves statistical efficiency.
After weighting, covariate balance between the cohorts was assessed using absolute standardized mean differences (SMDs). A threshold of SMD <0.1 was considered indicative of good balance. To ensure valid inference under the weighted pseudo-population, robust (sandwich-type) variance estimation was employed in subsequent outcome modeling.
Feature Selection, Model Development, and Validation
To establish a robust analytical framework, eligible patients were randomly allocated to training and internal validation cohorts in a 7:3 ratio. The training cohort was used for model development and risk estimation, while both the internal and external validation cohorts served as independent datasets to evaluate model performance, thereby ensuring the reliability and generalizability of the results. Within the training cohort, the classification threshold was optimized via 10-fold cross-validation, with the primary objective of maximizing the time-dependent area under the receiver operating characteristic curve (AUC) to enhance predictive precision and temporal discrimination.
All baseline features listed in the patient characteristics table, including demographic factors, tumor and metastatic characteristics, and treatment-related features, were entered into the Least Absolute Shrinkage and Selection Operator (Lasso)-Cox regression model for feature selection. This approach was applied to manage multicollinearity, prevent overfitting, and objectively identify the most informative prognostic predictors. The selection process was entirely data driven, and no features were forced into the model based on prior clinical assumptions. Only predictors with nonzero coefficients after penalization were retained for subsequent model development. A two-stage strategy was implemented to develop models based on conventional algorithms. Initially, Lasso-Cox regression employing the lambda.1se criterion was applied to screen relevant predictors. Subsequently, multivariable Cox proportional hazards regression was used to develop traditional prognostic models based on the selected features. Concurrently, the American Joint Committee on Cancer (AJCC) staging model was constructed in accordance with established clinical staging guidelines.
In parallel, four machine learning algorithms, Random Survival Forest (RSF), Extreme Gradient Boosting (XGB), Artificial Neural Network (ANN), and Elastic Net (Enet), were implemented to systematically compare their predictive utility for OS. Hyperparameter tuning was performed for each algorithm to optimize predictive accuracy and computational efficiency. A parallelized grid search strategy facilitated parameter optimization, with a predefined random seed ensuring methodological reproducibility:
RSF Model
Hyperparameter tuning was performed using the surv.rfsrc learner. Key parameters were optimized based on their impact on predictive accuracy: the number of trees (ntree, 200-500) to balance bias and variance, the number of variables randomly selected at each split (mtry, 3-5) to control feature diversity, and the minimum terminal node size (nodesize, 15-21) to prevent overfitting while preserving granularity in survival estimation. Parameter selection was guided by out-of-bag error and concordance index.
XGB Model
A Cox proportional hazards variant of XGB (surv.xgboost.cox) was implemented following treatment encoding for categorical variables. Hyperparameters were tuned to optimize convergence and prevent overfitting: number of boosting iterations (nrounds, 100-1000), maximum tree depth (max_depth, 1-5), learning rate (eta, 1e−4-1), subsampling rate, and regularization parameters (lambda and alpha). Selection was based on cross-validated concordance index to identify the best-performing combination.
ANN Model
A DeepSurv architecture was trained using the surv.deepsurv learner. The network optimization employed the Adam optimizer with a batch size of 32 and a maximum of 500 epochs, alongside early stopping with a patience parameter of 20 to prevent overfitting. Hyperparameter tuning included the number of hidden layers (1-3), neurons per layer (5-13), learning rate (0-0.1), dropout rate (0-0.5), and weight decay (0-0.5). Activation functions and a custom transformation function (extra_trafo) were used to dynamically define the network architecture. Parameter selection was guided by the validation concordance index, ensuring both predictive performance and model stability.
Enet Model
Elastic Net regularization was applied, tuning the mixing parameter (alpha, 0-1) to balance L1 and L2 penalties and the regularization strength (lambda, denoted as s, 1e−4-0.2). The optimal combination was determined via cross-validation to maximize predictive accuracy while avoiding overfitting.
Comprehensive Performance Evaluation Framework
To rigorously evaluate the model’s robustness and reliability, its performance was systematically assessed using established statistical metrics. Time-dependent Receiver Operating Characteristic (ROC) analysis was conducted to compute the AUC, quantifying the model’s discriminative capacity for differentiating outcomes over time. A higher AUC indicates superior ability to correctly classify positive and negative events.
To evaluate the discriminative performance of the models, PR curves were generated for each model at predefined time points. The PR curve plots precision (positive predictive value) against recall (sensitivity) and is particularly informative in the context of imbalanced datasets, where the proportion of positive cases is low. For each model, we calculated the area under the precision-recall curve (AUPRC) as a summary metric to quantify classification performance. A higher AUPRC indicates better ability to correctly identify true positive cases while minimizing false positives. All PR curve analyses were performed using the “PRROC” or “precrec” package in R, depending on the model type and evaluation framework.
Calibration analysis was performed to evaluate the agreement between predicted probabilities and observed event rates; optimal calibration is evidenced by a curve approximating the 45° reference line, indicating minimal deviation between predictions and observations. Additionally, the Brier score was computed to assess overall predictive accuracy in survival analysis, defined as the mean squared difference between predicted probabilities and observed binary outcomes. Lower Brier scores denote enhanced predictive precision, with a theoretical minimum of zero indicating perfect accuracy.
Clinical utility was further appraised using Decision Curve Analysis (DCA), which quantifies the net benefit of the predictive model across a spectrum of probability thresholds to determine its value in clinical decision-making contexts.
Model Interpretability and Prognostic Factor Exploration
To improve model transparency and foster a deeper understanding of the prediction process, SHapley Additive exPlanations (SHAP) were employed to quantify the contribution of individual features to the model’s outputs in the training cohort. SHAP assigns each input feature a contribution value (Shapley value), allowing for interpretation of the direction and magnitude of its influence on the predicted outcome. A beeswarm summary plot was generated to visualize the distribution and importance of each feature, offering a comprehensive overview of their relative prognostic impact. This visualization supports clinical interpretability by highlighting the key features driving the model’s decisions.
To further explore feature influence, additional interpretability techniques were applied. Breakdown analysis was used to decompose individual predictions, providing case-specific explanations that clarify how each feature contributed to a specific outcome—an approach especially valuable for personalized risk assessment in clinical settings.
In parallel, partial dependence analysis was conducted to examine the marginal effect of individual features on the model’s predictions while holding other features constant. This method is particularly useful for interpreting complex, non-linear models such as ensemble learners and neural networks. The resulting Partial Dependence Plots (PDPs) offered intuitive insights into the relationships between predictors and survival risk.
Statistical Analysis
All statistical analyses were performed using R software (version 4.4.1, https://www.r-project.org/). Two-sided statistical tests were used throughout, with a significance threshold set at P < 0.05. Prognostic modeling and validation were conducted using a suite of specialized R packages, including “mlr3proba,” “mlr3extralearners,” “survival,” and “mlr3verse,” enabling a robust and reproducible analytical pipeline.
To enhance the model’s accessibility and clinical utility, an interactive web-based application was developed using the “shinydashboard” package(version 1.12.1), providing a user-friendly platform for real-time survival prediction and individualized risk estimation.
Results
Study Population Characteristics
From an initial cohort of 23,102 patients with SCLC, A total of 2392 eligible patients diagnosed with SCLC and BM were identified from the SEER database and included in the final analysis. The average age of the cohort was 65.13 years, the mean survival time is 9.19 months, and the overall mortality rate was 98.20%. Demographically, the majority of patients were White (84.95%), with a nearly even distribution between males (52.72%) and females (47.28%). Over half of the patients were married (51.17%). Regarding tumor characteristics, the right lung was more commonly affected (55.48%), with tumors most frequently located in the upper lobes (59.66%). The average tumor size was 53.45 mm. Most tumors were classified as grade III or IV. In terms of disease staging, 36.33% of patients were diagnosed with T4 disease, 55.43% with N2 stage, and 99.21% had M1b distant metastases. Treatment patterns showed that the majority of patients received chemotherapy (77.59%) and radiotherapy (78.55%), while only 1.13% underwent surgical resection. Common metastatic sites included the bone (27.26%), liver (29.81%), and lung (16.10%).
Baseline Demographic and Clinical Characteristics of Patients With Small Cell Lung Cancer and Brain Metastases

SD: Standard deviation; *The P-value represents the statistical comparison between the training and validation sets in the SEER dataset.
As shown in Figure 1A, most correlation coefficients were relatively low, falling between −0.2 and 0.2, indicating generally weak monotonic associations among the majority of features. A few moderate correlations were observed. For instance, surgery at the primary site showed a moderate positive correlation with tumor grade (r = 0.36), suggesting that patients with higher-grade tumors were more likely to undergo surgical treatment. Additionally, chemotherapy demonstrated weak but consistent positive correlations with features such as radiotherapy and lung metastasis, although none exceeded r = 0.2. Feature selection and preprocessing workflow. (A): Spearman correlation matrix illustrating relationships among features. (B–C): Lasso-Cox regression analysis used to identify significant prognostic features. (D): Love plot depicting covariate balance before and after IPTW adjustment between SEER and external validation cohorts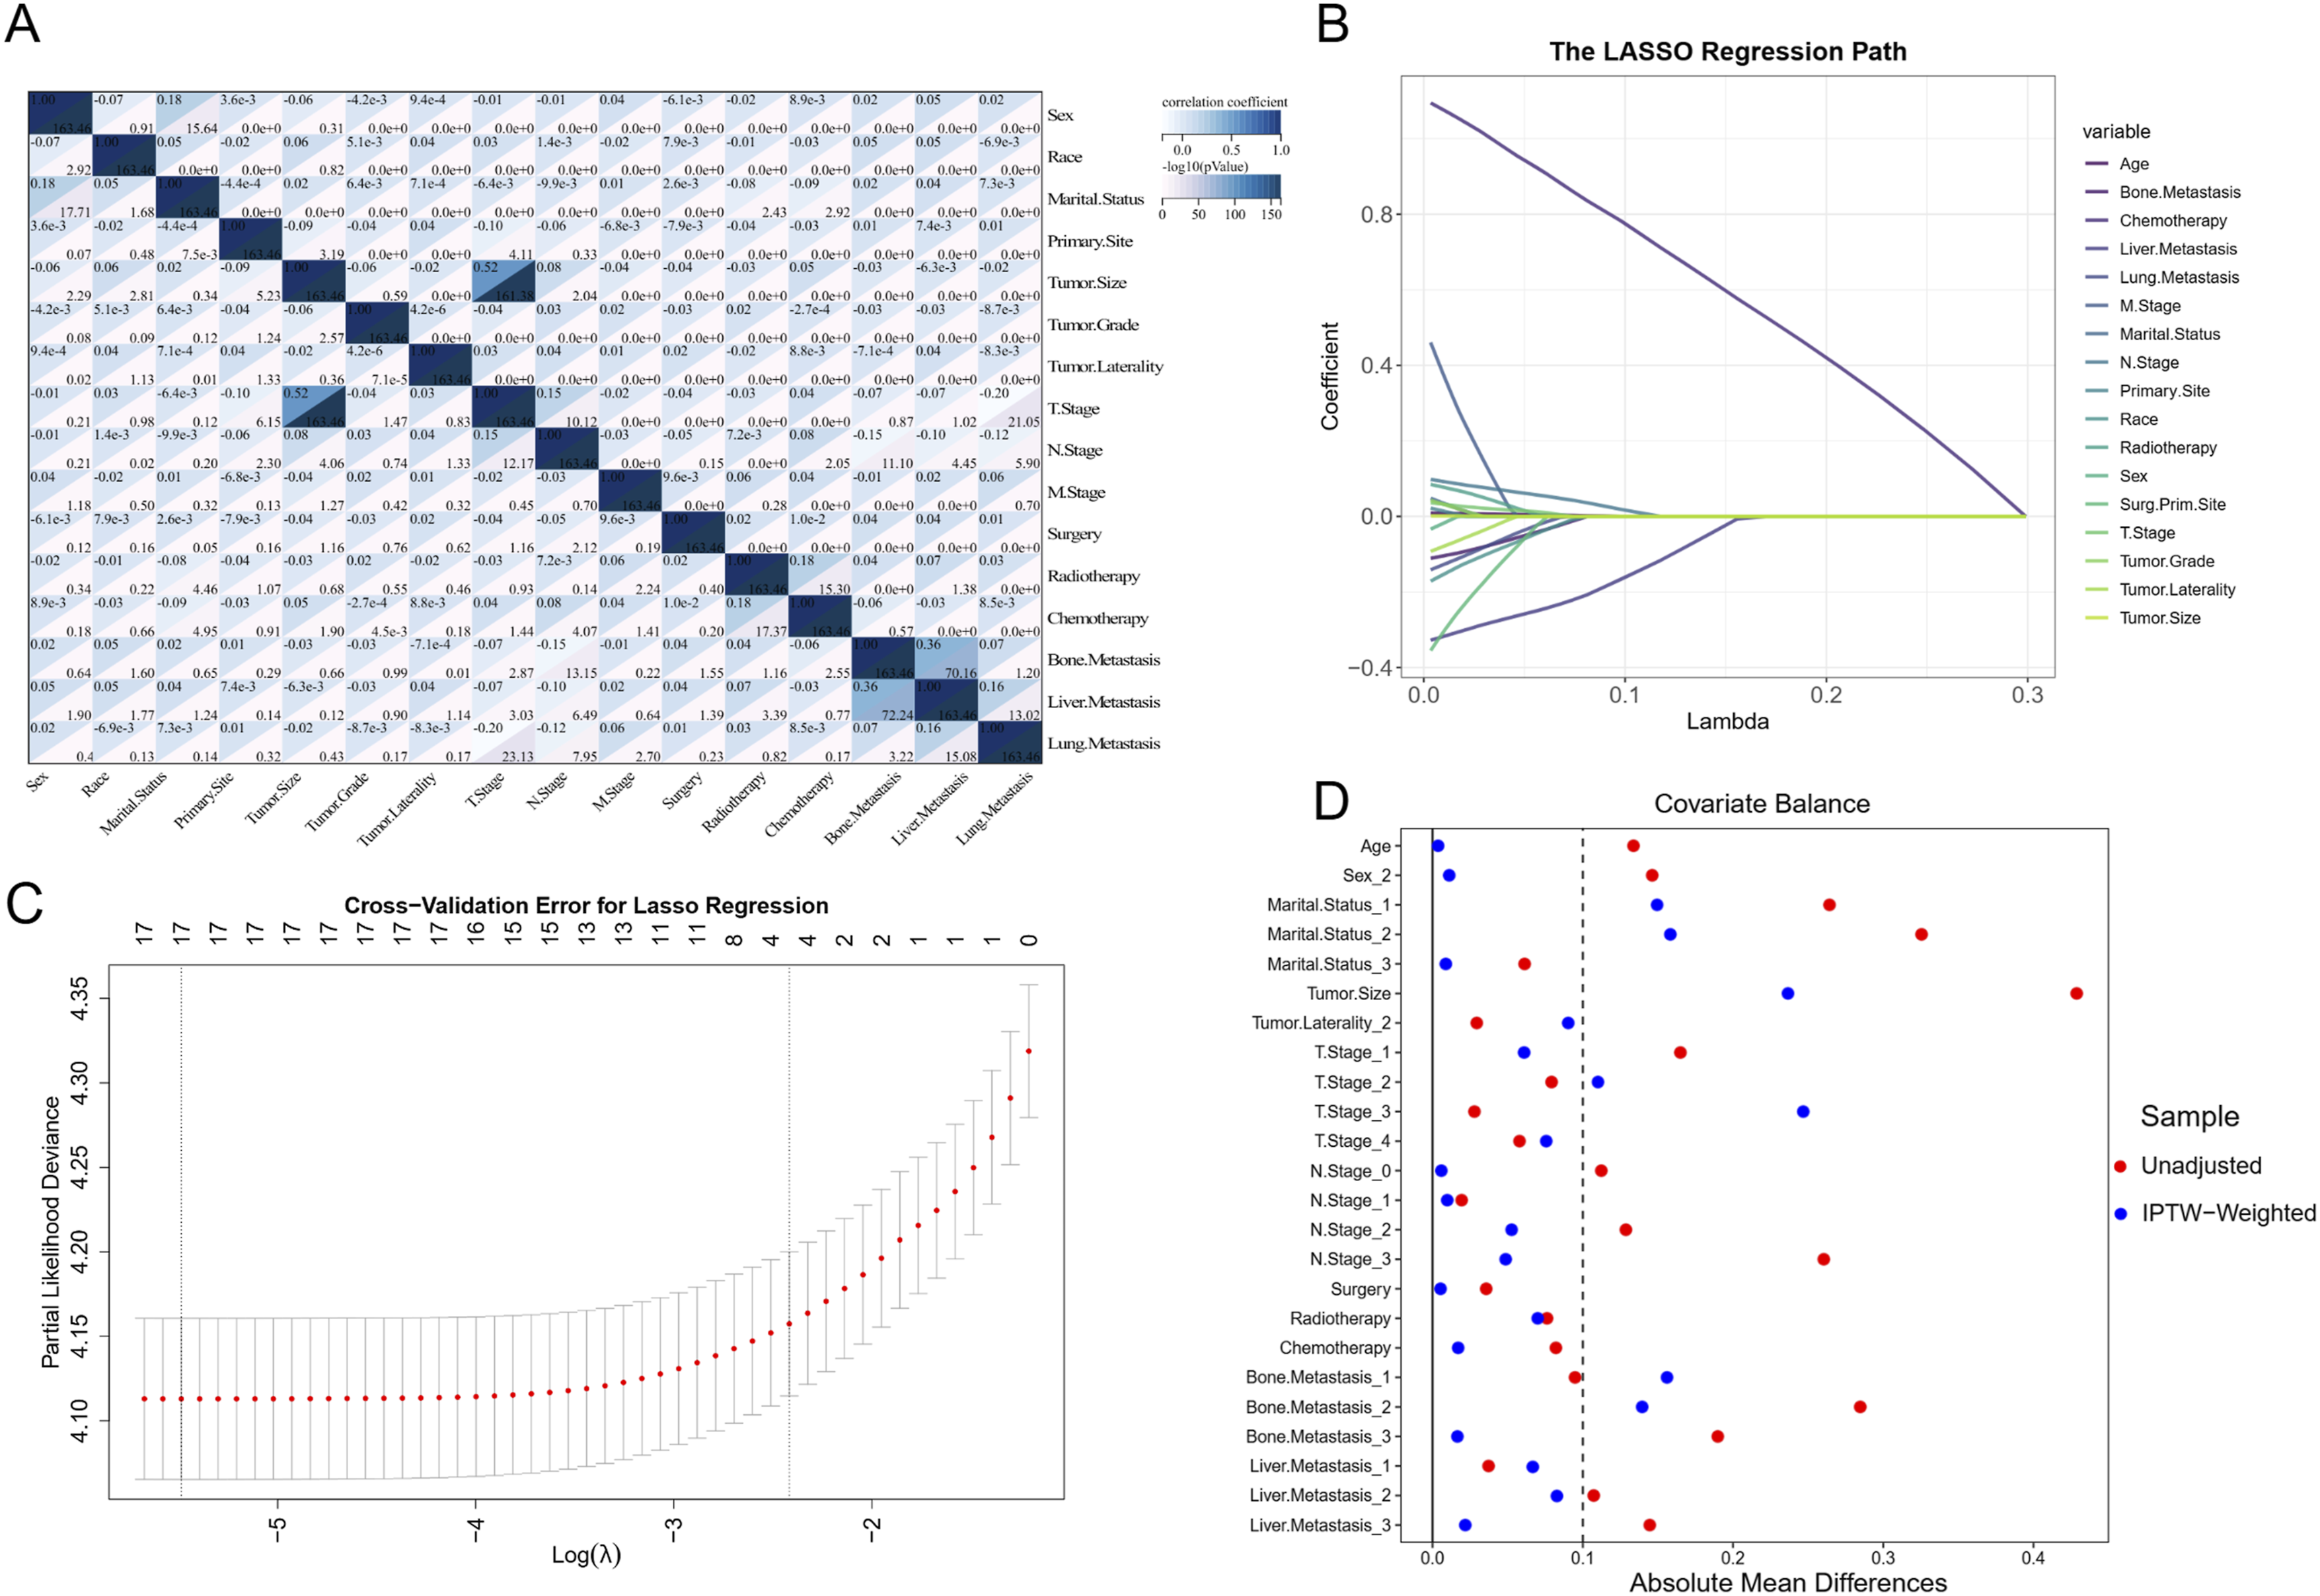
Prognostic Feature Identification and Model Development
This study undertook a comprehensive evaluation of various features, including demographic characteristics, tumor attributes, and treatment modalities, which were incorporated as covariates in a Lasso-Cox regression analysis. As illustrated in Figure 1, the initial Lasso-Cox model identified age, N stage, chemotherapy, and liver metastasis as significant predictors of OS (Panels B and C). Based on these selected features, traditional Cox regression models were constructed for prognostic assessment, alongside the development of an AJCC-based predictive model. To further enhance predictive accuracy, four additional machine learning models were established, aiming to improve the precision and robustness of survival estimation for patients with SCLC. Due to the absence of M1a staging data in the external validation cohort (Table 1), it was not feasible to evaluate the performance of the AJCC staging model in this cohort using standard validation metrics.
Covariate Balance After IPTW
Comparison of Baseline Characteristics Between the SEER Training Cohort and the External Validation Cohort Before and After Stabilized IPTW Adjustment With Robust Variance Estimation

IPTW: Inverse Probability of Treatment Weighting; SMD: Standardized Mean Difference. Bold values indicate prognostic factors and their corresponding results after standardized mean difference (SMD) adjustment.
Following IPTW adjustment, covariate balance improved substantially across most features. Notably, the absolute standardized mean differences (SMDs) for key prognostic factors including age (0.004), N stage (0.134), chemotherapy (0.012), and liver metastasis (0.046) were reduced to levels approaching or well below the conventional threshold of 0.1, indicating excellent balance. These findings demonstrate the effectiveness of IPTW in mitigating confounding bias and achieving robust comparability between the training and validation cohorts.
Benchmarking Predictive Models
Figure 2 illustrates a comparative analysis of the predictive performance of multiple models across both the SEER training and validation cohorts, as well as our institutional validation cohort. Among all models evaluated, the RSF exhibited the highest discriminative ability. In the training cohort, the RSF model achieved time-dependent AUCs of 0.738 (95% CI: 0.708-0.767) for 1-year OS and 0.809 (95% CI: 0.768-0.850) for 2-year OS (Panels 2A and 2B). This strong performance was maintained in the internal validation cohort, with corresponding AUCs of 0.718 (95% CI: 0.671-0.765) and 0.748 (95% CI: 0.670-0.826) for 1- and 2-year OS, respectively (Panels 2C and 2D). In the external validation cohort, the RSF model yielded time-dependent AUCs of 0.686 (95% CI: 0.549-0.822) and 0.802 (95% CI: 0.575-1.029) for 1- and 2-year OS, respectively (Panels 2E and 2F). In contrast, the ANN model demonstrated the weakest predictive performance among the machine learning algorithms, with AUCs of 0.635 (95% CI: 0.599-0.671) for 1-year OS and 0.663 (95% CI: 0.605-0.720) for 2-year OS in the training set. Comparison of ROC curves for 1-year and 2-year OS predictions across the training cohort (Panels A and B), internal validation cohort (Panels C and D), and external validation cohort (Panels E and F)
The traditional Cox proportional hazards model showed moderate predictive accuracy compared to the machine learning approaches. It achieved AUCs of 0.706 (95% CI: 0.674-0.738) and 0.735 (95% CI: 0.682-0.788) for 1- and 2-year OS, respectively, in the training cohort. However, its performance declined in the internal validation cohort, with AUCs of 0.671 (95% CI: 0.616-0.725) for 1-year OS and 0.730 (95% CI: 0.643-0.818) for 2-year OS. In the external validation cohort, the model’s discriminative ability further decreased, yielding AUCs of 0.593 (95% CI: 0.424-0.761) and 0.691 (95% CI: 0.397-0.986) for 1- and 2-year OS, respectively, suggesting potential limitations in its generalizability.
PR curve analysis further confirmed the strong predictive performance of the RSF model, yielding AUPRC values of 0.912 and 0.986 for 1-year and 2-year OS in the training cohort, 0.906 and 0.976 in the internal validation cohort, and 0.860 and 0.990 in the external validation cohort, respectively (Figure 3). Comparison of PR curves for 1-year and 2-year OS predictions in the training cohort (Panels A and B), internal validation cohort (Panels C and D), and external validation cohort (Panels E and F)
Assessment of the Area Under Curve and Brier Score Across the Developed Models

CI: Confidence Interval; NA: Not applicable.

Refined hyperparameter optimization processes for four machine learning models: Random Survival Forest (RSF, Panel A), Extreme Gradient Boosting (XGB, Panel B), Artificial Neural Network (ANN, Panel C), and Elastic Net (Enet, Panel D)
Model Validation via Calibration, Brier Score, and DCA
Figure 5 highlights the superior calibration of the RSF model, with predicted survival probabilities closely aligning with observed outcomes. This indicates excellent agreement and strong model calibration. Further supporting the robustness of the RSF model, Table 3 summarizes its Brier scores across all cohorts. In the training cohort, the RSF model achieved Brier scores of 0.144 and 0.049 for 1-year and 2-year OS predictions, respectively. Comparable results were observed in the internal validation cohort (0.149 for 1-year and 0.057 for 2-year OS), as well as in the external validation cohort (0.195 for 1-year and 0.039 for 2-year OS), demonstrating the model’s strong generalizability and predictive accuracy. Calibration curves comparing predicted vs observed 1-year and 2-year OS probabilities across different cohorts. (Panels A and B) show the training cohort, (Panels C and D) show the internal validation cohort, and Panels E and F show the external validation cohort. The closer the curve is to the diagonal line, the better the model’s calibration, indicating agreement between predicted and actual survival outcomes
Consistently, Figure 6 presents the DCA for both the training and validation cohorts within the SEER dataset. The results demonstrate that the RSF model consistently provides the highest net clinical benefit compared to other machine learning algorithms and the traditional Cox model in predicting OS among patients with SCLC and BM. DCA evaluating the clinical utility of the 1-year and 2-year OS prediction models. (Panels A and B) correspond to the training cohort, (Panels C and D) to the internal validation cohort, and (Panels E and F) to the external validation cohort. The curves illustrate the net benefit of the model across a range of threshold probabilities compared with default strategies of treating all or no patients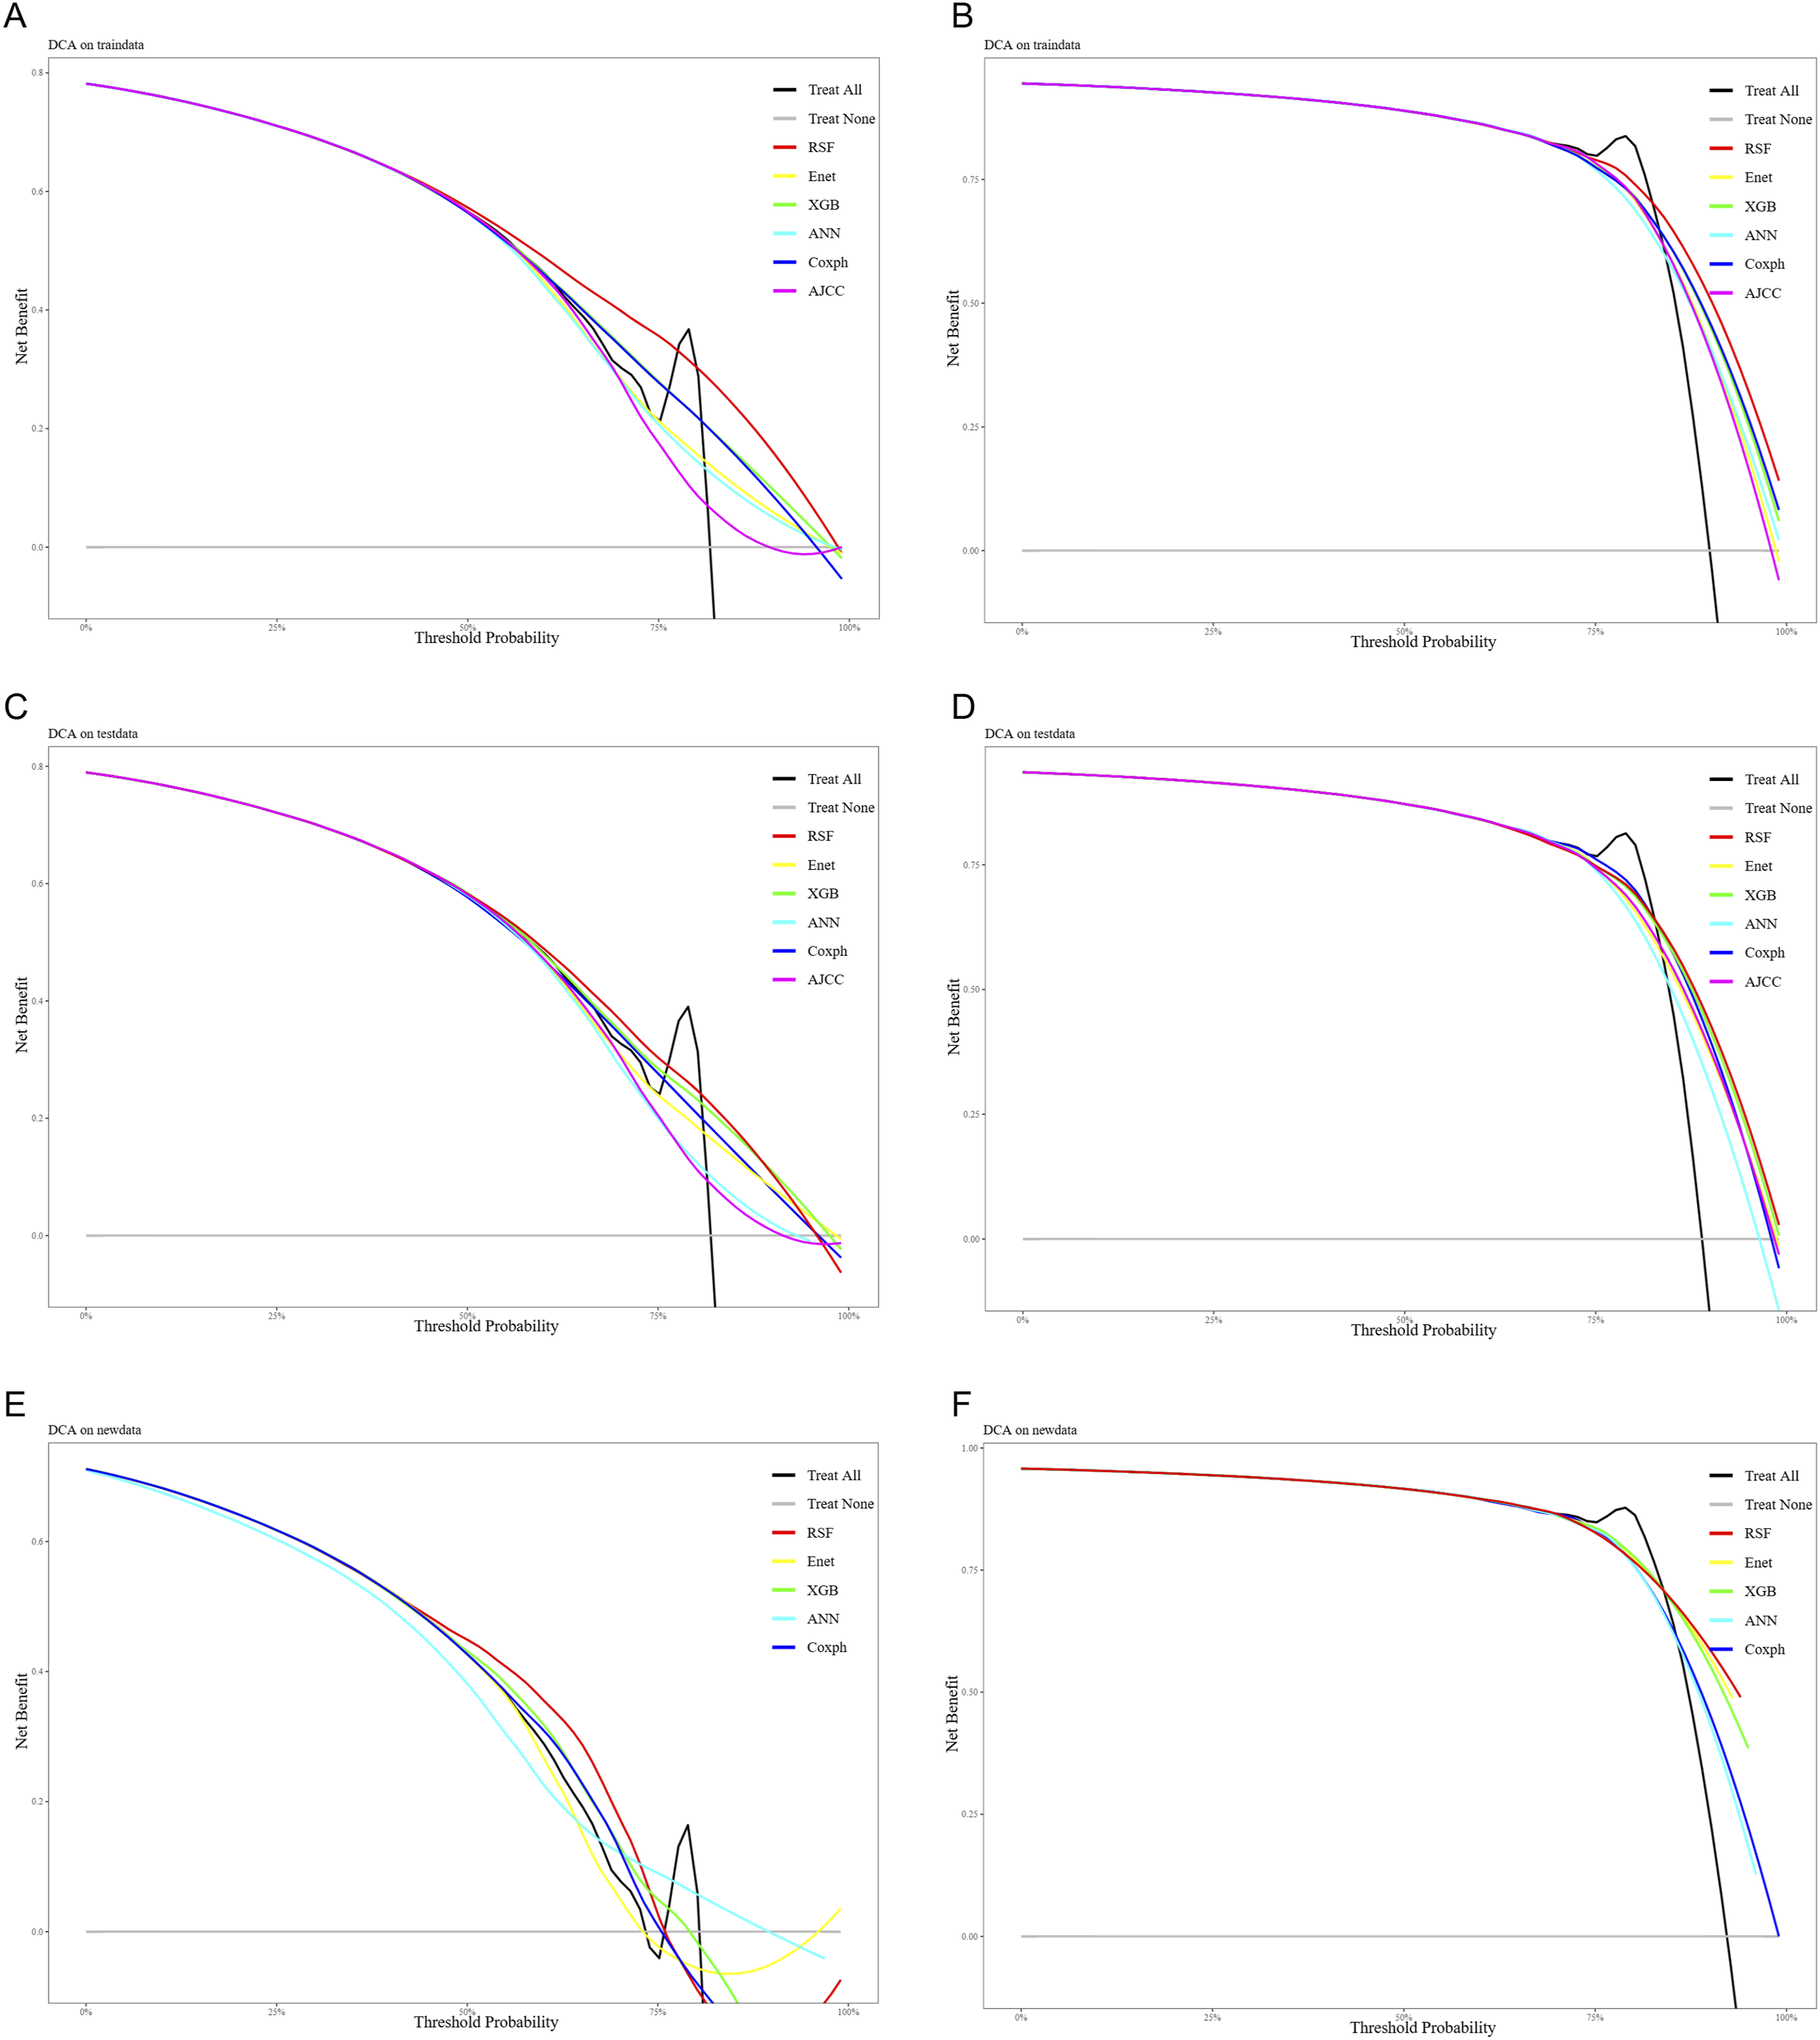
Model Interpretation
Given the RSF model’s strong predictive capability for OS in SCLC patients with BM, SHAP analysis was conducted to evaluate the relative contribution and directional impact of individual features on survival prediction. As illustrated in Figure 7, higher SHAP values represent stronger contributions to the model’s output, with the x-axis reflecting the magnitude and direction of each feature’s effect on survival. Summary of SHAP values for the Random Survival Forest model. The plot shows the relative contribution and impact of each predictor on the model’s survival predictions, with higher absolute SHAP values indicating stronger influence on individual risk estimation
Among the top-ranked features, chemotherapy exhibited the most substantial positive influence on survival, as indicated by a dense cluster of high SHAP values associated with higher feature values (red dots on the right), suggesting that receiving chemotherapy significantly improves prognosis. Liver metastasis showed a strong negative association with survival, as lower SHAP values were more frequently associated with higher feature intensity (red dots on the left), indicating that liver involvement is a detrimental prognostic factor. Age demonstrated a mixed effect, with both low and high feature values scattered across the SHAP spectrum, reflecting its nuanced influence on survival, potentially dependent on comorbidities or treatment tolerance. N stage was also predictive, with advanced nodal involvement (higher N stage, shown in blue) tending to shift SHAP values leftward, indicating worse survival outcomes. Collectively, these results underscore the critical prognostic relevance of systemic therapy, metastatic burden, and nodal stage in shaping survival trajectories for SCLC patients with BM. The SHAP-based interpretability further enhances clinical understanding of model behavior and supports personalized risk stratification.
To gain individualized insights into the RSF model’s predictions, a SHAP-based breakdown analysis was performed for a representative patient in the cohort (Figure 8). At both the 1-year and 2-year time points, the patient’s N2 nodal stage exerted a negative influence on survival probability, with SHAP values of 0.0363 and 0.0249 respectively, indicating an elevated risk. Prediction analysis based on the first patient in the cohort using the Random Survival Forest model, illustrating the individual contribution of clinical features to OS prediction
However, several favorable clinical factors collectively mitigated this risk. At 1 year, the strongest positive contributors included receipt of chemotherapy (0.0501), absence of liver metastasis (0.0437), and relatively young age (64 years) (0.0123). A similar pattern was observed at 2 years, with age, absence of liver metastasis, and chemotherapy continuing to provide additive survival benefits. These findings highlight how even in the presence of adverse features such as advanced nodal involvement, the cumulative effect of beneficial treatments and lack of metastasis can shift the survival prediction favorably. This demonstrates the RSF model’s capacity for nuanced and individualized risk stratification.
Figure 9 displays partial dependence survival profiles derived from the RSF model, demonstrating the impact of key clinical features on OS at 1-year and 2-year time points. Patients who received chemotherapy showed significantly improved survival probabilities compared to those who did not, reinforcing the therapeutic benefit of systemic treatment. The absence of liver metastasis was also associated with better survival outcomes, while the presence of liver involvement markedly decreased survival likelihood. Partial dependence profiles illustrating the influence of key categorical and continuous features on the predictive performance of the model for OS
Nodal stage had a clear inverse relationship with survival. As N stage progressed from N0 to N3, survival probabilities declined steadily, highlighting the prognostic significance of nodal burden. Age demonstrated a nonlinear effect on survival, with younger patients generally showing higher survival probabilities. However, fluctuations across age intervals suggest potential interactions with other clinical features or treatment patterns. Collectively, these partial dependence plots emphasize the importance of chemotherapy, liver metastasis status, nodal involvement, and age in shaping individualized survival trajectories for patients with SCLC and BM.
Establishment of a Web-Deployed Predictive Analytics System
Building upon the robust RSF model, this study developed a web-based application to support individualized prediction of OS based on patient-specific data. The platform is designed for ease of use and provides an intuitive, automated framework for model deployment, training, and evaluation, making it accessible to researchers without advanced machine learning expertise. As shown in Supplement Figure 2, the user-friendly interface enhances usability and facilitates practical implementation. The application is freely available at: https://prognostic-model-for-sclc-with-bm.shinyapps.io/machinelearning/.
Discussion
This study analyzed 2392 SCLC patients with BM to develop a robust prognostic model. Among the various approaches evaluated, the RSF algorithm outperformed both traditional methods, including Cox regression and AJCC staging, as well as other machine learning models in terms of discrimination, calibration, and clinical utility based on DCA. SHAP analysis identified chemotherapy, age, N stage, and liver metastasis as the most influential prognostic factors. Building upon the optimized RSF model, we developed an interactive web-based tool that provides individualized risk assessments to support clinical decision making and personalized patient care. This study presents a novel application of machine learning in prognostic evaluation for SCLC patients with BM and advances the integration of computational intelligence into clinical oncology.
Numerous studies have investigated the prognostic factors in SCLC patients with BM.13–17 For instance, Shan et al 1 13 retrospectively analyzed 3522 SCLC patients with BM and identified age, race, sex, T stage, N stage, and marital status as independent prognostic factors for OS. However, the nomogram they developed yielded modest discriminatory power, with AUC values of 0.606 and 0.715 for 1-year and 3-year OS prediction, respectively. Similarly, the study by Munai et al 1 14 focused on predicting the occurrence of BM in SCLC patients and identified the top ten predictive features, including bone metastasis, liver metastasis, radiotherapy, age, tumor size, primary tumor location, N stage, race, T stage, and chemotherapy. While the model achieved relatively high AUCs of 0.896 and 0.810 in the training and test cohorts, respectively, it included all available baseline features without a rigorous feature selection process. This lack of refinement could have led to overfitting and an overestimation of the model’s predictive performance. In another study, Que et al 1 15 evaluated the combined efficacy and safety of brain radiotherapy (BRT), chemotherapy, and immune checkpoint inhibitors (ICIs) in patients with extensive-stage SCLC and BM. Their multivariate analysis revealed that OS was influenced by treatment regimen, the number of chemotherapy and ICI cycles, presence of bone and multiple BM, use of antiangiogenic therapies, and extracranial radiotherapy. However, due to the limited sample size of only 187 patients, a prognostic model was not constructed. A similar limitation was observed in the study by Chaung et al, 1 16 where the small sample size of 107 patients hindered the development of a reliable prognostic model.
Collectively, while prior studies have provided insights into prognostic factors for SCLC patients with BM, many have been constrained by limited sample sizes or suboptimal model performance. Addressing this gap, our study presents a robust prognostic model specifically tailored for this population. By utilizing a large, population-based dataset with broad geographic representation and applying advanced machine learning techniques, we developed and externally validated a predictive model using a distinct cohort from our institution. The model demonstrated commendable predictive performance and offers a practical tool for enhancing the accuracy of mortality predictions, supporting its potential for broader clinical application in prognostic assessment and individualized treatment planning.
The prognostic features identified through Lasso regression were largely consistent with previous findings.17–19 Notably, in contrast to earlier studies emphasizing the critical role of brain radiotherapy in SCLC patients with BM, our analysis did not identify radiotherapy as an independent prognostic factor. This discrepancy may stem from the limitations of the SEER treatment records, where radiotherapy data are captured only as a binary variable (yes or no/unknown), without specifying treatment sites or modalities. As a result, the absence of detailed radiotherapy information may have influenced the model’s ability to fully capture its prognostic value. It is important to acknowledge that the lack of this key feature could have had some impact on the overall predictive performance of the model.
Although IPTW markedly improved baseline balance across most covariates, a slight residual imbalance remained for N stage (SMD = 0.134), exceeding the commonly accepted threshold of 0.1. This suggests that nodal status may not have been fully comparable between weighted groups and could still confound outcome estimates. Given that N stage is a well-established prognostic factor in SCLC, even a modest imbalance may influence survival interpretation. Nevertheless, the magnitude of deviation was small, and the overall covariance structure remained substantially improved after weighting. Future studies with more granular nodal information, alternative weighting strategies, or additional sensitivity analyses are warranted to further mitigate this imbalance and confirm the robustness of our findings.
SHAP analysis identified chemotherapy as the most influential positive predictor of OS in SCLC patients with BM. The consistent association between chemotherapy receipt and higher SHAP values reinforces the central therapeutic role of systemic treatment in this population. In contrast, liver metastasis emerged as a dominant negative prognostic factor, with strong inverse contributions to survival prediction. This finding aligns with prior clinical knowledge regarding the detrimental impact of hepatic involvement in SCLC. 18 Age showed a complex, nonlinear relationship with survival, potentially reflecting differential treatment tolerance or competing comorbidities. Additionally, N stage exhibited a gradient effect, with more advanced nodal involvement associated with worse prognosis, emphasizing its continued relevance in risk stratification.
Further individual-level analysis via SHAP-based breakdowns illustrated how adverse prognostic factors, such as N2 disease, may be offset by favorable features like chemotherapy, absence of liver metastasis, and younger age. These case-level visualizations demonstrated the RSF model’s capability to capture nuanced, patient-specific interactions and support personalized survival assessments.
Partial dependence analysis corroborated these findings at a population level. Chemotherapy consistently conferred substantial survival benefit, while liver metastasis and higher N stage were associated with reduced survival probabilities. The age-related effect exhibited nonlinearity, again suggesting interaction with other clinical characteristics. Together, these interpretability findings underscore the importance of both treatment-related and biological factors in shaping survival outcomes.
By integrating interpretability tools within a high-performing predictive framework, our study not only improves prognostic accuracy but also facilitates clinical trust, informed decision-making, and individualized care planning. The ability to dissect model behavior and quantify feature impact at both cohort and patient levels enhances the clinical relevance and translational value of the proposed RSF model.
To ensure the robustness and generalizability of the RSF model, 10-fold cross-validation was employed, effectively mitigating the risk of overfitting and supporting its applicability across diverse patient populations. Calibration plots demonstrated excellent agreement between predicted and observed survival probabilities, indicating the model’s reliability in risk estimation. Furthermore, the RSF model achieved the lowest Brier score among all models evaluated, reflecting superior overall predictive accuracy. To contextualize the statistical improvements of the RSF model, we evaluated its clinical utility using DCA. The RSF model demonstrated higher net benefit across a range of clinically relevant risk thresholds compared with alternative models, indicating that it can more accurately identify patients at high risk while minimizing unnecessary interventions for low-risk patients. These findings suggest that the improved discrimination (AUC and AUPRC) of the RSF model translates into meaningful gains in patient-level decision-making, supporting its potential use in guiding individualized treatment planning and follow-up strategies. However, because SCLC treatment is often dynamic, this model is intended for early risk stratification rather than continuous survival prediction. Future studies incorporating longitudinal treatment data and dynamic modeling approaches are warranted to enhance predictive performance over the course of therapy.
Although multiple machine learning algorithms were evaluated, the RSF model consistently demonstrated the best and most stable performance, while ANN and XGB showed relatively lower predictive accuracy. This difference may be attributed to several factors. First, survival outcomes involve censored data, and RSF is inherently designed to handle right-censoring and time-to-event distributions, enabling it to capture complex interactions and nonlinear relationships without relying on proportional hazards assumptions. In contrast, ANN models, while capable of modeling nonlinear patterns, are highly sensitive to dataset characteristics. In this study, moderate sample size, limited treatment granularity, and lack of detailed longitudinal data likely reduced ANN stability and increased variance. Additionally, adapting ANN to censored survival data typically requires larger datasets and extensive hyperparameter tuning, which may explain its relatively lower performance. Similarly, XGB depends on comprehensive and granular clinical features to optimize gradient boosting, and the moderate sample size and limited treatment detail in our dataset may have constrained its learning efficiency. Overall, RSF demonstrated superior robustness and generalizability across internal and external validation cohorts, suggesting that tree-based ensemble survival models may be particularly well-suited for prognostic prediction in SCLC patients with BM.
Despite its strengths, this study has several limitations that warrant consideration. First, the retrospective nature of the analysis may introduce selection bias, and the SEER database lacks detailed clinical information such as Eastern Cooperative Oncology Group (ECOG) performance status, molecular alterations, smoking history, and comorbid conditions—factors known to influence prognosis. Additionally, the absence of data on immunotherapy, targeted therapies, and detailed radio-chemotherapy information limits the ability to account for treatment heterogeneity and introduces the potential for residual confounding. The database also does not capture longitudinal data such as treatment interruptions, disease recurrence, or subsequent lines of therapy, all of which may dynamically affect survival outcomes. We used complete-case analysis due to non-random missing patterns, which made multiple imputation inappropriate; however, excluding incomplete records may introduce selection bias.
Although calibration curves and Brier scores indicate good overall model performance, these global metrics may not fully capture variability in predictive accuracy across specific patient subgroups. Patients with rare clinical characteristics, unusual metastatic patterns, or non-standard treatment histories may be underrepresented, and aggregated performance indices could mask reduced accuracy in these populations. Therefore, caution is warranted when applying the model to small or atypical subgroups. Future studies using larger, multi-center, and ethnically diverse cohorts, alongside subgroup-specific validation and complementary performance assessments, will be essential to further evaluate and refine the model’s reliability across diverse clinical scenarios.
Conclusions
This study developed a robust and interpretable RSF-based model for predicting OS in SCLC patients with BM. The model outperformed traditional methods, identified key prognostic features, and was implemented as a web-based tool for individualized risk assessment. Importantly, it is intended as a supportive clinical tool to assist clinicians in prognostic evaluation and treatment planning, rather than a standalone decision-making system, highlighting its role in complementing clinical judgment.
Supplemental Material
Supplemental Material - Interpretable Machine Learning for Survival Prediction in Small Cell Lung Cancer Patients With Brain Metastases: A Population-Based Study With External Validation
Supplemental Material for Interpretable Machine Learning for Survival Prediction in Small Cell Lung Cancer Patients With Brain Metastases: A Population-Based Study With External Validation by Ning Luo, Shifan Tan, Xiaocai Li, Si Liu, Shangyu Xie, Xiaoying Huang, Dong Wu in Cancer Control.
Footnotes
Acknowledgments
The authors extend their gratitude to Dr Min Liang for his invaluable support in coordinating and validating the development of the machine learning techniques.
Ethical Considerations
This study utilized data from both public sources and a hospital-based external validation cohort. The publicly available data were fully anonymized, and the use of these data does not require additional ethical approval. The external validation cohort was derived from Maoming people’s hospital, and the study protocol was reviewed and approved by the ethics committee of Maoming people’s hospital (Approval No. PJ2025MI-K078-01, August 4, 2025).
Consent to Participate
Given the retrospective nature of the analysis and the use of de-identified data, the requirement for informed consent was waived by the ethics committee. All methods were conducted in accordance with relevant guidelines and regulations.
Author Contributions
Dong Wu: Conceptualization (lead); writing – review and editing (supporting). Ning Luo: Data curation (lead); formal analysis (lead); writing – original draft (lead); writing – review and editing (equal). Shifan Tan, Xiaocai Li, and Si Liu: Data curation (supporting); writing – review and editing (supporting); formal analysis (equal); Shangyu Xie and Xiaoying Huang: Conceptualization (equal); writing – review and editing (supporting).
Funding
The authors received no financial support for the research, authorship, and/or publication of this article.
Declaration of Conflicting Interests
The authors declared no potential conflicts of interest with respect to the research, authorship, and/or publication of this article.
Data Availability Statement
Supplemental Material
Supplemental material for this article is available online.
Appendix
References
Supplementary Material
Please find the following supplemental material available below.
For Open Access articles published under a Creative Commons License, all supplemental material carries the same license as the article it is associated with.
For non-Open Access articles published, all supplemental material carries a non-exclusive license, and permission requests for re-use of supplemental material or any part of supplemental material shall be sent directly to the copyright owner as specified in the copyright notice associated with the article.