
Abstract
Purpose
Metastatic pulmonary large cell neuroendocrine carcinoma (LCNEC) is an aggressive cancer with generally poor outcomes. Effective methods for predicting survival in patients with metastatic LCNEC are needed. This study aimed to identify independent survival predictors and develop nomograms for predicting survival in patients with metastatic LCNEC.
Patients and Methods
We conducted a retrospective analysis using the Surveillance, Epidemiology, and End Results (SEER) database, identifying patients with metastatic LCNEC diagnosed between 2010 and 2017. To find independent predictors of cancer-specific survival (CSS), we performed Cox regression analysis. A nomogram was developed to predict the 6-, 12-, and 18-month CSS rates of patients with metastatic LCNEC. The concordance index (C-index), area under the receiver operating characteristic (ROC) curves (AUC), and calibration curves were adopted with the aim of assessing whether the model can be discriminative and reliable. Decision curve analyses (DCAs) were used to assess the model’s utility and benefits from a clinical perspective.
Results
This study enrolled a total of 616 patients, of whom 432 were allocated to the training cohort and 184 to the validation cohort. Age, T staging, N staging, metastatic sites, radiotherapy, and chemotherapy were identified as independent prognostic factors for patients with metastatic LCNEC based on multivariable Cox regression analysis results. The nomogram showed strong performance with C-index values of 0.733 and 0.728 for the training and validation cohorts, respectively. ROC curves indicated good predictive performance of the model, with AUC values of 0.796, 0.735, and 0.736 for predicting the 6-, 12-, and 18-month CSS rates of patients with metastatic LCNEC in the training cohort, and 0.795, 0.801, and 0.780 in the validation cohort, respectively. Calibration curves and DCAs confirmed the nomogram’s reliability and clinical utility.
Conclusion
The new nomogram was developed for predicting CSS in patients with metastatic LCNEC, providing personalized risk evaluation and aiding clinical decision-making.
Introduction
Pulmonary large cell neuroendocrine carcinoma (LCNEC) has been confirmed as a rare and aggressive malignant tumor, taking up approximately 3% of primary lung cancers.1,2 Initially introduced in 1991, this particular subtype of large cell lung cancer was subsequently incorporated into the World Health Organization’s (WHO) classification criteria. 3 It underwent a reclassification process in 2015, resulting in its upgrade to a high-grade neuroendocrine tumor. Together with small cell lung cancer (SCLC), it was subsequently classified as a neuroendocrine tumor of the lung (L-NENs). 4 LCNEC primarily affects elderly males, with a median age of 65 years, and is often associated with a significant history of heavy smoking. The pathological features of LCNEC include large cells with abundant cytoplasm and a high mitotic rate. Immunohistochemical markers are positive for CgA, Syn, and CD56. 5 LCNEC exhibits significantly aggressive behavior, characterized by high rates of lymph node and distant metastases (60%-80% and 40%, respectively). 6 The survival time of such patients is merely a few months, similar to SCLC.7–9 Additionally, 40%-70% of LCNEC cases are initially diagnosed at stage III-IV,1,10 and the 5-year overall survival (OS) rate for these patients is nearly zero. 11 In recent years, the incidence of LCNEC has been increasing due to growing awareness and recognition of the disease. As revealed by recent reports, its incidence has displayed a stable rising trend, from 0.01/100,000 to 1.8/100,000 people within a time scope between 1990 and 2010. Furthermore, its annual mortality rate has doubled between 2004 and 2015. 12 In 2021, the WHO classified LCNEC into pure LCNEC and combined large cell neuroendocrine carcinoma of the lung (C-LCNEC), with the latter mixed with components of adenocarcinoma, squamous cell carcinoma, or other rare subtypes such as spindle cell carcinoma or giant cell carcinoma.13,14 Treatment approaches for this tumor have been extensively debated, yet there remains no established standard management, particularly for advanced stages, as its rarity leads to limited participation in clinical trials. Immune checkpoint inhibitors and molecular targeted therapies have transformed treatment options for non-small cell lung cancer (NSCLC) patients. However, chemotherapy remains the mainstay for LCNEC. The optimal chemotherapy regimen is still debated, with SCLC-like chemotherapy possibly being a better choice, although the overall survival benefit is poor, ranging from approximately 8 to 16 months in various case series studies. 2 However, metastatic LCNEC refers to a heterogeneous disease with distinct prognoses. Existing research has identified independent risk factors for LCNEC prognosis, comprising chemotherapy, surgical treatment, TNM phase, primary tumor site, age, and sex.15–18 Accordingly, a more refined method for predicting individualized survival of metastatic LCNEC patients should be urgently developed. While the TNM staging system is a widely accepted tool for predicting patient prognosis, it has inherent limitations as it only considers a limited range of factors and fails to account for patient-specific conditions such as pathology, genotype, and treatment. 19 Thus, it is still challenging to precisely predict individual prognoses for metastatic LCNEC using the above-described method.
Nomograms have been reported as useful prognostic tools that are capable of incorporating clinical and pathological risk factors while effectively quantifying the impact of the above-mentioned variables on the prediction of the survival of individual patients. 19 Several studies have focused on identifying prognostic factors and developing predictive models for LCNEC.20–22 Age, T stage, N stage, chemotherapy, and multiple metastases are considered independent prognostic factors for advanced LCNEC patients. In this study, we developed more comprehensive models using independent prognostic factors to more accurately predict cancer-specific survival (CSS) in patients suffering from metastatic LCNEC. The above-mentioned models can assist clinicians in determining personalized treatment strategies.
Materials and methods
Study Design and Data Source
We collected data on patients diagnosed with LCNEC confirmed by pathology from the SEER database for the period from 2010 to 2017. Data extraction was performed using SEER*Stat software (Version: 8.3.9.1, https://seer.cancer.gov/data/), administered by the National Cancer Institute. All data from SEER are publicly accessible and de-identified, thus informed consent is not required. The reporting of this study conforms to TRIPOD guidelines. 23
Study Population
According to the seventh edition TNM staging criteria of the American Joint Committee on Cancer (AJCC), all cases were classified as stage IV. The inclusion criteria are presented as follows: (1) The histopathological diagnosis was large cell neuroendocrine carcinoma, with a histological code of 8013/3 in the International Classification of Diseases for Oncology, Third Edition (ICD-O-3); (2) stage IV patients. The exclusion criteria included: (1) unspecified TNM staging; (2) incomplete information on distant metastasis; (3) missing survival information; (4) multiple primary tumors. The screening process is illustrated in Figure 1. The flow diagram of eligible patients in this research. LCNEC, large cell neuroendocrine carcinoma.
Outcome Measure
The present study was designed to track patients from the date of LCNEC diagnosis until either death from cancer or the date of their last follow-up assessment, with this time interval defined as the CSS endpoint.
Study Variables
Patient information was collected using the SEER*Stat software, including demographic data such as age at diagnosis, gender (male or female), race (white, black, or other), and marital status (married or unmarried). Tumor-related data included primary site (main bronchus, upper lobe, middle lobe, or lower lobe), histologic grade (I, II, III, IV, or unknown), laterality (left or right), T staging (T1, T2, T3, or T4), N staging (N0, N1, N2, or N3), and sites of metastasis (lung, liver, bone, brain, or multiple organs). Treatment data included whether the primary site was surgically removed, whether chemotherapy was received, and whether radiotherapy was administered. The initial metastatic sites were recorded as single or multiple and classified as lung-only, liver-only, bone-only, brain-only, or multiple metastases (involving more than 1 of the aforementioned distant metastatic sites).
Construction and Validation of the Nomogram
To establish and validate the predictive nomogram, untreated patients were randomly divided into training and validation sets in a 7:3 ratio. Factors with P < 0.05 in multivariate Cox regression analysis were utilized to construct nomograms for predicting survival outcomes. With the aim of assessing the nomogram’s performance, calibration and discrimination were examined. After the C‐index was determined with a 95% confidence interval (CI), the model’s discriminability was examined. 24 Additionally, with the aim of appraising the model’s prediction efficiency, we adopted the area under the receiver operating characteristic (ROC) curves (AUC). A larger area can indicate a higher prediction accuracy. Calibration curves were generated using a bootstrapped resample with 1000 iterations, and a perfect model with strong concordance between the practical and predicted survival can be indicated by a calibration plot complying with the 45-degree line. Furthermore, after the net benefit at distinct threshold probabilities are quantified, the model’s clinical value was assessed through decision curve analyses (DCAs). 25
Statistical Analysis
On the basis of the chi-square test, differences between groups were assessed. With the use of the Kaplan-Meier approach, the survival analysis was conducted. GraphPad Prism 8.0 software was utilized to draw survival curves to compare the survival status of different metastasis sites. Cox regression analysis was employed to screen for factors related to the survival of metastatic LCNEC patients. With the use of SPSS Statistics software 25.0 and R language software 4.1.3, the statistical analysis was completed, with a P-value lower than 0.05 indicated a difference with statistical significance.
Results
Clinicopathological Characteristics
Clinicopathological Characteristics of Patients in This Research.

Survival Analysis
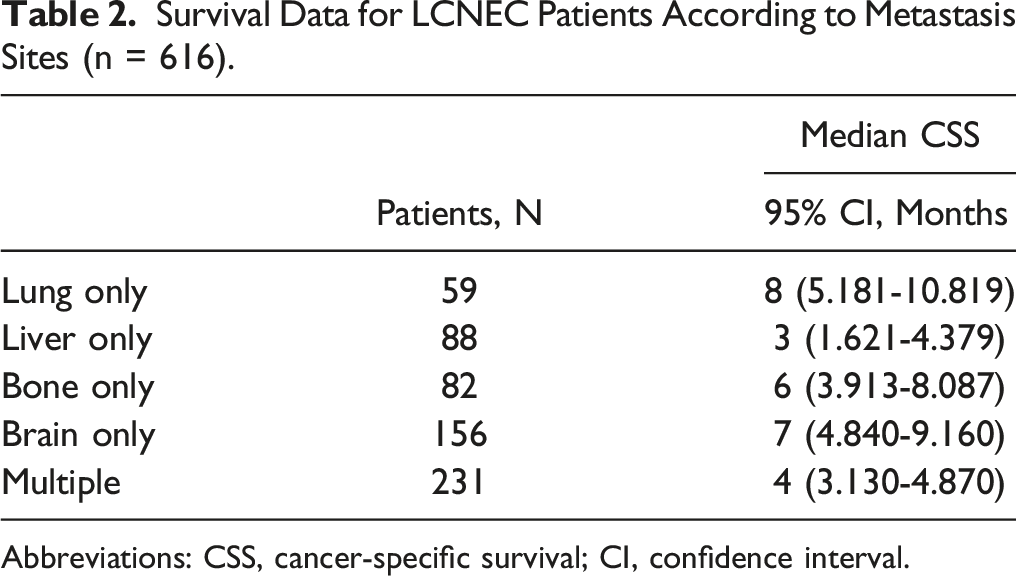
The median survival time for the entire population was 5 months (IQR, 2-11). As revealed by the analysis of different metastatic sites, patients with liver metastases only achieved the worst CSS, followed by patients with multiple metastases. In contrast, patients with lung metastases only exhibited better CSS compared with those with metastases in other sites (Figure 2). Thus, LCNEC patients with liver metastases only and multiple metastases tended to have unfavorable outcomes. Table 2 lists the detailed outcomes of the median survival. Kaplan-Meier curves of CSS for LCNEC patients according to metastasis sites. The curves illustrate the survival differences based on different metastatic sites. CSS, cancer-specific survival; LCNEC, large cell neuroendocrine carcinoma. Survival Data for LCNEC Patients According to Metastasis Sites (n = 616). Abbreviations: CSS, cancer-specific survival; CI, confidence interval.
Prognostic Factors for Patients with Metastatic Large Cell Neuroendocrine Carcinoma
Univariate and Multivariate Cox Analyses of CSS in the Training Cohort.

Abbreviations: HR, hazard ratio; CI, confidence interval; CSS, cancer-specific survival.
Nomogram Construction and Validation
To facilitate the direct and simplified application of the multivariate Cox regression analysis results for accurate survival prediction, this study developed nomograms to predict the 6-, 12-, and 18-month CSS rates in metastatic LCNEC patients (Figure 3). The nomogram is constructed by adding up the individual scores of each variable, and projecting the total score vertically to obtain the predicted values of 6-month, 12-month, and 18-month CSS in metastatic LCNEC patients. Chemotherapy and metastasis site had the greatest impact on prognosis, as evidenced by the largest range of risk scores. In the training cohort, the C-index of the model was 0.733 (95% CI: 0.708-0.758), while the C-index was 0.728 (95% CI: 0.687-0.769) in the validation cohort. Calibration curves demonstrated strong agreement between observed and predicted probabilities (Figure 4(A)–(F)). As shown in Figure 5(A)–(F), ROC curves indicated good predictive performance of the model, with AUC values of 0.796, 0.735, and 0.736 for predicting the 6-, 12-, and 18-month CSS rates of patients with metastatic LCNEC in the training cohort, and AUC values of 0.795, 0.801, and 0.780 for predicting the 6-, 12-, and 18-month CSS rates in the validation cohort. In addition, the DCA curves showed excellent clinical benefits and utility of the novel nomogram (Figure 6(A)–(F)). The nomogram for predicting 6‐, 12‐ and 18‐month CSS rates in patients with metastatic LCNEC. The nomogram provides a visual representation of the predicted survival probabilities. CSS, cancer-specific survival; LCNEC, large cell neuroendocrine carcinoma. The calibration curves of 6-month (A), 12-month (B), and 18-month (C) cancer-specific survival (CSS) rates in the training cohort and 6-month (D), 12-month (E), and 18-month (F) CSS rates in the validation cohort. The calibration curves were measured by bootstrapping for 1000 repetitions. The x-axis is the predicted probability of the nomogram, and the y-axis is the observed probability. The receiver operating characteristic curves for predicting 6-month (A), 12-month (B), and 18-month (C) cancer‐specific survival (CSS) rates in the training cohort and 6-month (D), 12-month (E), and 18-month (F) CSS rates in the validation cohort. The curves evaluate the performance of the predictive model, with the area under the curve (AUC) indicating the model’s discriminatory ability. Decision curve analyses for predicting 6-month (A), 12-month (B), and 18-month (C) cancer‐specific survival (CSS) rates in the training cohort and 6-month (D), 12-month (E), and 18-month (F) CSS rates in the validation cohort. The curves illustrate the clinical usefulness of the predictive model by comparing net benefits at different threshold probabilities.


Risk Stratification System
The final stage involved assigning a risk score and developing a risk classification for each patient based on the six characteristics of the nomogram. Based on the total points calculated by the nomogram, we divided patients into high-risk and low-risk groups using the median risk score as the cutoff. According to Kaplan-Meier curve analysis, there were significant differences between high-risk and low-risk patients in the training group and validation group, respectively (Figure 7(A)–(B)). The CSS of low-risk patients were significantly higher. Kaplan-Meier curves for high-risk and low-risk groups in the training cohort (A) and validation cohort (B), based on the nomogram-derived risk scores. The curves compare survival outcomes between high-risk and low-risk groups, demonstrating the stratification ability of the nomogram.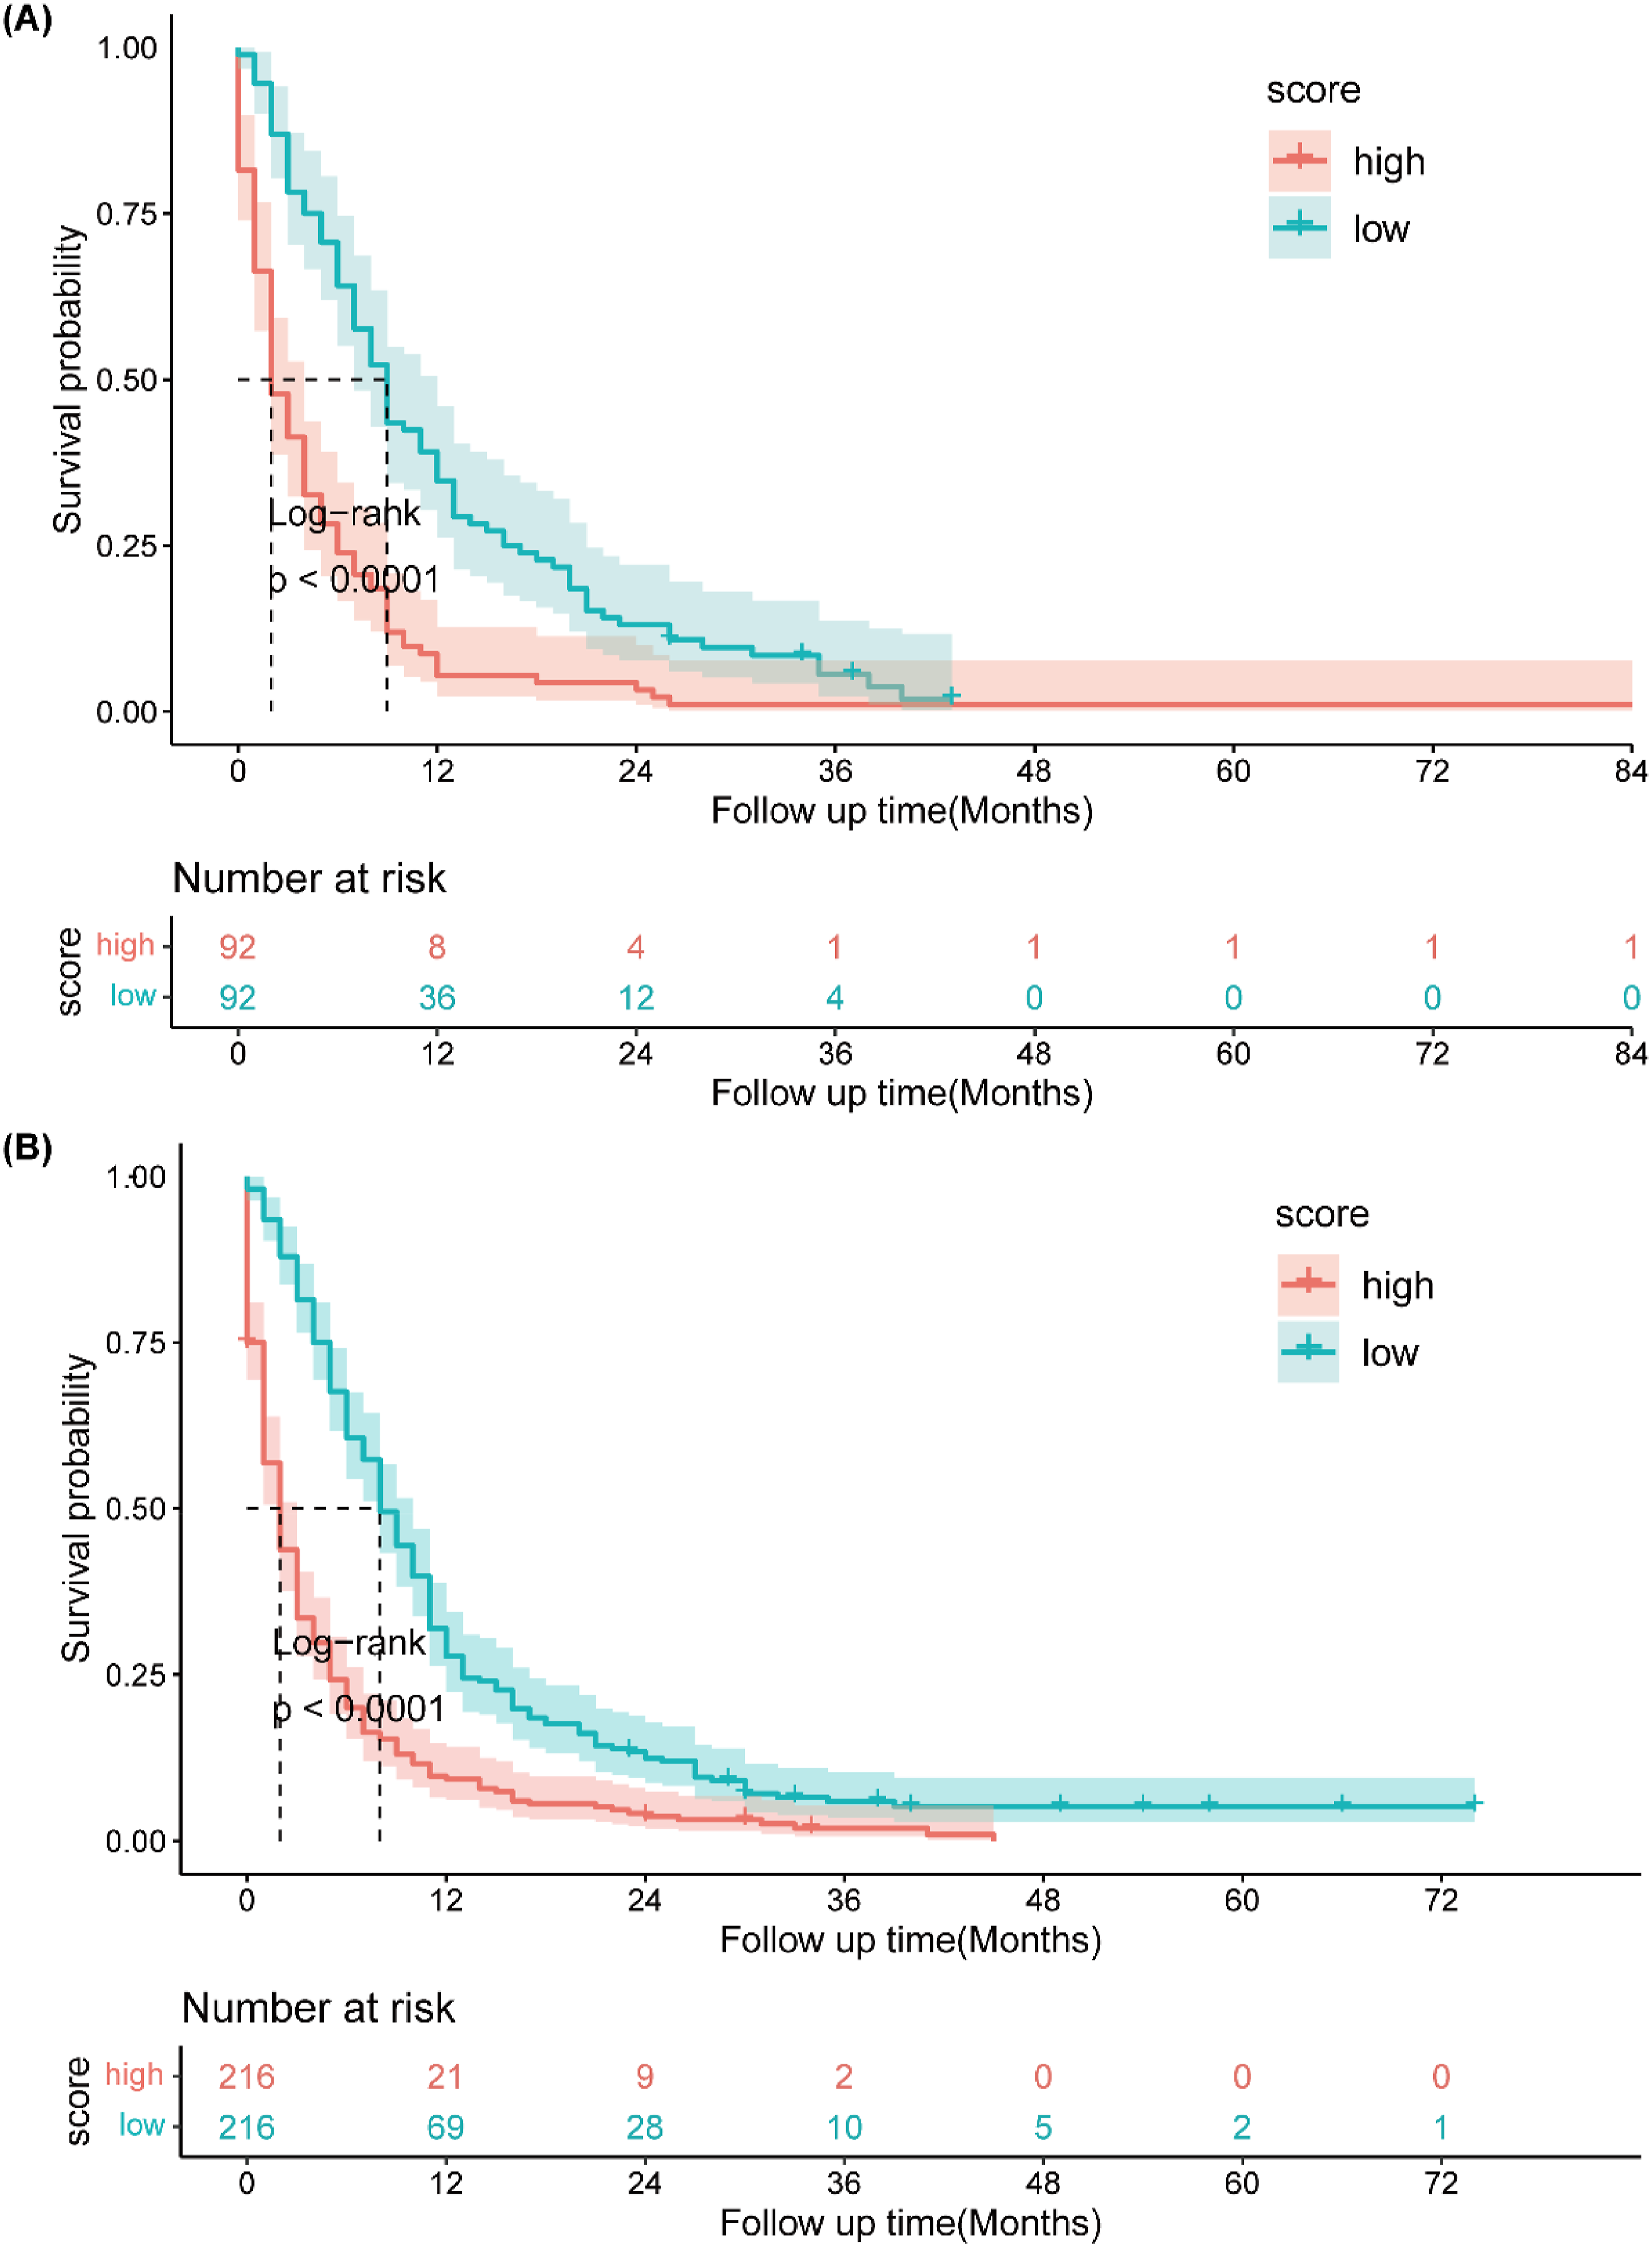
Discussion
LCNEC is characterized by high invasiveness, high recurrence rate, and low response to chemotherapy, which are important reasons for its poor prognosis. 18 At present, a large number of patients still experience mortality due to tumor recurrence or poor treatment outcomes. Therefore, predicting the prognosis of patients suffering from metastatic LCNEC remains a challenging task for physicians. Several studies have focused on identifying prognostic factors and developing predictive models for LCNEC.20–22 For example, Jiang et al 20 conducted a population-based study using the SEER database to develop a nomogram for predicting OS and lung cancer-specific survival (LCSS) in patients with metastatic LCNEC. They identified chemotherapy and metastasis pattern as the strongest predictive variables. 20 Our study aims to further improve and optimize the prognostic model for LCNEC by including more patient data to increase the statistical reliability and generalizability of the analysis, and by innovating the validation methods to enhance the model’s predictive performance and clinical applicability.
In our study, we found that AUC values for 12- and 18-month predictions were lower in the training group compared to the validation group. This difference may be explained by two main factors. Firstly, the training group included a larger and more diverse set of patients, encompassing various pathological features and treatment responses. This diversity likely required the model to handle more variability during training, leading to lower predictive performance. In contrast, the validation group had fewer patients with more consistent characteristics, allowing the model to better match the validation data and achieve higher AUC values. Secondly, differences in treatment regimens between the groups may have contributed. Despite efforts to control variables, variations in clinical treatments received by patients could have affected model performance differently in each group. For instance, more aggressive treatments in the training group might have made it harder for the model to capture all complexities, while a more uniform approach in the validation group may have resulted in more stable model performance.
Age, T staging, N staging, metastatic sites, radiotherapy, and chemotherapy were found as independent prognostic predictors for metastatic LCNEC. Our findings are consistent with existing research reporting that patients suffering from LCNEC at age over 65 years have worse CSS. 26 The possible reason for the above result is the worse nutritional status, reduced physiological reserve, underlying diseases, and poorer tolerance to cancer treatment in the group of patients with older ages.
The TNM staging system serves as the standard in terms of the assessment of the prognosis of neuroendocrine tumors.2,27 Multivariate Cox regression analyses identified that T staging and N staging were significantly associated with patient survival. T staging indicates the size and depth of invasion of the primary tumor. A study suggested that larger tumors had a greater tendency for distant metastasis and a shorter survival rate. 28 N staging indicates the presence of lymph node metastasis, generally suggesting that cancer has started to spread to other parts of the body, and this typically portends a worse prognosis. Univariable and multivariable Cox regression analyses showed that patients suffering from liver metastasis had the worst prognosis in comparison with those with lung metastasis, consistent with previous retrospective study results. 29 Therefore, active management of liver metastasis may help prolong the survival of patients suffering from LCNEC. Additionally, patients suffering from multiple metastases had a worse prognosis, in line with previous studies, 29 likely due to the limited treatment options available for this condition.
Due to its rarity, limited data are available for LCNEC, making it difficult to conduct clinical trials to establish a standard therapeutic regimen for patients with metastatic LCNEC.30,31 Previous studies suggested that primary site surgery failed to increase the survival rates of LCNEC patients. 32 Our results are consistent with this finding, likely due to the high aggressiveness of LCNEC. Patients still have a high risk of recurrence even when diagnosed with an early-stage tumor and treated with complete surgical resection. 21 In contrast, our data showed that patients who received radiotherapy had higher survival rates, consistent with results from several previous studies.26,33 Brain metastases are common in LCNEC and prophylactic cranial irradiation has been demonstrated as an effective treatment to prolong survival time. 29 Whole brain radiation therapy is less effective than stereotactic radiosurgery for LCNEC patients with brain metastases. 34 Chemotherapy is the primary treatment for advanced LCNEC, although the optimal chemotherapy schedule has not been established. While the National Cancer Control Network (NCCN) advises treating LCNEC in accordance with NSCLC guidelines, LCNEC is usually treated with the same chemotherapy regimens as SCLC due to their similarities as high-grade neuroendocrine neoplasms, with studies demonstrating that the SCLC regimen of etoposide in combination with cisplatin or carboplatin for 4-6 cycles is often more effective for advanced LCNEC patients. 5 Overall, a combination of radiotherapy and chemotherapy may be a suitable treatment option for patients suffering from metastatic LCNEC.
The clinical usefulness of tyrosine kinase inhibitor (TKI) drugs in LCNEC is limited due to the rarity of routinely actionable genetic alterations.35,36 The use of EGFR tyrosine kinase inhibitors has only been reported in individual cases, with most cases achieving only partial relief. Studies of ALK rearrangement have also been reported in only a few cases. The PIK3-Akt-mTOR signaling pathway plays a certain role in cell metabolism, apoptosis, and autophagy. The mTOR inhibitor everolimus has already been approved for the management of LCNEC. 9 However, mTOR mutations are more frequently observed in carcinoids, whereas the mTOR mutation rate in LCNEC is only 1%. This highlights the significance of immunotherapy, several retrospective series of LCNEC patients have demonstrated a survival benefit of several months with the use of immunotherapy.37–39 A higher tumor mutational burden and greater expression of immune checkpoint molecules such as PD-L1 on the surface of tumor cells may explain the favorable response to immune checkpoint inhibitor therapy in patients with LCNEC. 40 More prospective studies should be conducted in the future to validate and determine the optimal treatment strategy.
However, it is crucial to note that our study has several limitations that may impact the findings. First, as a retrospective study, selection bias may exist in the patient selection process. This limitation is inherent in retrospective analyses and can affect the generalizability of the results. Second, important clinical factors including tumor biomarker status, genetic testing results, specific radiotherapy regimens, surgical approaches, and immunotherapy are not covered in the analysis due to the limited clinical information available in the SEER database. This lack of comprehensive data could lead to an incomplete understanding of the prognostic factors for metastatic LCNEC. Additionally, the retrospective nature of the study limits its ability to establish causality. While we can identify associations between certain factors and patient outcomes, we cannot definitively determine cause-and-effect relationships. This limitation underscores the need for prospective studies to validate our findings and establish more robust conclusions. The lack of randomization in our study design also introduces potential biases. Randomization helps ensure that treatment groups are comparable and that the findings are not skewed by confounding variables. Without randomization, the reliability of our conclusions is compromised. Another limitation is the demographic composition of our study population. The majority of patients included in the SEER database are of Western ethnicity, which may limit the applicability of our findings to other populations, such as those in Asia. External validation in diverse populations is needed to confirm the generalizability of our nomogram. Lastly, our model should be validated with prospective data that includes the latest TNM classifications and additional prognostic factors to enhance accuracy.
While our study provides valuable insights and a novel prognostic tool for metastatic LCNEC, the limitations mentioned above highlight the need for cautious interpretation of the results and further research to confirm and expand upon our findings.
Conclusion
The new nomogram was established and then validated for predicting CSS in patients suffering from metastatic LCNEC. The nomogram is capable of providing personalized risk evaluation for the mentioned patients and facilitating clinical decision-making.
Footnotes
Declaration of Conflicting Interests
The author(s) declared no potential conflicts of interest with respect to the research, authorship, and/or publication of this article.
Funding
The author(s) disclosed receipt of the following financial support for the research, authorship, and/or publication of this article: This study is supported by Fujian Provincial Finance Project (BPB-2023DCS).