
Abstract
Introduction
Rectal cancer, characterized by a high global incidence rate, is a significant malignancy. This study aimed to develop a competing risk model utilizing the SEER database to estimate the risk of cancer-specific mortality in patients diagnosed with locally advanced rectal cancer (LARC).
Methods
This research employed a retrospective cohort design, selecting patients diagnosed with LARC (stages III-IV) from the SEER database spanning 2010 to 2015. An external validation cohort comprising 203 patients was identified from Tianjin People’s Hospital. A competing risk model was developed to estimate the likelihood of cancer-specific mortality among the patients. The predictive accuracy was assessed using the area under the receiver operating characteristic (ROC) curve and the C-statistic at various time points, while calibration was evaluated using a calibration curve.
Results
A total of 7608 patients with LARC were analyzed, and they were randomly allocated to either the training cohort (N = 5700) or the validation cohort (N = 1908). A competing risk model was developed to predict cancer-specific survival in these patients. Increased risk of non-cancer death was observed among older patients, black patients, and single patients. In the training cohort, the model demonstrated area under the curve (AUC) values of 0.795, 0.78, and 0.783 for 1-year, 3-year, and 5-year predictions, respectively; in the validation cohort, the AUC values were 0.791, 0.792, and 0.779 for the same time points, reflecting good discriminative ability. The C-statistic was 0.775 for the training set and 0.794 for the validation set, confirming the model’s strong predictive performance for cause-specific mortality.
Conclusion
With high accuracy and reliability, the model aids physicians and patients in formulating clinical decisions and follow-up strategies. Furthermore, our findings revealed that the log odds of positive lymph nodes (LODDS) was inadequate as a standalone predictor of LARC-specific mortality.
Introduction
Colorectal cancer ranks as the third most common cancer globally and the second leading cause of cancer-related mortality. Due to shifts in contemporary dietary patterns and lifestyle behaviors, the incidence of colorectal cancer has exhibited a consistent upward trend over the years. The cases of colorectal cancer rose from 840 000 to 2.17 million, while deaths increased from 500 000 to 1.09 million between 1990 and 2019. 1 Among these, rectal cancer constitutes roughly 30% of all colorectal malignancies. Globally, over 600 000 new cases of rectal cancer are identified annually. Owing to its gradual onset and absence of distinct early symptoms, approximately 70% of rectal cancer cases are diagnosed at advanced stages.2,3 Patients diagnosed with LARC typically exhibit the following high-risk characteristics: stage T3 invasion of ≥5 mm, stage T4 involvement, or rectal mesenteric fascia palpation of <1 mm; extra-intestinal wall vessel invasion, and stage N2 involvement of extra-rectal mesenteric lymph nodes. 4 According to the latest clinical guidelines, 5 the TNT approach (radiotherapy-chemotherapy-surgery or chemotherapy-radiotherapy-surgery) is considered the gold standard for treating advanced high-risk rectal cancer. Multiple studies have indicated6,7 that patients can attain a clinically complete remission rate of approximately 28% and a disease-free survival rate of around 70% through both short-course radiotherapy paired with neoadjuvant chemotherapy and concurrent chemoradiotherapy alone, as well as long-course chemoradiotherapy combined with neoadjuvant chemotherapy and concurrent chemoradiotherapy alone. Despite significant advancements in treatment modalities that have notably improved survival rates for patients with LARC, challenges such as high recurrence rates, poor prognosis, and a short median OS after surgery persist due to factors like a propensity for concomitant lymph node metastasis and chemotherapy-associated side effects. Lymph node status serves as a crucial parameter for tumor staging and risk stratification, with the LODDS—defined as the ratio of positive lymph nodes to negative lymph nodes—being utilized as a prognostic indicator across various malignancies. 8 Although several studies have addressed overall survival, disease-free survival, and related prognostic factors, the majority prioritize long-term survival, with limited research focusing on cancer-specific mortality and no single definitive study available to predict cancer-specific death risk. 9
Although numerous studies10,11 have explored the prognosis of patients with LARC, most rely on overall survival analysis using the Kaplan-Meier method and the COX proportional hazards model. Such approaches often overlook competing events, leading to misinterpretations of patient prognosis. For instance, if a patient dies from an accident or a disease unrelated to cancer and this event is omitted from the survival analysis, it could introduce bias between the predicted outcomes and actual results. Conversely, in the presence of competing causes of death, a competing risk approach based on a sub-distribution hazard model provides a more accurate assessment of the impact of risk factors on specific events. Nonetheless, a comprehensive Nomogram description of LARC incorporating competing risk models remains unavailable. Therefore, developing an accurate predictive model for the risk stratification of hospitalized patients is crucial for assessing both cancer and non-cancer prognoses in LARC, thus aiding in decision-making regarding care, surveillance strategies, treatment intensity, and patient counseling.
Materials and Methods
Patients and Predictors
Ethical Approval Statement
This study was approved by the Medical Ethics Committee of Tianjin People’s Hospital [Approval Number: (2025) Fast Review No. (B33)], with the approval issued on February 10, 2025. Owing to the retrospective design of the study, the requirement for informed consent was waived by the Medical Ethics Committee of Tianjin People’s Hospital. Pre-existing data were used in the study, with no direct interaction with participants involved. All research activities adhered strictly to the ethical guidelines set forth by this committee.
Study Population
This research is a retrospective cohort study utilizing data from the SEER database. The study participants were derived from the National Cancer Institute’s SEER database, with patients diagnosed with LARC identified between 2010 and 2015. Additionally, 203 LARC patients treated at the hospital between August 2018 and December 2022 were selected as external validation data. Demographic variables included Age, Race, Sex, Marital Status, Grade, Stage, Tstage, Nstage, Surgical Site (the precise anatomical site where the tumor was surgically removed), Lymph Node Surgery (indicating whether regional lymph node dissection or sampling was performed during tumor excision), Distant Metastasis Surgery (noting if surgical removal of distant metastases was conducted), Radiation Therapy (specifying if it was administered), Chemotherapy (denoting its provision), CEA (a tumor marker employed for diagnosing, evaluating treatment effectiveness, and monitoring colorectal cancer recurrence, inclusive of its test value), Perineural (denoting the presence or proximity of tumor cells to nerve fibers or bundles), Tumor Deposits (nodules of tumor ≥1 mm located in fat or connective tissue away from the primary tumor or major lymphatic pathways, lacking identifiable lymph node features), Bone, Brain, Liver, Lung, Sequence (the order of tumor occurrence, primary or secondary), Number (the count of primary tumors, single or multiple), Behavior (tumor characteristics), Size (the maximum diameter of the primary tumor), and Status (the current disease or tumor condition). The SEER database is a publicly available resource offering investigators access to anonymized data on patient demographics, tumor details, treatment modalities, and survival metrics while safeguarding patient privacy. This study adheres to SEER database usage protocols and complies with the TRIPOD guidelines (https://www.equator-network.org/reporting-guidelines/tripod-statement/) for reporting. 12
Covariates Included
The exclusion criteria used were the same as those adopted in the SEER database, approved by ethics committees, consistent with the requirements of the Declaration of Helsinki, and adhered to the principles of medical ethics. Exclusion criteria: (1) Patients lacking demographic information (2) Patients under 18 years of age (3) Patients with tumor stages T1-T2, N1-N2 (4) Patients with unspecified tumor stages (5) Patients with ambiguous Surg Prim Site (6) Patients with a missing CEA Pretreatment Interpretation Record (7) Patients with indeterminate regional node examination findings (8) Patients in whom bone, brain, liver, or lung metastases could not be excluded (9) Patients with an unclear cause of death (10) Patients with survival time either <0 or unspecified.
Handling of Missing Values
In the data retrieved from the SEER database and the Chinese single-center cohort, some variables were missing. For the SEER cohort, when critical variables like CEA and occupation exhibited a missing rate of over 15%, we chose to exclude these variables entirely. On the other hand, in the external validation cohort, only a small number of essential variables were absent. To handle these gaps, we utilized the multiple imputation method to retain the statistical robustness of the samples and reduce information bias.
Statistical Analyses
We obtained the fundamental characteristics, primary tumor details, treatment data, and survival outcomes of patients with LARC from the SEER database, which include: Age, Sex, Marital Status, Behavior, Grade, Stage, T stage, N stage, Surgical Site, Lymph Node Surgery, Radiation, Chemotherapy, CEA, Perineural Invasion, Tumor Deposits, LODDS, Tumor Size, Bone Metastases, Brain Metastases, Liver Metastases, Lung Metastases, Sequence, Tumor Count, and Survival Status. The LODDS is described as the logarithm of the ratio between the number of positive lymph nodes and the number of negative lymph nodes when lymph nodes are collected. Its formula is log (pnod + 0.5)/(tnod - pnod + 0.5), where pnod indicates the count of positive lymph nodes, and tnod signifies the total number of lymph nodes resected. The addition of 0.5 to both the numerator and denominator serves to avert cases where the divisor equals zero and to minimize occurrences of multiple LODDS values being zero. 13 Cause-specific mortality and other-cause mortality were regarded as two competing events. The cumulative incidence function (CIF) was applied to describe the probability of mortality, and Gray’s test was used to evaluate differences. Fine and Gray’s proportional sub-distribution risk regression was utilized, and a nomogram of a competing risk model was developed to predict the cause-specific mortality of LARC patients. The single-factor competing risk model was employed to identify and analyze the impact of each variable on cause-specific mortality risk. Variables with P < .1 were incorporated into the multi-factor competing risk model, and those with P < .05 were further selected. Simultaneously, weights were adjusted according to the predictive nomogram to remove variables with minimal influence. During the construction of the predictive nomogram, the ROC curve’s area under the curve (AUC) and the C-statistic were used to assess accuracy, while the calibration curve was applied to evaluate calibration. Continuous variables were represented as mean ± standard deviation, and comparisons between groups were performed with an independent samples t test. Categorical data were presented as n (%) and comparisons made using the chi-square test. A P-value of <.05 was considered statistically significant. All analyses were conducted using RStudio 4.0.3 software, with the R packages foreign, survival, riskRegression, dcurves, cmprsk, rms, and mstate utilized to construct the model and nomogram, and the pec package employed to assess model performance. In order to assess the model’s accuracy and stability, we performed calibration curve analysis on the training set, internal validation set, and external validation set using the Bootstrap method. Through 1000 bootstrap resamplings for each dataset, we determined the calibration curves for each iteration, thus evaluating the model’s consistency and predictive performance across various datasets.
Results
Baseline Characteristics
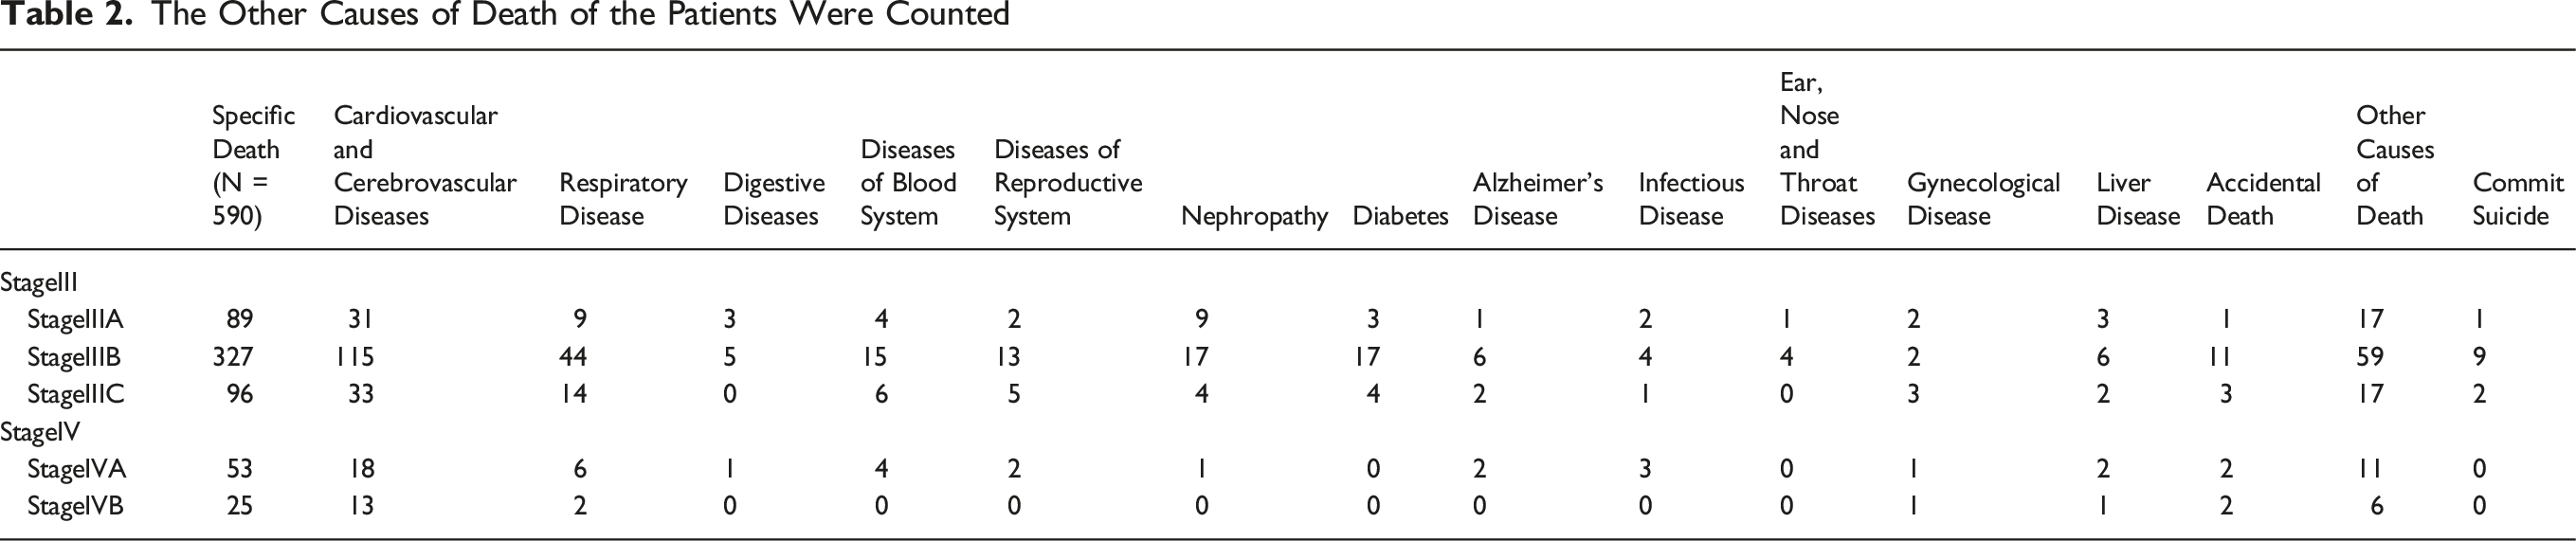
A total of 7608 patients with a confirmed diagnosis of LARC were included in this study. Patients were randomly allocated to the training cohort (N = 5700) or the validation cohort (N = 1908). The patient inclusion/exclusion flowchart is presented in Figure 1. During the follow-up period, 3372 deaths occurred, of which 590 were attributed to other causes, accounting for 17.50% of all deaths. The follow-up duration in both the training and validation cohorts was 49.15 ± 26.54 months; the mean age of the patients was 60.56 ± 13.21 years; the LODDS was −0.71 ± 0.62; 4580 (60.2%) patients were married; 6169 (81.1%) patients were white; and 4569 (60.1%) were male. Additionally, 203 patients from Tianjin People’s Hospital were selected to form the external validation cohort. The clinicopathological details of all patients are summarized in Table 1. No significant differences were found between the training and validation cohorts. The causes of death other than the primary illness were also analyzed, and the statistical outcomes are detailed in Table 2. Patient Inclusion/Exclusion Flowchart Baseline Characteristics of the Training Cohort and Validation Cohort The Other Causes of Death of the Patients Were Counted

Calculation of Cumulative Mortality Using Traditional Survival Analysis and Competing Risk Model
Conventional Survival Analysis and Competing Risk Model Were Used to Calculate Cumulative Mortality


Cumulative Mortality by Competing Risk Model Construction
Cumulative Mortality Rates Constructed by Cox Regression
LARC-Specific Death Risk Prediction Models
Multivariate Cox Hazard Proportional Model Analysis of LARC Patients

Development and Assessment of Predictive Nomogram
Construction of Nomogram
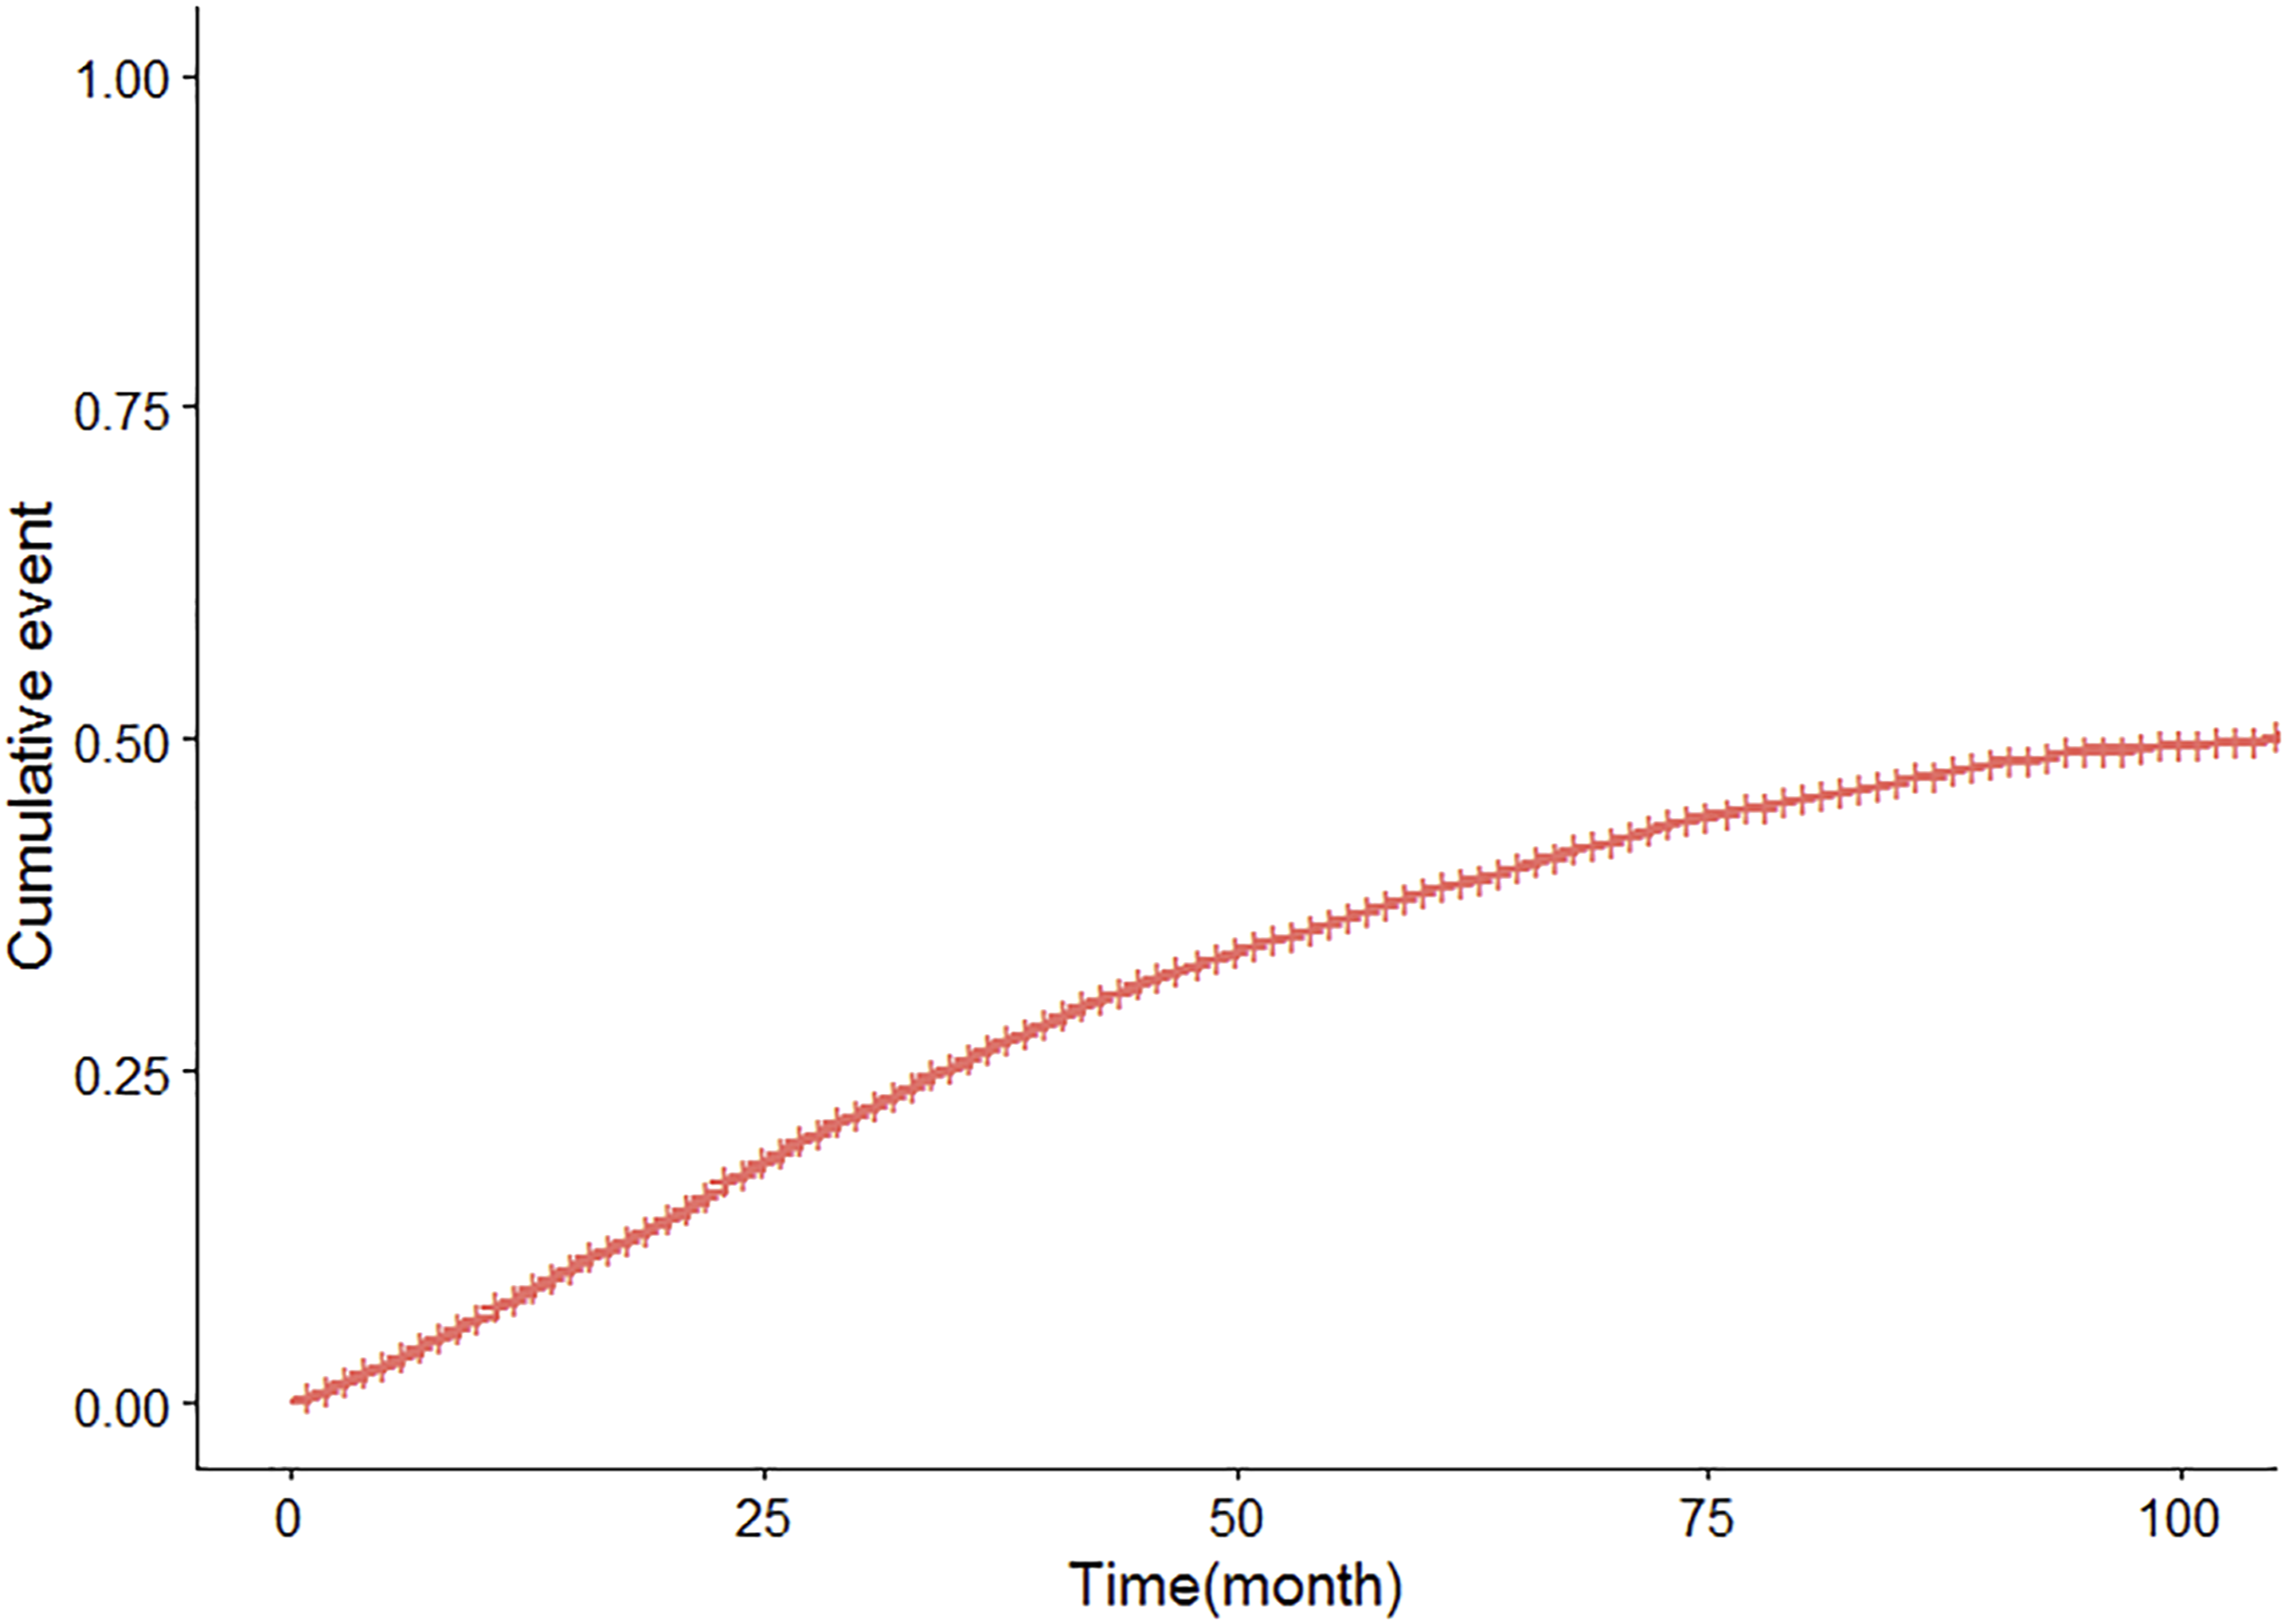
Predictive nomogram plots were developed incorporating variables such as Age, Marriage, Race, Grade, Stage, N, CEA Positive, Perineural, Tumor Deposits, Bone, and Sequence (Figure 4), all of which demonstrated statistical significance. The corresponding CIF curves are presented in Figure 5. The AUC values for 1, 3, and 5 years were 0.795 (95% CI: 0.773-0.818), 0.78 (95% CI: 0.766-0.795), and 0.783 (95% CI: 0.768-0.798), respectively (Figure 6A). The discrepancy between the model’s predicted outcomes and the actual observed values is minimal, and the calibration curve aligns closely with the 45-degree line, signifying strong calibration performance (Figure 7A). Nomogram to Predict the Probability of Specific Death Risk in LARC Patients Cumulative Incidence Curves of Deaths according to Patient Characteristics (Solid Line Represents Cause-specific Death; Dotted Line Represents Other Cause of Death) The ROC and the AUC of the Nomogram. (A) ROC Curve of Nomogram in the Training Cohort. (B) ROC Curve of Nomogram in the Validation Cohort Calibration Curves of the Nomogram. (A) Calibration Curve of Nomogram in the Training Cohort; (B) Calibration Curve of Nomogram in the Validation Cohort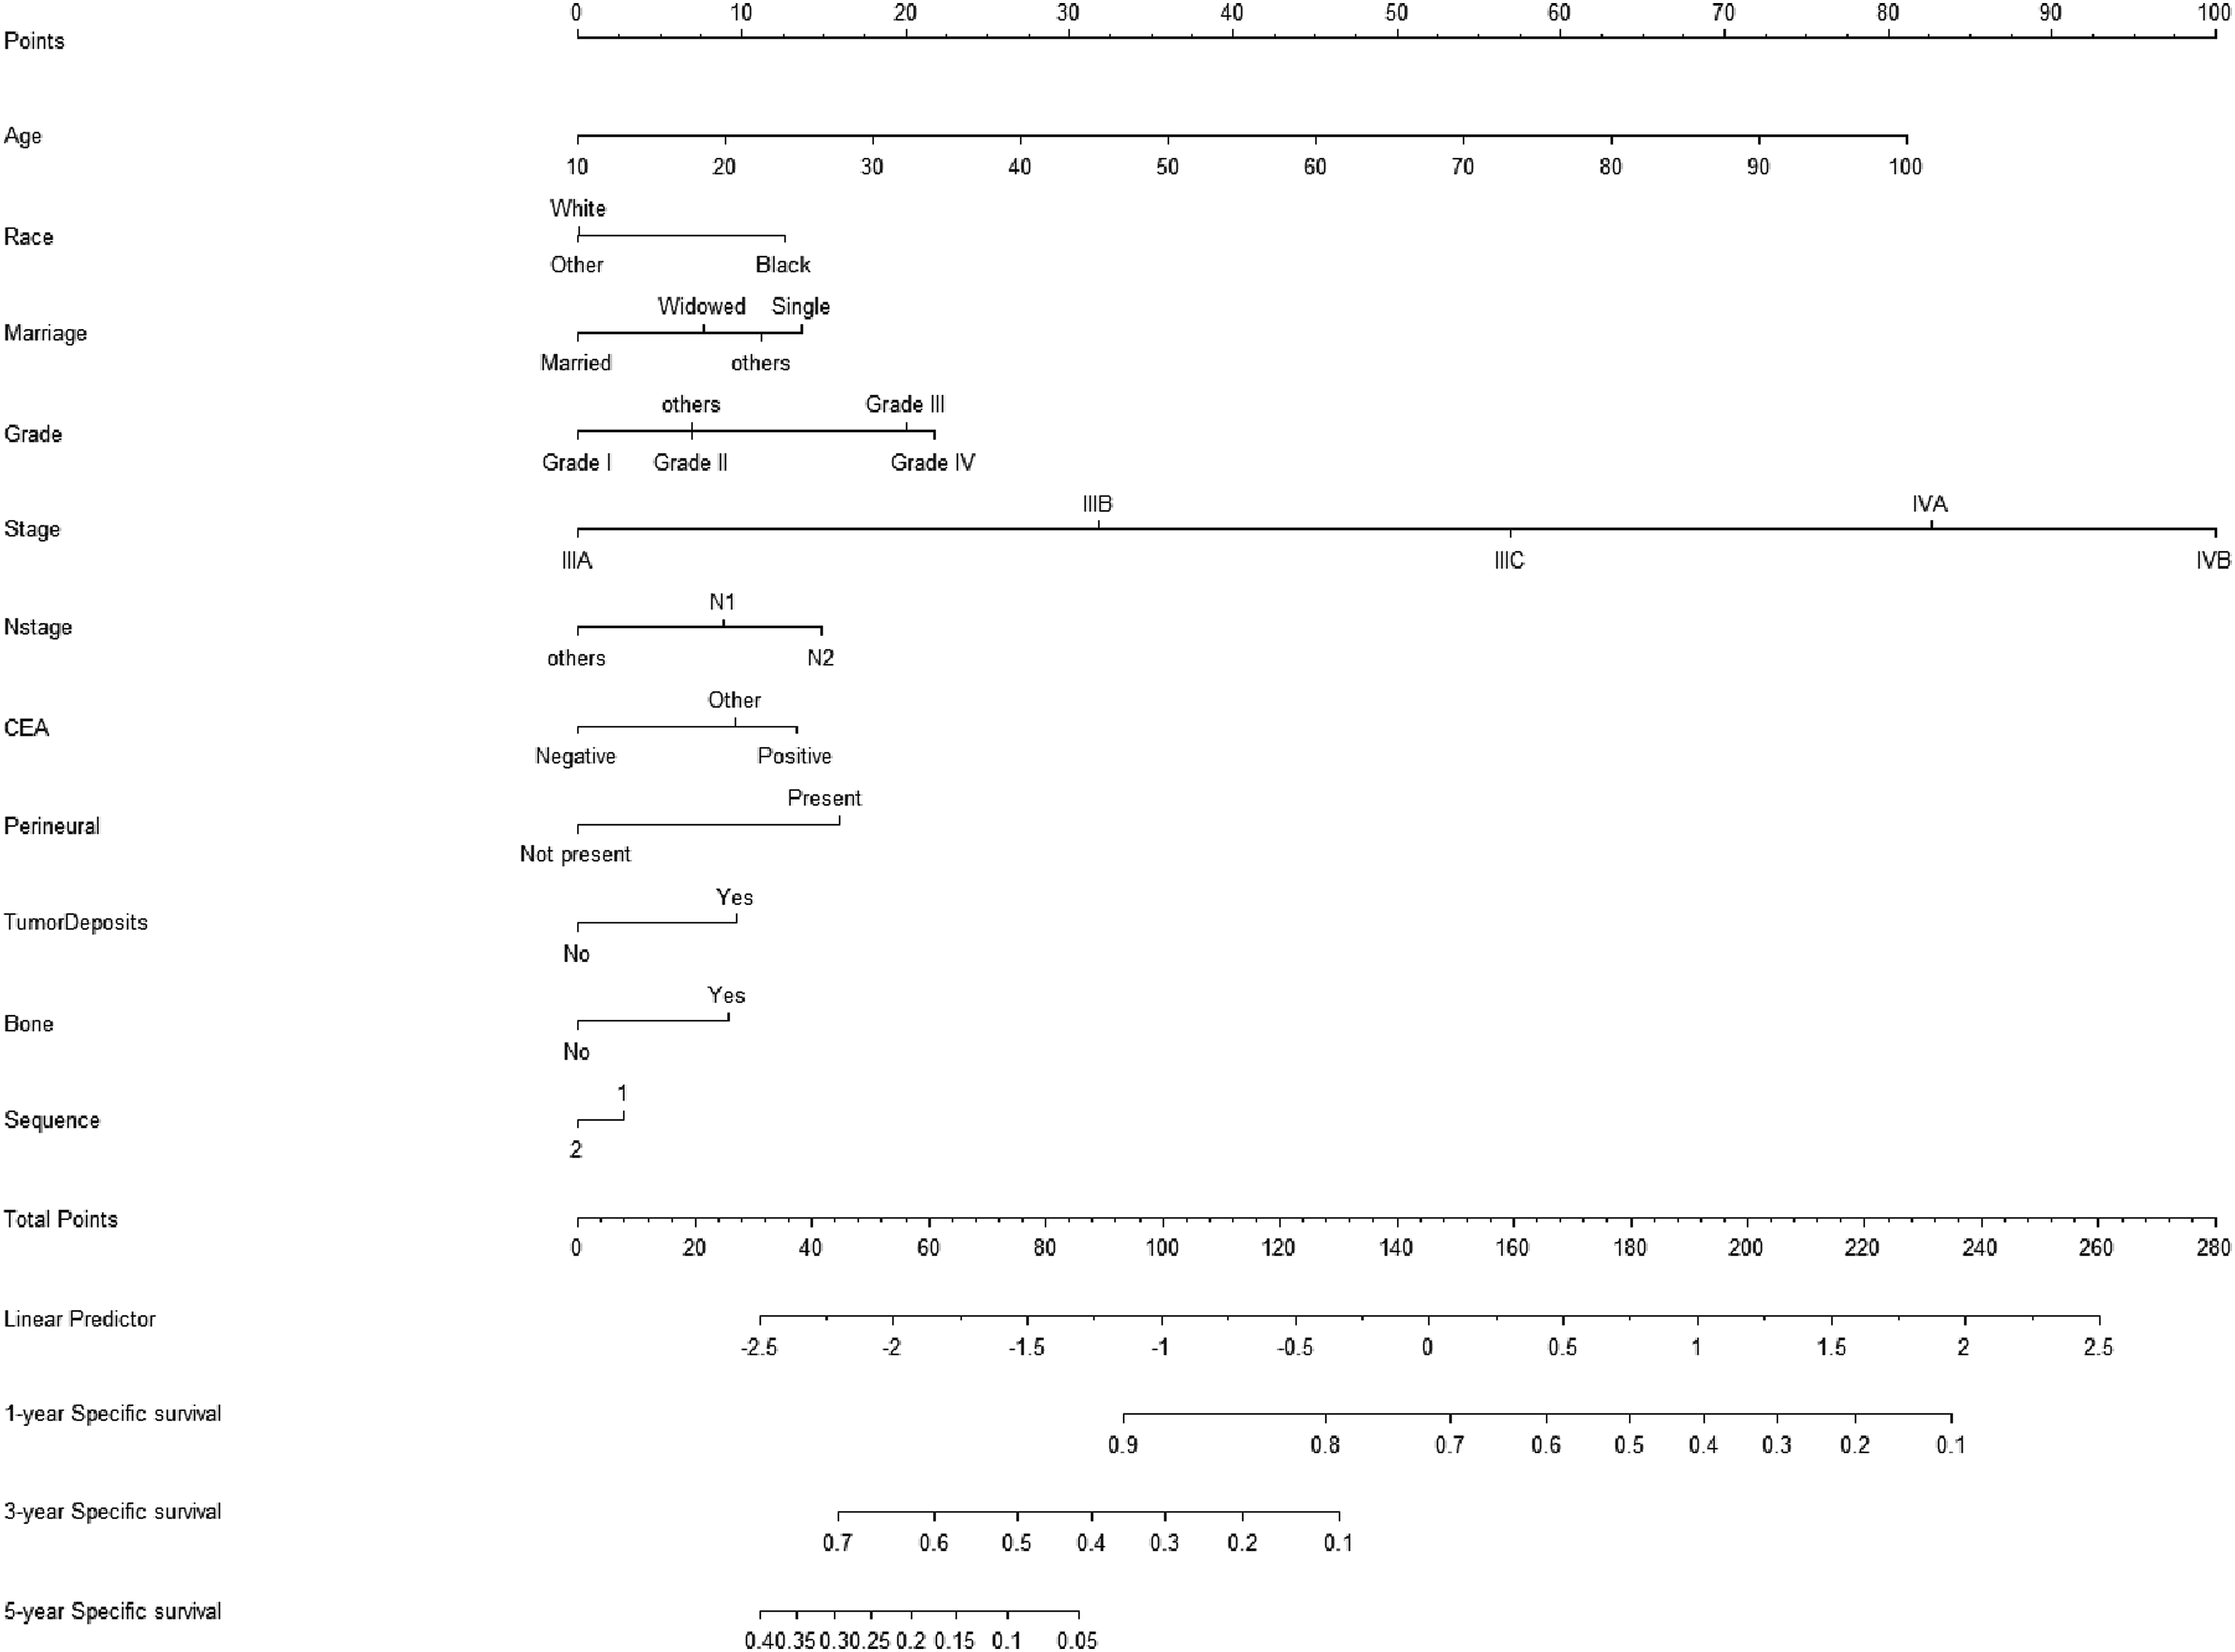


Internal Validation
Internal validation revealed that the nomogram plot demonstrated strong predictive performance. The discrepancy between the model’s predicted outcomes and the actual observed values was relatively minor, and the calibration curve closely aligned with the 45-degree line, suggesting that the model exhibited excellent calibration performance (Figure 7B). The AUC values for 1, 3, and 5 years were 0.791 (95% CI: 0.751-0.83), 0.792 (95% CI: 0.767-0.816), and 0.779 (95% CI: 0.753-0.804), respectively (Figure 6B).
External Validation of the Nomogram
Based on the patient data collected from our institution, external validation was conducted to further assess the model’s validity. The ROC curve demonstrated the nomogram’s strong predictive performance with AUC values of 0.678, 0.692, and 0.701 at 1, 3, and 5 years, respectively (Figure 8). Additionally, the calibration curves indicated a close alignment between the predicted outcomes and the actual results (Figure 9). The Nomogram ROC Curve of the External Validation Cohort The Nomogram Calibration Curve of the Cohort was Externally Verified

Discussion
Given its high rates of morbidity and mortality, rectal cancer stands as a significant threat to human health while placing a substantial burden on society. Accurately predicting cause-specific mortality among patients with LARC is critically important in clinical practice. Assessing patients at higher risk of specific mortality based on baseline characteristics enables optimum allocation of medical resources. In this study, Cox proportional hazard models and competing risk models were employed to analyze data from 7608 patients diagnosed with LARC between 2010 and 2015, sourced from the SEER database, and a predictive Nomogram was subsequently developed. The findings showed that the C-statistic for the training cohort was 0.775, and for the validation cohort, it was 0.794. No overfitting was detected, and both internal and external validations demonstrated strong predictive performance, indicating that the model exhibited considerable predictive accuracy. Unlike conventional survival analysis, the competing risk model effectively identifies factors directly influencing cancer prognosis. Utilizing the predictive Nomogram, it was determined that older age, black ethnicity, being unmarried, higher tumor grade, advanced tumor staging, stage N2 tumor, CEA positivity, perineural tumor invasion, tumor deposits, bone metastasis, and primary tumor sequence were all significant contributors to cause-specific mortality. In this study, we present a practical application of a nomogram developed to assess cancer prognosis. The focus of this analysis is a 65-year-old unmarried Black male diagnosed with T3N2M0 (stage III) cancer, characterized by a positive CEA and the presence of bone metastasis. Based on the nomogram, the scoring is distributed as follows: Age (50 points), Marital Status (15 points), Race (12 points), Cancer Staging (15 points), CEA (12 points), and Bone Metastasis (10 points), resulting in a total score of 114 points. This cumulative score correlates with a 75% probability of cancer-related mortality within 3 years, supporting clinical recommendations for intensified adjuvant therapy and targeted interventions to manage bone metastasis. For individuals with a total score exceeding 100 points, enhanced treatment plans are advised, while patients at lower risk should avoid unnecessary aggressive therapies. Furthermore, adopting customized follow-up intervals based on risk classification—every 3 months for high-risk patients and every 6 months for low-risk patients—could optimize the allocation of medical resources. This analysis was the first to utilize a competing risk model based on the SEER database to predict the risk of LARC-specific mortality.14,15
Our study concentrated on the non-oncological causes of death, including factors such as age, marital status, and race, among patients. Based on our findings, a total of 6169 (81.1%) Caucasian individuals were observed among all patients, which aligns with the racial distribution typical of Western populations. 16 Several studies17,18 have validated that being of black race represents a significant risk factor for both an increased incidence and a less favorable prognosis in patients with LARC. Similarly, parallel results have been observed across various cancer types: for instance, the 1-year net survival rate in pancreatic cancer patients was higher among whites compared to blacks (35.1% vs 31.4%) 19 and the lung cancer incidence rate was lower among whites than blacks (13.2% vs 14.6%). 20 The increased mortality risk among blacks compared to whites is often linked to lower levels of education, income, and access to healthcare services within the black population. Obesity and insufficient physical activity are additional risk factors for rectal cancer, with research indicating that the prevalence of obesity and inactivity is significantly higher among blacks than among whites and Asians.21,22 The study revealed that the cancer-related gene BP1 exhibited significantly higher expression levels in blacks compared to whites, and that mutations or overexpression of the anti-oncogene p53 were likewise observed more frequently in blacks 23 Competing risk models identified age as an independent predictor of tumor-specific mortality in patients with LARC. The median age of LARC onset was 60.65 ± 13.11 years, aligning with the findings of a study by Sauer R, 24 which reported a median age of diagnosis of 60 years. Our research indicates that older patients face a higher risk of cause-specific death. This may be attributed to the fact that elderly individuals often have additional systemic organ disorders and a greater number of comorbidities. Conversely, younger individuals tend to have fewer underlying conditions, superior physical fitness, and a markedly better recovery capacity post-surgery. Radical resection, including TME, remains the gold standard treatment for patients with LARC. 25 Nevertheless, older patients with rectal cancer do not always undergo surgery. This can be attributed to the accelerated progression of cellular aging, the deterioration of various organ functions, the gradual decline in physical condition, and the presence of geriatric syndromes that elevate surgical risks as age increases. Consequently, the mortality risk for older patients deemed unsuitable for surgery becomes significantly higher. During long-term follow-up, the likelihood of non-cancer-related events impacting survival and prognosis in patients with LARC is also heightened. Such events include diseases of the cardiovascular, respiratory, and nervous systems, in addition to leukemia. The model developed in this study demonstrates notable limitations in its generalization when applied to an external validation cohort. This is evident from the significant disparities in the AUC between the external validation cohort and the SEER internal results, revealing substantially diminished performance compared to the internal validation findings. These inconsistencies suggest potential robustness challenges for the model in different population settings. The discrepancies observed may be attributable to two primary factors: firstly, the SEER cohort originates from a multi-center study in the United States (2010-2015), primarily including European and American patients whose treatment protocols largely adhere to the NCCN guidelines using the TNT model (concurrent chemoradiation followed by surgery). However, this cohort only records whether patients underwent chemoradiation, without specific details of the treatment regimen. In contrast, the external cohort is derived from single-center data in China (2018-2022), where more advanced treatment technologies are employed, including precision radiotherapy, targeted therapy, and immunosuppressive therapy. Additionally, treatment adherence and implementation standards are more uniform in this setting, resulting in prognostic differences that the model did not fully incorporate. Furthermore, the SEER cohort contains a higher proportion of Black individuals. Based on the Nomogram results, Black race is identified as a significant risk factor associated with higher incidence and poorer prognosis in LARC patients. However, the external cohort predominantly comprises Chinese individuals and lacks Black individuals, further contributing to the observed differences in the AUC values. Despite the discrepancies in the AUC between the external validation cohort and the SEER cohort, the external cohort’s AUC values at 1, 3, and 5 years still indicate relatively favorable predictive performance. This suggests that the model retains a certain degree of clinical guiding significance. Our statistical evaluation of mortality from non-cancer causes indicated that LARC patients with comorbidities are at an elevated risk of death, particularly those with cardiovascular diseases, who demonstrate the worst prognosis. Moreover, aging is strongly linked to a notable increase in both the frequency and mortality of age-associated diseases. Chronic cardiovascular conditions, including hypertension and coronary heart disease, are common among older adults and show a clear association with advancing age. 26 Research has further demonstrated that the African American race/ethnicity (HR = 1.17, 95% CI = [1.11-1.25]) is significantly linked to an earlier onset of cardiovascular disease. Additionally, diabetes and hypertension have been found to interact with chemotherapy, further exacerbating the risk of cardiovascular complications. 27
Marital status is regarded as an independent prognostic factor for breast cancer, prostate cancer, colorectal cancer, gastric cancer, and head and neck cancer. 28 Among the patients included in this study, 4580 (60.2%) were married. The Nomogram demonstrated that cause-specific mortality rates were lower among married patients compared to those who were divorced or single. Several studies29,30 have reached similar conclusions to ours: unmarried patients face a significantly higher risk of metastasis, insufficient treatment, and cancer-related mortality. The advantages of marriage are substantial. Spouses of married patients often motivate them to seek timely treatment, adhere to follow-up appointments, and provide attentive care post-surgery, significantly contributing to improved cancer survival rates. Conversely, unmarried or widowed patients tend to exhibit greater sadness, depression, and anxiety following a malignancy diagnosis. Research has indicated that patients experiencing depressive and stressful states may irregularly secrete neuroendocrine factors and cytokines such as catecholamines, interleukin-6, interferon, and tumor necrosis factor. These cytokines can compromise immune function and accelerate cancer progression, whereas the presence of a supportive spouse can alleviate psychological distress and mental stress for the patient.31,32.
Tumor Deposits, also referred to as cancer nodules or paraneoplastic nodules, are defined in the latest AJCC/UICC version as isolated tumor nodules located within the lymphatic drainage region of the primary lesion. These tumor deposits lack pathologically recognizable lymph nodes, nerves, or vascular structures. 33 The occurrence of tumor deposits in individuals diagnosed with colorectal cancer varies between 5% and 45% and is linked to an unfavorable prognosis in such patients. 24 A retrospective study utilizing the SEER database examined rectal cancer cases, revealing that 6.71% (2774/41323) tested positive for TD, while 9.61% (39215/41215) displayed signs of peripheral nerve invasion. 34 In the multivariate analysis, tumor deposition and peripheral nerve invasion were linked to worse 3-year OS, indicating that tumor deposition serves as a risk factor for 3-year cancer-specific survival. Nodular tumor deposition is an independent adverse prognostic indicator for cancer-specific survival in rectal cancer patients. Tumor deposition may correlate strongly with tumor aggressiveness, encompassing poorer tumor differentiation, more advanced T, N, and M staging, elevated carcinoembryonic antigen levels, increased local recurrence rates, CRM positivity, and peripheral nerve invasion.35,36 Some researchers have discovered a correlation between TDs and elevated expression levels of CD133 and CD44. 37 A study conducted by Wang Jianfeng et al. indicates that TDs might be linked to the expression levels of IL-6, IL-7, and Foxp3. 37 Consequently, tumor deposition should be regarded as a high-risk factor.
Metastases of colorectal cancer to bones are most frequently observed in the spine, followed by the sacroiliac region, pelvis, and thoracic bones, as well as the femur, humerus, and skull. 38 Bone metastases originating from colorectal cancer have shown an increasing trend in recent years. A study involving 29 patients with such bone metastases reported an incidence rate of 3%-7%. 39 Related research indicates that the incidence of bone metastases originating from colorectal cancer varies between 1.7% and 23.7%. Bone metastases stemming from rectal cancer are comparatively uncommon and typically develop following liver or lung metastases. 40 Multiple studies have demonstrated that the frequency of bone metastases is markedly greater in rectal cancer compared to colon cancer.39-41The reason could be that metastases originating from rectal cancer are more prone to traverse the Batson vertebral venous system.41,42 During the return of blood from the middle and lower rectal veins to the inferior vena cava, metastases travel through the valveless Batson vertebral venous plexus, where slow blood flow increases the likelihood of cancer cell accumulation 42 Bone metastases suggest a serious poor prognosis.43,44 Patients with bone metastases commonly suffer from various bone-related complications, including intense bone pain, pathological fractures, spinal cord compression, and hypercalcemia. The 5-year survival rate for such patients is below 5%.45,46 The median survival duration for patients with bone metastases originating from rectal cancer is 114 days. In contrast, for patients with bone metastases accompanied by metastases to other organs, the median survival duration decreases to 79 days (95% CI 1.06-2.05). 47 In a study conducted by Zhenghong, 48 serum CEA was identified as an independent risk factor for rectal cancer. Among patients with LARC, 73.5% exhibited elevated CEA levels, a statistically significant difference (P < .05) when compared to normal patients, whose elevated CEA levels were 26.5%. 48 Clinicians should remain vigilant in detecting bone metastases in patients with lung metastases and elevated CEA, particularly when the CEA level exceeds 100 μg/L. This serves as a reminder for clinicians to identify at-risk patients, enhance surveillance, and prioritize early detection and treatment of bone metastases to prevent skeletal complications.
At present, lymph nodes are commonly staged clinically using the pN staging system proposed by the American Joint Committee on Cancer (AJCC). The accuracy of pN staging is ensured when more than 12 lymph nodes are identified. However, if fewer than 12 lymph nodes are detected, staging deviations are likely to occur, potentially impacting prognosis and subsequent treatment. Due to various factors, detecting fewer than 12 lymph nodes is a frequent occurrence in clinical practice, necessitating the development of more reliable staging indicators to better inform clinical decision-making.49,50 The LODDS (LODDS) as a predictor of prognosis has shown a better predictive value compared to pN staging and lymph node metastasis rate (LNR) staging. 51 A study by Zhang yin 52 demonstrated that LODDS staging serves as an independent prognostic indicator for 3-year postoperative disease-free survival in individuals with stage III rectal cancer.
Several studies53,54 have demonstrated a correlation between LODDS and prognosis; however, these studies concentrated exclusively on all-cause mortality, leaving its relationship with cause-specific mortality uncertain. In our research, we observed no impact of LODDS on cause-specific mortality among patients with LARC.
This study employs a competing risks model to evaluate cancer-specific mortality (CSM), which differs fundamentally from the traditional Cox proportional hazards model, as illustrated in Table 3. Conventional survival analysis frequently overestimates the risk of CSM due to its assumption that censoring and failure times are independent, treating all events unrelated to the primary outcome as non-informative censoring. 54 However, survival analysis in clinical studies often involves multiple competing outcomes, and failing to account for these can result in biased estimations. Within the framework of CSM analysis, the Cox model treats non-cancer-related deaths as censored events, incorrectly assuming that these patients continue to be at risk of cancer-related mortality. This approach causes an overestimation of cumulative CSM risk, particularly in high-risk populations like older adults and patients with comorbidities, thereby misrepresenting the true influence of prognostic factors.55,56 As depicted in Table 2, cardiovascular disease was identified as the leading cause of non-cancer mortality, accounting for 35.5% of such deaths. The mean age of the study cohort was 60.56 years, consistent with the physiological characteristics of patients dealing with advanced cancer. Advanced age not only increases the probability of rectal cancer but also reflects accumulated cardiovascular damage, thereby intensifying the effects of competing mortality. Consequently, the risk estimates derived from the Cox model might result in misleading clinical decisions in populations with high competing mortality. In contrast, the competing risks model addresses these challenges by using subdistribution hazard ratios (sdHR) to evaluate factor-specific effects and to directly calculate the cumulative incidence of CSM in the presence of competing events. 57 This study generates outcomes that are both highly precise and clinically meaningful. Based on these findings, we recommend utilizing the Cox model to estimate all-cause mortality, especially in groups with minimal competing risks, such as individuals below the age of 50 without significant comorbidities. For investigations focused on cause-specific mortality in populations with increased competing risks, such as patients above the age of 60 or those with cardiovascular comorbidities, it is crucial to apply competing risks regression to prevent biased results and facilitate more informed clinical decision-making.
Compared to the all-cause mortality model based on the SEER database for LARC, the constructed all-cause mortality prediction model has limitations because the SEER database does not include data on patients’ underlying diseases. This omission leads to greater interference from other causes of death and makes it impossible to fully adjust the model. Similarly, our analysis using traditional Cox regression demonstrated that other causes of death accounted for over 30% of the total deaths, and excluding these patients would introduce a certain level of selection bias. In this study, we developed the first predictive Nomogram based on competing risk models, which demonstrated superior predictive performance. Additionally, this study confirmed that LODDS in patients with LARC was not an independent prognostic factor. This study also has several limitations: (1). The database lacks fundamental clinical data, such as information on cardiac, pulmonary, hepatic, and renal function. (2). As this is a retrospective analysis, there were missing variables in the data retrieved from the SEER database, resulting in the exclusion of certain cases during the data cleaning process, which may introduce bias into the analysis. Moreover, the external validation sample size was limited (n = 203) and originated from a single hospital in China, further increasing the potential for selection bias. (3). External validation was insufficient, as data from our institution were not included for validation purposes.
Conclusions
In this research, we developed a Nomogram for cause-specific mortality in patients with LARC, utilizing a large population-based cohort sourced from the SEER database. Additionally, we employed a proportional sub-distribution risk model to analyze cause-specific mortality in LARC patients and created a competing risk Nomogram to estimate 1-, 3-, and 5-year cause-specific mortality. Furthermore, LODDS was determined to be inadequate as an independent predictor of LARC-specific mortality. Our Nomogram demonstrated relatively strong performance and holds potential as a practical tool for predicting prognosis.
Supplemental Material
Supplemental Material - Development and Validation of a Nomogram for Predicting Specific Mortality Risk After Surgery for Locally Advanced Rectal Cancer: Studies Based on SEER Database and External Validation Cohorts
Supplemental Material for Development and Validation of a Nomogram for Predicting Specific Mortality Risk After Surgery for Locally Advanced Rectal Cancer: Studies Based on SEER Database and External Validation Cohorts by Shufa Tan, Shuang Liu, Yunyi Yang, Chuanyue Peng, Yulai Yin, Dingbin Liu, Yuwei Li, and Chen Xu in Cancer Control
Footnotes
Ethical Considerations
This study received approval from the Medical Ethics Committee of Tianjin People’s Hospital [Approval Number: (2025) Fast Review No. (B33)], with the approval issued on February 10, 2025. Due to the retrospective nature of this study, the requirement for informed consent was waived by the Medical Ethics Committee of Tianjin People’s Hospital. The study utilized pre-existing data that did not involve direct participant interaction. All research activities were conducted in strict compliance with the ethical guidelines established by this committee.
Author contributions
All authors contributed to the study conception and design, and Shufa Tan and Shuang Liu contributed equally to this work. Conceptualization: Shufa Tan, Shuang Liu; Methodology: Shufa Tan, Shuang Liu, Yunyi Yang, Yulai Yin; Formal analysis and investigation: Shufa Tan, Chuanyue Peng; Writing original draft preparation: Shufa Tan; Writing review and editing: Shufa Tan; Funding acquisition: Dingbin Liu, Chen Xu; Resources: Yuwei Li; Supervision: Yuwei Li, Chen Xu; All authors commented on previous versions of the manuscript. All authors read and approved the final manuscript.
Funding
The authors disclosed receipt of the following financial support for the research, authorship, and/or publication of this article: (1). Sinpec Science and Technology Development Project (Provincial and Ministerial Level), (Grant No: 36600000-23-ZC0607-0023), Research and development of fecal exosome-based colorectal cancer screening kit. (2). General Project of National Natural Science Foundation of China, (Grant No: 22174072), Efficient extraction of fecal exosomes and its application in early screening of colorectal cancer.
Declaration of Conflicting Interests
The authors declared no potential conflicts of interest with respect to the research, authorship, and/or publication of this article.
Data Availability Statement
The original contributions presented in the study are included in the article, further inquiries can be directed to the corresponding author.
Supplemental Material
Supplemental material for this article is available online.
References
Supplementary Material
Please find the following supplemental material available below.
For Open Access articles published under a Creative Commons License, all supplemental material carries the same license as the article it is associated with.
For non-Open Access articles published, all supplemental material carries a non-exclusive license, and permission requests for re-use of supplemental material or any part of supplemental material shall be sent directly to the copyright owner as specified in the copyright notice associated with the article.