
Abstract
Introduction
Contrast-enhanced computed tomography (CT) is the primary imaging modality for accurate risk stratification in gastrointestinal stromal tumors (GISTs). However, contrast-enhanced CT may not always be accessible or suitable for all patients undergoing risk assessment of GISTs. Therefore, this study explored the use of non-enhanced CT imaging for assessing body composition in patients with GISTs to preoperatively predict risk stratification.
Methods
We retrospectively analyzed 233 patients with GISTs who met the inclusion criteria. Pretreatment complete abdominal CT images from these patients were processed and analyzed using the Siemens Syngo imaging system. The data were subsequently organized and analyzed using the SPSS software (version 26.0).
Results
Through two independent samples t-tests, Mann–Whitney U tests, and chi-square tests (including corrected chi-square tests and Fisher’s exact tests), the intermediate-high risk group exhibited a lower visceral fat index (VFI) and higher tumor volumes and proportions of necrosis (P < .05), compared to the low-risk group (P < .05). No statistically significant differences were observed in the other indicators. Our research demonstrates that tumor volume is positively correlated with the National Institutes of Health (NIH) classification and exhibits the highest specificity among the four models (specificity = 0.735). However, its sensitivity is lower than that of the combined model (sensitivity = 0.803) and the VFI model (sensitivity = 0.972).
Conclusion
Based on the vascular abundance index, tumor volume, and necrosis status observed in the CT plain scan images of patients with GIST, a comprehensive predictive model was developed. This model can accurately predict the NIH grade of stromal tumors, thereby providing a robust basis for formulating effective treatment strategies and improving the prognosis of patients with GISTs who cannot undergo contrast-enhanced CT.
Plain Language Summary
This study explored the use of non-enhanced CT imaging for assessing body composition in patients with GISTs to preoperatively predict risk stratification. We retrospectively analyzed 233 patients with GISTs who met the inclusion criteria. The results indicate that, based on the vascular abundance index, tumor volume, and necrosis status observed in the CT plain scan images of patients with GIST, a comprehensive predictive model was developed. This model can accurately predict the NIH grade of stromal tumors, thereby providing a robust basis for formulating effective treatment strategies and improving the prognosis of patients with GISTs who cannot undergo contrast-enhanced CT.
Keywords
Introduction
Gastrointestinal stromal tumors (GISTs) are undifferentiated mesenchymal neoplasms originating in the digestive tract. These tumors predominantly affect the stomach, followed by the small intestine and other parts of the gastrointestinal tract. The National Institutes of Health (NIH) categorizes GISTs into four risk strata based on factors, including tumor location, size, mitotic rate, and presence of rupture. A higher risk level is associated with a worse prognosis. According to the “Consensus on Comprehensive Management of Gastrointestinal Stromal Tumors in China (2020 Edition),” patients with high-risk GISTs and non-gastric moderate-risk GISTs should receive imatinib adjuvant therapy for at least 3 years, whereas those with gastric moderate-risk GISTs should undergo adjuvant therapy for at least 1 year. Conversely, patients with very low-risk and low-risk GISTs are recommended for regular follow-up. Therefore, preoperative non-invasive assessment of gastrointestinal risk levels is crucial for guiding clinical treatment decisions.
Computed tomography (CT) has been widely utilized as the primary examination method for the preoperative risk assessment of GISTs. It indirectly reflects the risk of GISTs by evaluating tumor necrosis and size. However, an accurate evaluation often requires enhanced imaging. For patients who cannot undergo contrast enhancement, the accuracy of CT in assessing risk is significantly compromised, and visceral obesity has been significantly linked to multiple malignancies, including pancreatic cancer, 1 esophageal cancer, 2 renal cell carcinoma, 3 and colorectal cancer. 4 Because of the significant density difference between intra-abdominal fat and surrounding tissues, the boundaries of intra-abdominal fat are clearly delineated on plain CT scan images. The International Diabetes Federation recommends using magnetic resonance imaging or CT scans to precisely evaluate the visceral fat area (VFA) for determining visceral obesity. Body components, including bone, muscle, and fat, are important endocrine organs. These three organs were significantly associated with cancer prognosis.5,6 Multiple recent studies have demonstrated that CT has emerged as a crucial tool for accurately evaluating the density of visceral organs, paravertebral muscles, and bone tissue owing to its widespread availability and ease of operation.7,8 However, most of these studies have focused on enhanced CT scans for tumor assessment. To date, there is a lack of research on patients who are unsuitable for enhanced scans.
This study aimed to investigate whether evaluating body composition using non-enhanced CT images can serve as a potential strategy for predicting the risk levels of GIST, thereby providing a clinically significant approach to GIST treatment and improving patient prognosis.
Materials and Methods
Patients
This study was approved by the Ethics Committee of the Third Affiliated Hospital of Chongqing Medical University of China (IRB: 202301-84). Given the retrospective nature of this study, the committee waived the requirement for written informed consent. All procedures were conducted in accordance with relevant guidelines and regulations. The reporting of this study conformed to the STROBE guidelines. 9
This was a retrospective study. We de-identified all the patient details. The clinical and pathological data of all patients with GISTs who met the inclusion criteria between January 2015 and December 2023 were retrospectively collected from hospital medical records. The inclusion criteria were: (1) cases that met the diagnostic criteria outlined in the “China Consensus on the Diagnosis and Treatment of Gastrointestinal Stromal Tumors” and were confirmed by pathological examination, with no prior treatment received before enrollment; (2) patients who underwent a full abdominal CT scan preoperatively, ensuring clear and interpretable CT images; (3) patients with available comprehensive clinical data. The exclusion criteria were: (1) presence of other metastatic tumors or concurrent malignancies; (2) CT images with artifacts or inadequate gastric cavity filling lead to poor visualization of the lesion; (3) patients who received anti-cancer treatments or other interventions that could alter tissue characteristics prior to surgery.
According to the NCCN guidelines, the risk of GISTs can be categorized into four grades: very low risk, low risk, intermediate risk, and high risk. 10 Specifically, very low-risk tumors were less than or equal to 2 cm in size, with a mitotic count of less than 5 per 50 high-power fields. Low-risk tumors ranged in size from 2 to 5 cm, with a mitotic count of 5 or fewer per 50 high-power fields. Intermediate-risk tumors are also between 2 and 5 cm but have a mitotic count of more than 5-10 per 50 high-power fields. High-risk tumors were characterized by either a size greater than 10 cm with any mitotic count or a size greater than 5 cm with a mitotic count exceeding 5 per 50 high-power fields. Based on the need for imatinib-assisted treatment, the patients were categorized into an intermediate-high-risk group (including high-risk and moderate-risk GIST cases) and a low-risk group (including low-risk and very low-risk cases).
Body Mass Index (BMI) Classification
According to the World Health Organization’s BMI classification for Asian populations, underweight was defined as a BMI <18.5 kg/m2, normal weight as a BMI of 18.5-22.9 kg/m2, overweight as a BMI of 23.0-24.9 kg/m2, and obesity as a BMI ≥25 kg/m2. 14
CT Scans
All patients underwent imaging using a GE Revolution 512-slice CT scanner (GE Medical Systems, Chicago, Illinois, USA). The scanning protocol encompassed the entire abdominal region. The specific scanning parameters were as follows: tube voltage of 120 kV; tube current ranging from 300 to 480 mAs; slice thickness and interval both set at 5 mm; field of view between 35 and 50 cm; matrix size of 512 × 512; rotation time of 0.6 s; and pitch ratio of 0.984:1. Non-contrast images were acquired.
Body Composition Evaluation
Pretreatment complete abdominal CT images of the patients included in this study were processed and analyzed using Siemens Syngo via software version VB40 (Siemens Healthineers). The L3 vertebra was chosen as a standard anatomical landmark because the cross-sectional area of muscle and adipose tissue at the L3 level on CT images is strongly correlated with the total body muscle and fat mass.
11
First, the data were opened in MM Reading Mode, and “Region Growing” was selected from the upper left corner of the interface. Subsequently, “Manual MPR” was chosen from the ensuing dialog box. The region of interest (ROI) was manually delineated to quantify visceral fat. Following the delineation, the “+” button was clicked to confirm the outlined area, which appeared green. By selecting “Threshold” and choosing “Fat,” the green area was restricted exclusively to fat components. The calculated volume, along with the average fat density and standard deviation, was displayed by right-clicking on the “Object” icon and selecting “Show Evaluation” (Figure 1A). The skeletal muscle volume at the level of the third lumbar vertebra was assessed using the same method (Figure 1B). The skeletal muscle and VFAs were calculated by dividing the respective volumes by the layer thickness. The L3 skeletal muscle index (SMI) was derived by dividing the total L3 skeletal muscle area (cm2) by the square of the height (m2). The visceral fat index (VFI) was calculated by dividing the VFA (cm2) at the L3 level by the square of height (m2). Previous studies have indicated that the CT value for fat ranges from −190 to −30 Hounsfield units (HU), whereas the CT value for muscle ranges from −29 to 150 HU.
12
The 2013 guidelines from the American College of Radiology on bone mineral density (BMD) measurement using quantitative CT indicate that the mean BMD values of the first and second lumbar vertebrae (L1 and L2) are reliable for diagnosing osteoporosis.
13
BMD was measured at L1 and L2, with the average value representing overall BMD (Figure 1C). To minimize the partial volume effects on the cortical bone, the ROI margin was set to at least 3 mm from the lumbar borders. The ROI area was maintained between 250-350 mm2 to ensure that it was as large as possible within the selected boundary while maintaining accuracy. Measurement of Visceral Fat Area (VFA) at L3 Vertebral Layer (A). Measurement of Skeletal Muscle Volume at L3 Vertebral Layer (B); Measurement of Bone Mineral Density (BMD) of L1 and L2 Vertebrae (C).
The design flow process is presented in Figure 2. The Design Flow Process.
Statistical Analysis
Statistical software (SPSS 26.0) was used for data organization and analysis. Normally distributed measurement data were presented as mean ± standard deviation (x ± s), and differences between groups were assessed using independent samples t-tests. Non-normally distributed data were reported as median (interquartile range, IQR), and intergroup comparisons were conducted using the Mann–Whitney U test. Counting data are presented as frequencies (percentages), and chi-square tests were used for intergroup comparisons. Multivariate analysis was conducted to investigate the associations between various factors and GISTs. A nomogram was constructed using R software (V4.2.0) based on variables selected from the multivariate logistic regression model. The performance of these variables in predicting GISTs risk was evaluated through ROC curve analysis, which assessed both significance and accuracy. Internal validation of the model was performed using the bootstrap method with 1000 replicate samples. The Hosmer–Lemeshow test was used to evaluate the goodness of fit of the model. A P-value less than .05 indicated that the model accurately fit the data. Additionally, the accuracy of the model was confirmed using the ROC curve analysis. The clinical utility of the model was assessed via decision curve analysis using R software (V4.2.0). Statistical significance was set at P < .05, which denoted statistical significance.
Results
Patient’s Clinical Characteristics and Body Composition Data
A total of 233 patients with pathologically confirmed gastrointestinal stromal tumors were included in this study. Comprehensive clinical data for all patients were collected, including demographic information (sex, age), anthropometric measures (BMI), SMI, bone density, tumor markers (CEA, CA199), and the presence or absence of comorbidities such as coronary atherosclerosis, diabetes, hypertension, or metabolic syndrome. Patients comprised 121 men (52%) and 112 women (48%). All the participants were Asian. In this cohort, 11 patients were classified as underweight, 92 as normal weight, 63 as overweight, and 67 as obese. Among them, 13 (5.6%) exhibited coronary artery calcification, 14 (6%) had diabetes mellitus, 46 (19.7%) had hypertension, and 2 (0.85%) had metabolic syndrome.
According to the risk classification criteria outlined in the NCCN guidelines, 71 individuals were categorized into the intermediate-to-high-risk group (30.5%), while 162 individuals were classified into the low-risk group (69.5%). The overall median tumor volume was 63.92 mm3 (interquartile range: 16.19-349.76 mm3). Specifically, the median tumor volume in the low-risk group was 38.84 mm3 (interquartile range: 10.79-128.33 mm3), and in the intermediate-high risk group, it was 367.30 mm3 (interquartile range: 75.49-1019.89 mm3). The median VFI for the entire population was 45.55 (interquartile range: 29.91, 64.27). Specifically, the low-risk group had a median VFI of 47.38 (interquartile range: 31.24, 67.85), while the high-risk group had a median VFI of 42.75 (interquartile range: 24.47, 57.86). Among the patients, 126 had gastric tumors and 107 had tumors at other anatomical locations. The median VFI for patients with gastric tumors was 48.39 (interquartile range: 30.74, 65.81), whereas for those with non-gastric tumors, it was 42.35 (interquartile range: 25.95, 63.73).
Comparison of Clinical Characteristics and Body Components Between the Intermediate-High Risk Group and Low-Risk Group.

adenotes the application of the independent samples t-test.
bdenotes the application of the Mann-Whitney U test.
cdenotes the application of the chi-square test.
ddenotes the application of the corrected chi-square test.
edenotes the application of Fisher’s exact test.
Multivariate Logistic Regression Analysis for Predicting Risk Grading in GISTs
Model I: With different prognosis levels as the dependent variable (coded as 1 for the intermediate-high-risk group and 0 for the low-risk group), the independent variables selected for binary logistic regression analysis included VFI, tumor volume, and the presence or absence of necrosis (coded as 1 for presence and 0 for absence). These variables were identified based on the significant differences observed in single-factor analyses across different prognosis levels. The method selection was “Enter.” The results indicated that a larger tumor volume (OR = 1.001, P = .004), lower VFI (OR = 0.986, P = .047), and the presence of necrosis (OR = 2.314, P = .017) were independent risk factors for advanced prognosis. Based on the binary logistic regression analysis, the regression equation for the model was logit(P) = −1.014 + 0.001× tumor volume - 0.014 × VFI +0.839 × necrosis (Figure 3). Multivariate Logistic Regression Nomogram for Prognostic Prediction in the Intermediate-High Risk Group.
Model II: Based on Model I, adjustments were made for sex and age. The results demonstrated that larger tumor volume (OR = 1.001, P = .004), lower VFI (OR = 0.986, P = .045), and the presence of necrosis (OR = 2.249, P = .022) were independent risk factors for predicting intermediate-to high-risk GISTs.
Multivariate Logistic Regression Analysis for Intermediate-High Risk Group.

Note: Model I integrates tumor volume, VFI, and the presence or absence of necrosis; Model II adjusts for gender and age based on Model I; Model III further adjusts for CEA, CA199, and bone density based on Model II.
Analysis of Predictive Efficacy Across Different Levels of Risk
Analysis of Risk Prediction Efficacy Across Varying Levels of Hazard Risk.

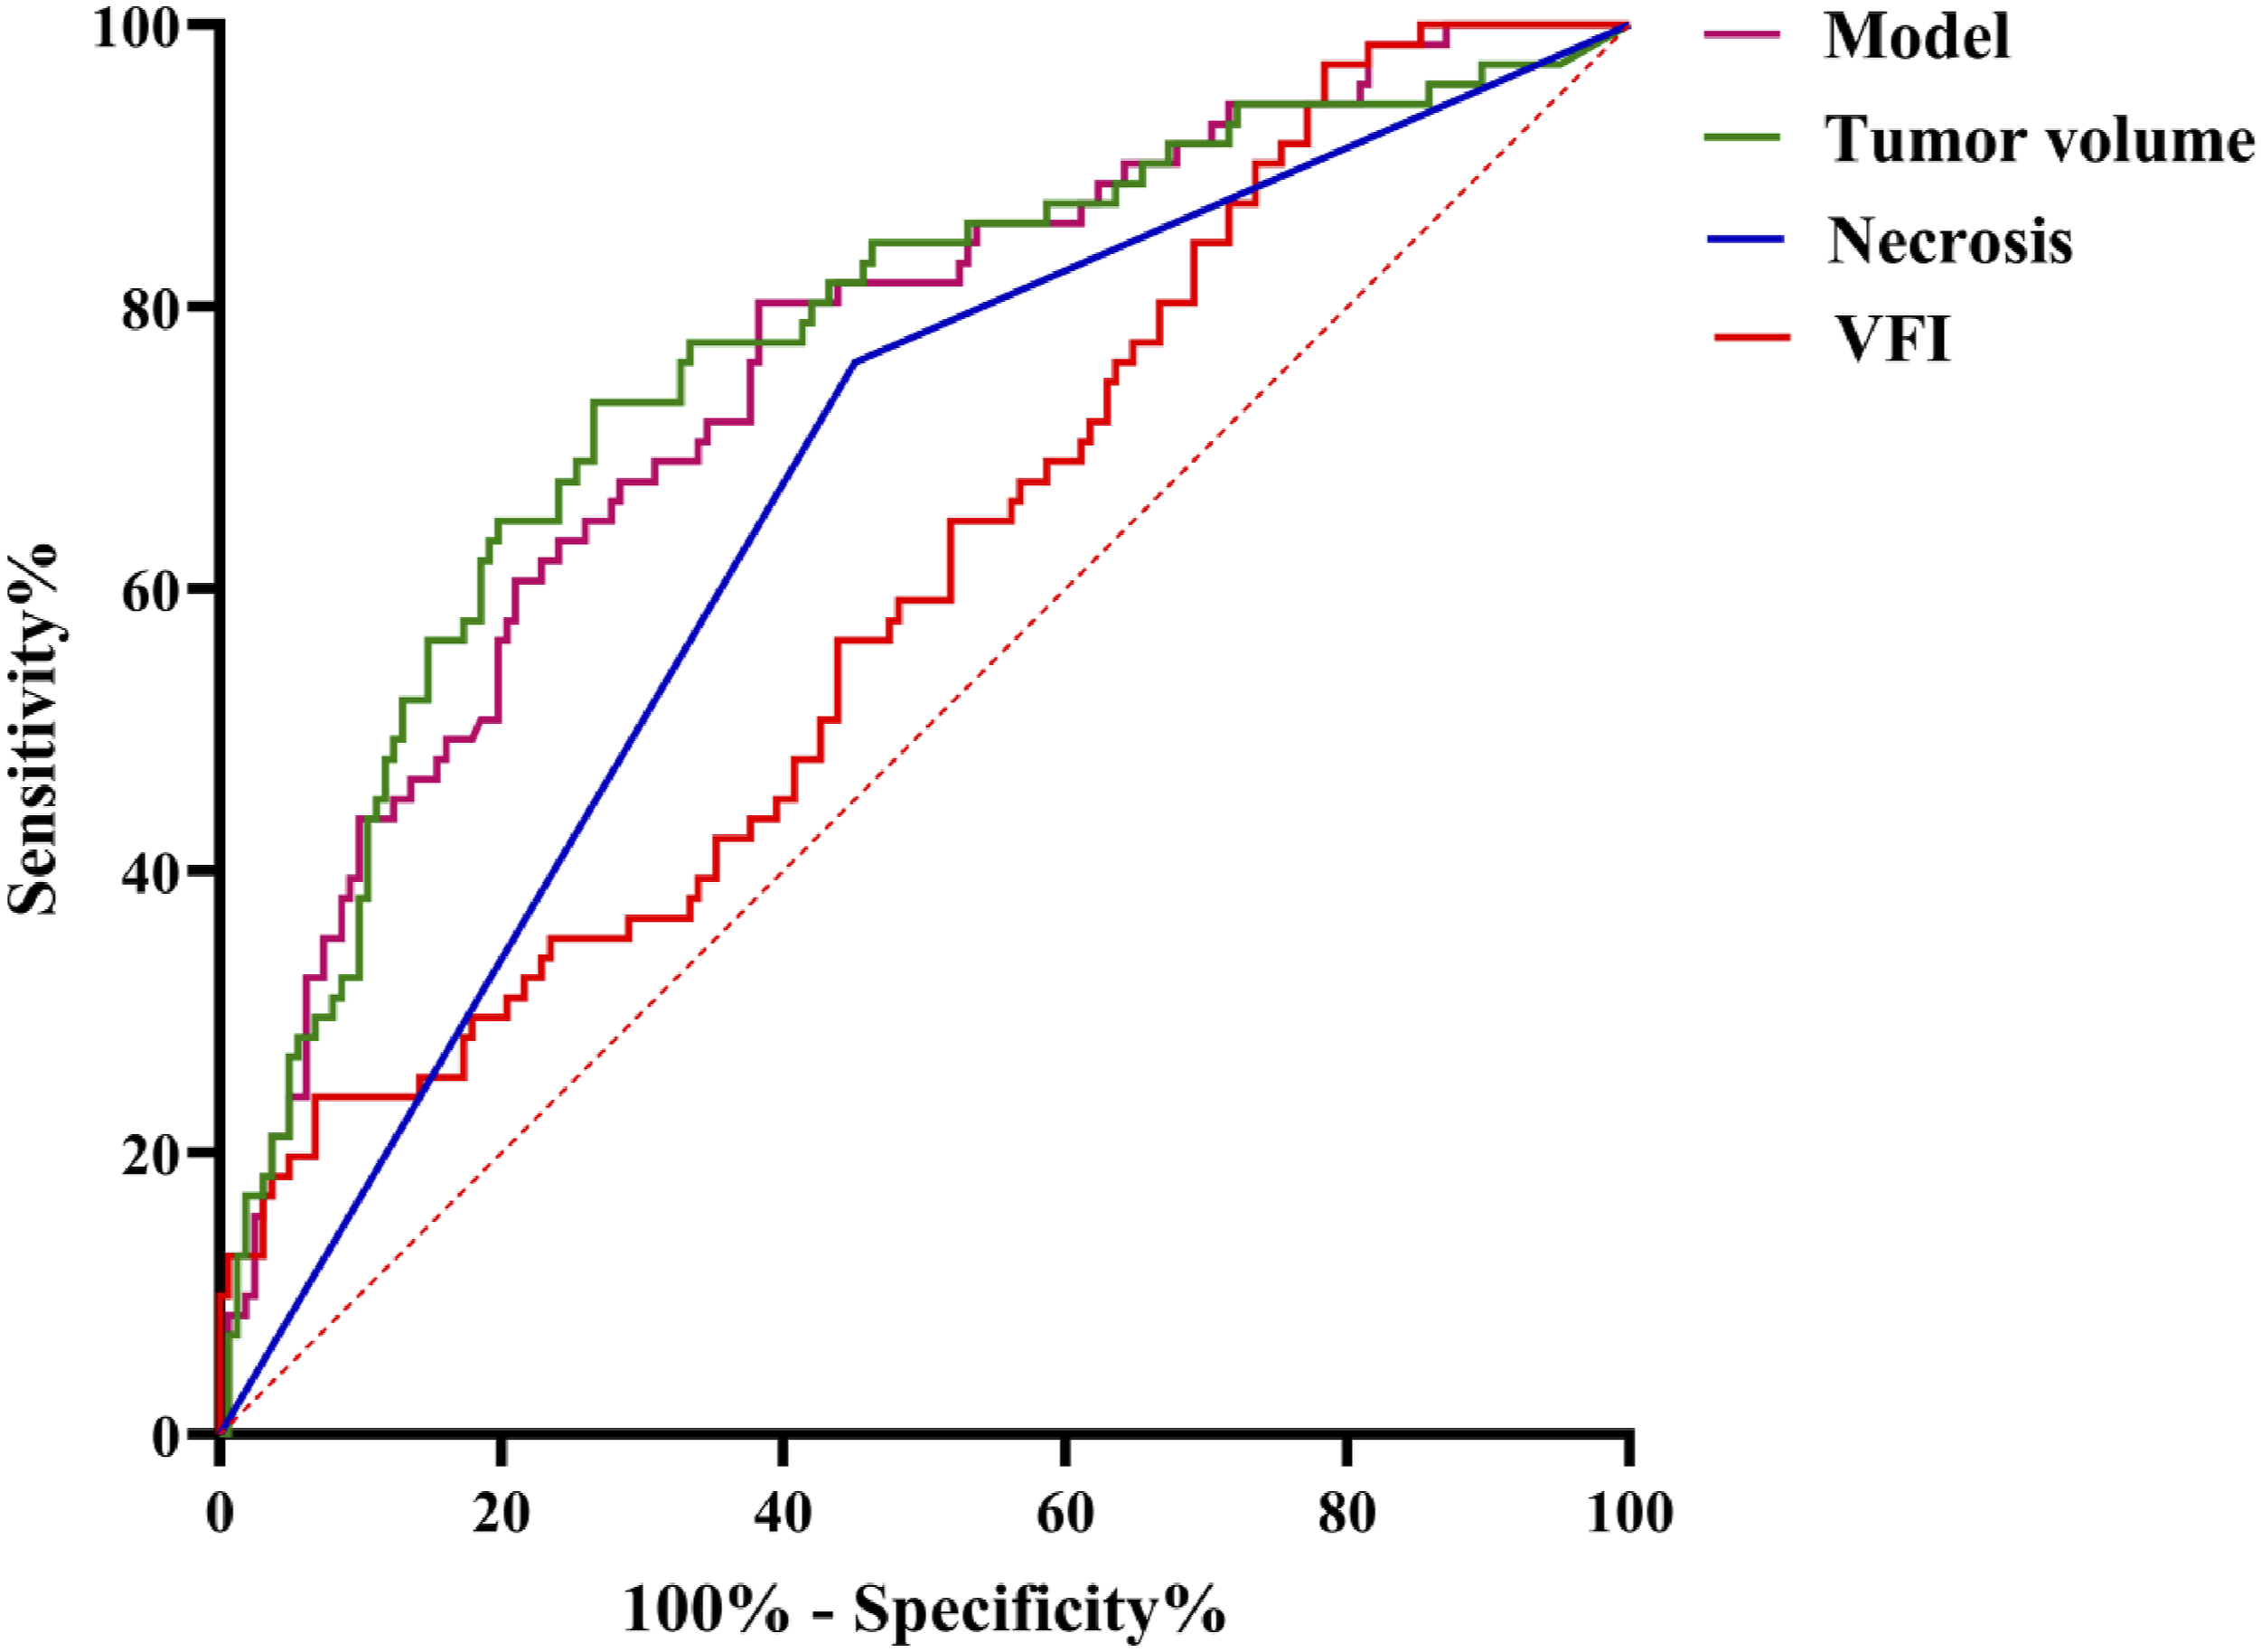
ROC Curve for Risk Prediction Stratified by Different Levels of Danger.
Internal Consistency Testing of the Logistic Regression Model for the Intermediate-High Risk Group
The Hosmer–Lemeshow test demonstrated no statistically significant difference between the intermediate-high risk group occurrence probabilities and the predicted probabilities (χ2 = 5.567, df = 8, P = .696). Additionally, the calibration plot confirmed that the prediction model exhibited excellent agreement with clinical observations (Figure 5). Calibration of the Intermediate-High Risk Group in Logistic Regression Models During Testing.
Clinical Significance of the Test Models
As illustrated in Figure 6, the model developed in this study predicts patients with an intermediate-high risk degree (i.e., threshold probability) that exceeds the two extreme lines across specific intervals (9-65%, 66-67%, and 68-79%). The “All” line represents the decision curve assuming all patients are at intermediate-high risk and thus receive treatment plans for intermediate-high risk prognoses. Conversely, the “None” line assumes all patients are at low risk and do not receive such treatment plans. This finding suggests that using this model to identify patients at medium-to-high risk and implement the corresponding treatment strategies can provide clinical benefits and demonstrate significant practical clinical value. Decision Curve Analysis for Prognostic Prediction in Intermediate-To-High-Risk Patients.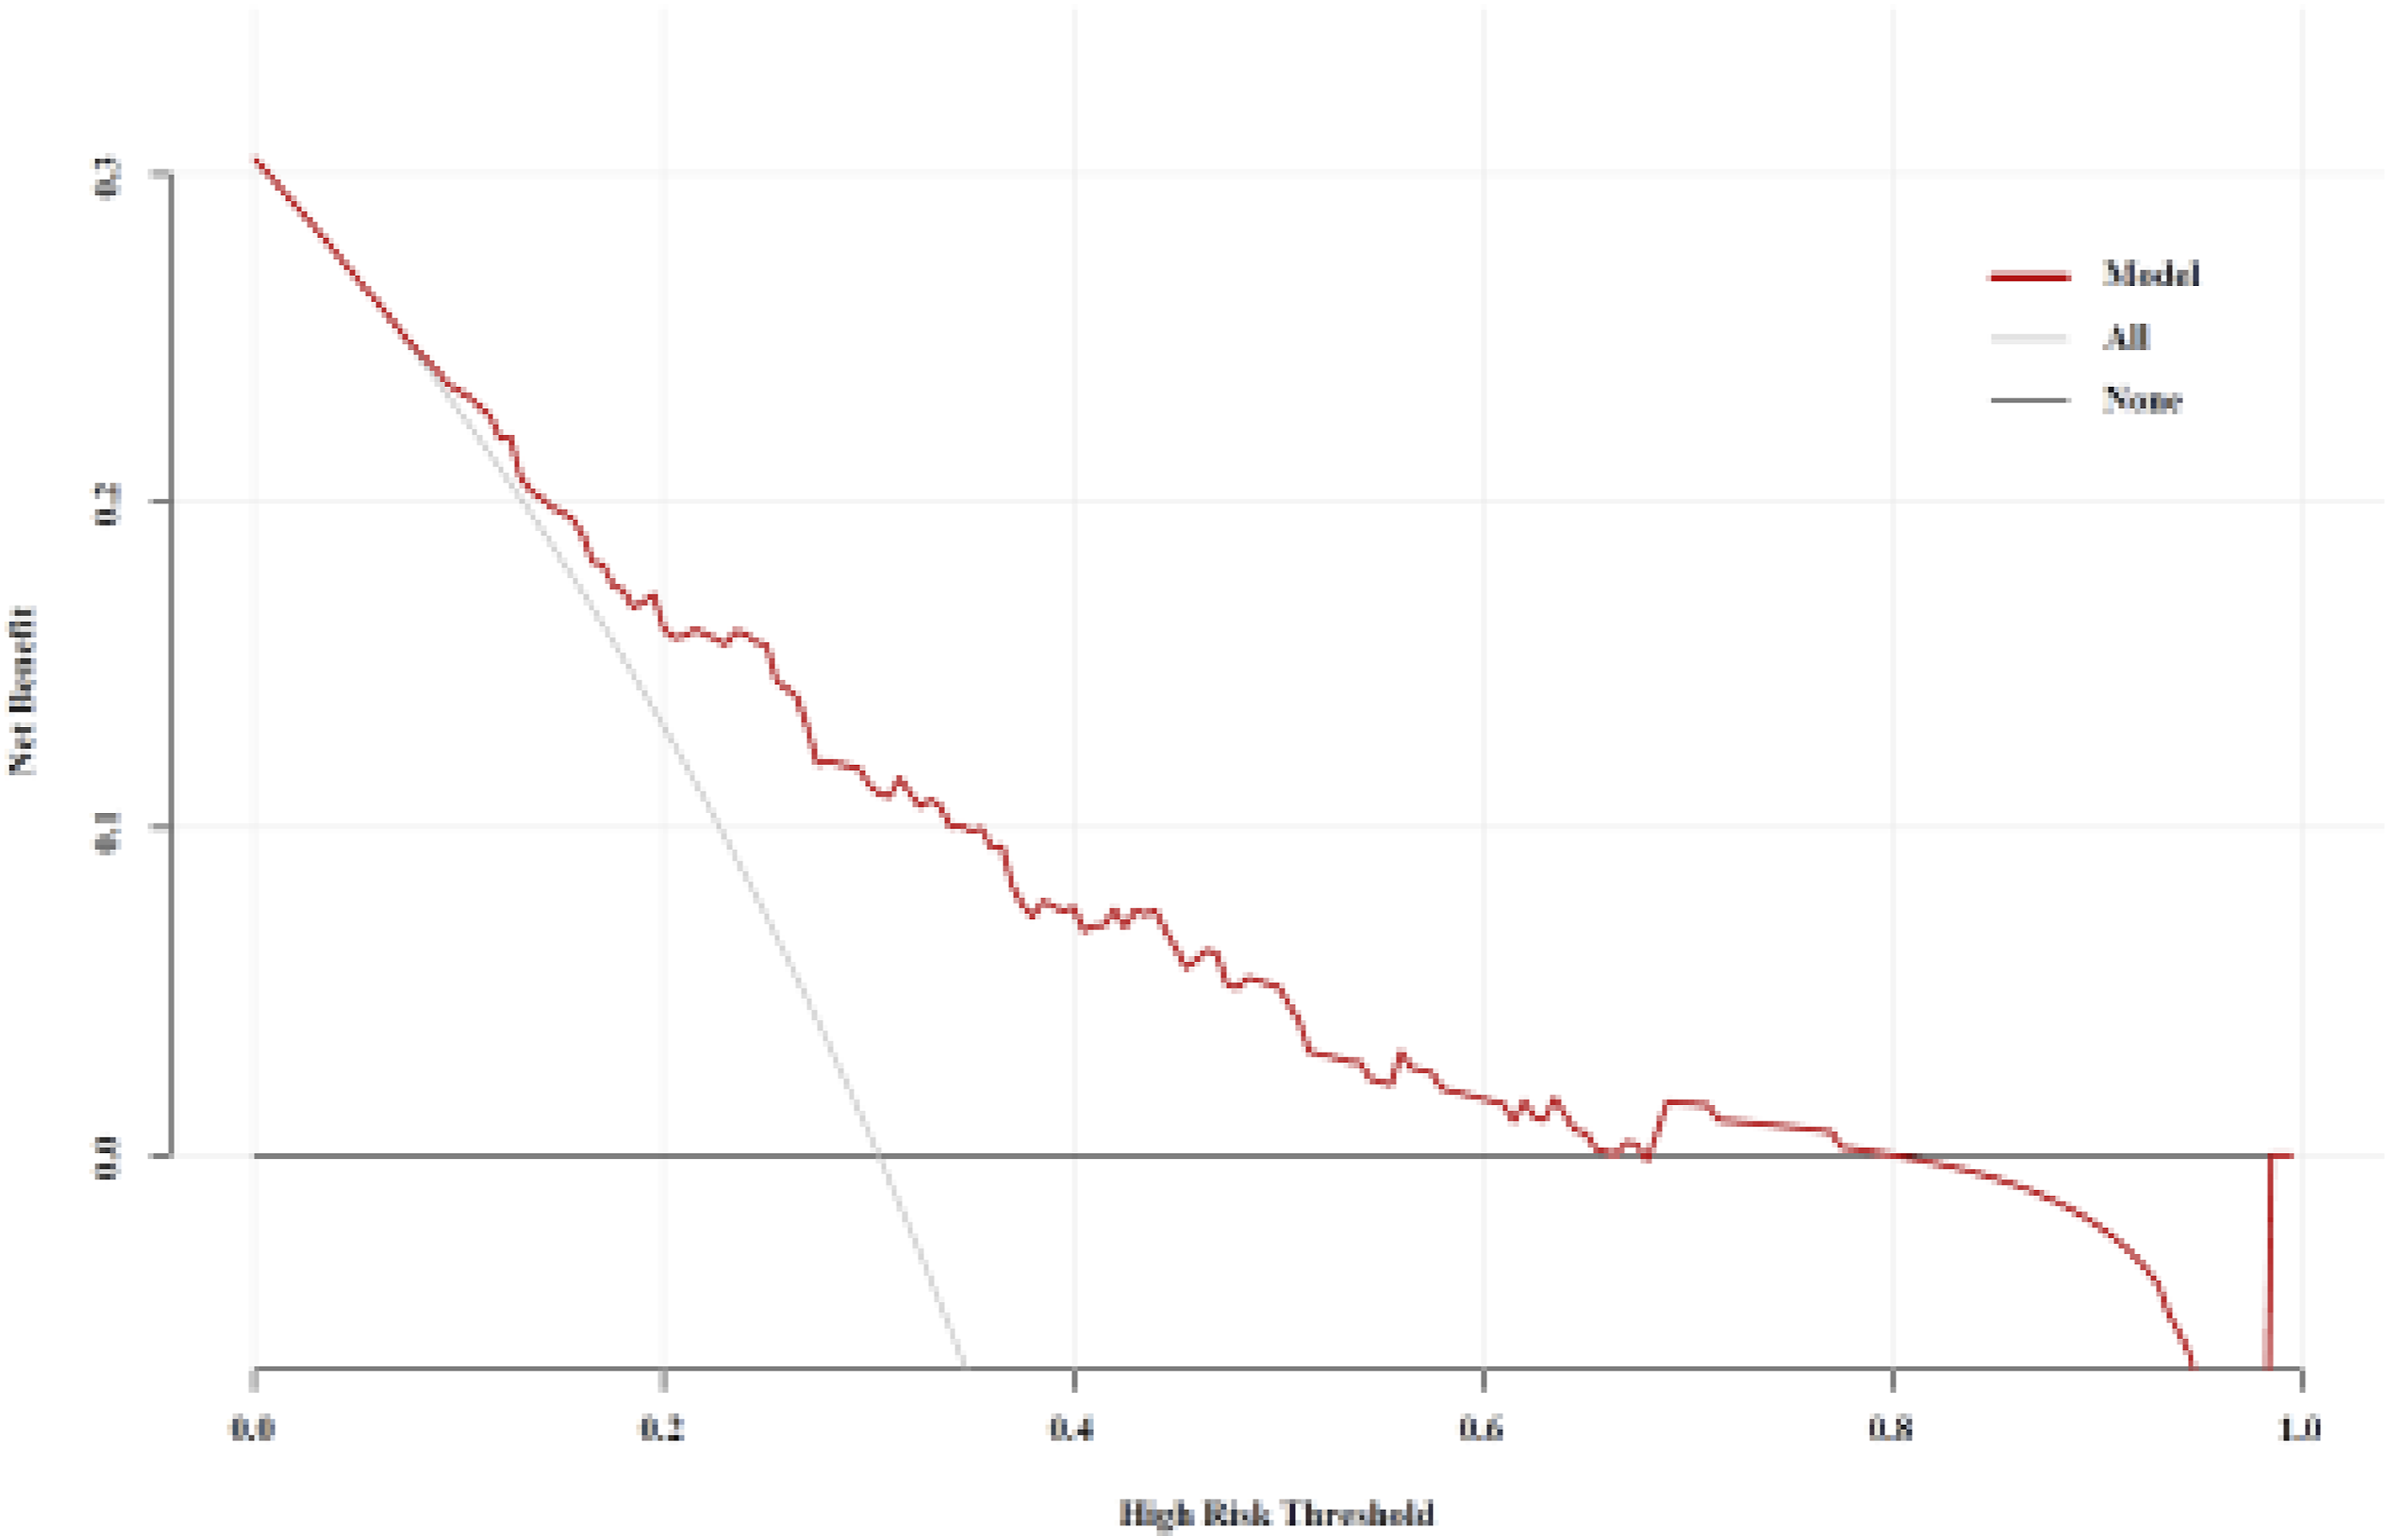
Discussion
Several studies have demonstrated that obesity is linked to the prognosis and occurrence of various cancers, including breast, cervical, prostate, and colorectal cancers. Consequently, visceral fat, which is a more accurate indicator of obesity than BMI, has garnered significant attention in recent studies. Hu et al 15 utilized CT scans to assess visceral fat and found that they exhibited high accuracy in predicting high-grade kidney cancer across different sexes. Park et al 16 reported that the Fuhrman classification of kidney cancer is significantly associated with visceral fat composition. Eide et al 17 reported that a high percentage of visceral adipose tissue volume was associated with high-risk clinical characteristics. Furthermore, the metabolic environment induced by visceral fat promoted the progression of cervical cancer. These studies suggest that the endocrine function of visceral fat and the released inflammatory factors contribute to tumor progression. Additionally, our findings indicate that visceral fat volume is directly proportional to the degree of tumor malignancy. However, none of these studies have examined the impact of visceral fat consumption on tumor progression. Pavlova demonstrated that patients with advanced tumors exhibited lower visceral fat content than those with newly developed tumors, indicating a significant association between visceral fat content and tumor stage. Tumor cells continuously take up various nutrients, including fatty acids, amino acids, and glucose, from their microenvironment to support rapid proliferation. 18 Active visceral fat cells play a crucial role in this context by directly catabolizing fatty acids to meet energy demands, 19 which contributes to a reduction in visceral fat volume.
Harada observed that visceral fat content was negatively correlated with the tumor stage. 20 In the present study, patients in the intermediate-risk group exhibited a lower VFI than those in the low-risk group, which is consistent with Harada’s findings. This discrepancy can be attributed to the rapid proliferation of tumor cells, which necessitates a substantial amount of lipid resources for cell structure formation, thereby leading to increased visceral fat consumption. Cancer-related cachexia is a complex condition characterized by muscle wasting, weight loss, and physical debilitation, which substantially impair the quality of life and health. According to the 2011 consensus definition, cancer-related cachexia is a multifactorial syndrome characterized by the ongoing loss of skeletal muscle mass (with or without loss of fat mass), which cannot be fully reversed by conventional nutritional support, resulting in progressive “functional impairment”. 21 In this study, no statistically significant difference in muscle tissue volume was observed between the two groups, suggesting that the included patients did not progress to cachexia. Additionally, there was no significant difference in the BMI between the groups. These findings indicate that tumor proliferation cannot be visually assessed prior to the onset of cachexia. The amount of intraperitoneal fat is negatively correlated with risk factors, likely because stromal tumor cells in the intermediate-to-high-risk group are highly active and require substantial energy within the microenvironment. Visceral fat serves as the primary source of energy, leading to increased breakdown. Consequently, early CT analysis to determine the visceral fat levels can serve as a predictive indicator of tumor proliferation.
In the NIH grading system, tumor size, necrosis, and rupture status are critical factors for determining tumor grade, and enhanced CT images allow for the precise measurement of tumor size and assessment of tumor necrosis and rupture. However, in clinical practice, some patients do not receive iodine contrast agent injections due to medical contraindications or other factors. Consequently, performing accurate preoperative NIH grading in these patients is particularly challenging.
Our research demonstrates that tumor volume is positively correlated with NIH classification and exhibits the highest specificity among the four models (specificity = 0.735), which aligns with prior research findings. However, its sensitivity was lower than that of the combined model (sensitivity = 0.803) and the VFI model (sensitivity = 0.972). This discrepancy may arise because the boundaries of some tumors are indistinct on plain CT images, leading to an inaccurate assessment of tumor volume. The sensitivity for tumor necrosis was 0.761, surpassing that of the tumor volume model but falling short of that of the combined and VFI models. This could be attributed to the low-density resolution between necrotic areas and solid tumor components on plain CT images, making it challenging to accurately determine whether tumor necrosis had occurred. Our integrated results indicated that plain CT scan images, VFI, tumor volume, and necrosis as three key indicators outperformed individual variables in terms of both sensitivity and specificity for predicting NIH classification. These indicators exhibited relatively high sensitivity and specificity. Therefore, in clinical practice, comprehensively predicting the NIH classification by measuring VFI, tumor volume, and necrosis on plain CT scan images may enhance prediction accuracy and provide valuable guidance for preoperative treatment planning in patients with GIST unsuitable for enhanced CT scans. This approach holds promise for significantly improving patient outcomes and prognoses.
This study had some limitations that warrant consideration. First, this was a retrospective single-center study with a limited sample size, which may have introduced a patient selection bias. Therefore, future studies should include prospective multicenter designs to validate these findings. Second, the implications of our findings on clinical treatment decisions remain unexplored as they were not evaluated in clinical trials. Future research should assess these implications in clinical settings prior to statistical analyses. Finally, this study did not include follow-up data for patients, precluding the evaluation of the impact of the identified factors on patient survival. Further studies that incorporate patient follow-up are necessary to determine the effects of these potential risk factors on patient outcomes.
Conclusion
Our findings demonstrate that NIH grade is inversely correlated with the amount of abdominal visceral fat and directly correlated with tumor volume and necrosis. Considering the comprehensive evaluation of AUC, sensitivity, and specificity, it was determined that the combination of “VFI + tumor volume + necrosis” could effectively predict NIH grade in stromal tumors. This method facilitates clinicians in performing non-invasive and precise risk stratification for GIST patients, including those unable to undergo enhanced CT scans, prior to treatment. This enables the selection of more appropriate treatment strategies tailored to individual patients.
Footnotes
Acknowledgments
We thank all staffs involved in the acquisition of data. We are grateful to all involved cancer patients for their participation to the study.
Ethical Statement
Author Contributions
Conceptualization, Lian-Qin Kuang; Data curation, Wei Chen&Long-Yu Duan; Methodology, Wei Chen&Xiao-Juan Peng; Software, Kun-Ming Yi; Validation, Wei Chen; Writing – original draft, Wei Chen; Writing – review & editing, Lian-Qin Kuang.
Funding
The authors received no financial support for the research, authorship, and/or publication of this article: This study was supported by the incubation program at the Third Affiliated Hospital of Chongqing Medical University, and, Key Disciplines of Chongqing.
Declaration of Conflicting Interests
The authors declared no potential conflicts of interest with respect to the research, authorship, and/or publication of this article.