
Abstract
Introduction
Precision radiotherapy relies on accurate segmentation of tumor targets and organs at risk (OARs). Clinicians manually review automatically delineated structures on a case-by-case basis, a time-consuming process dependent on reviewer experience and alertness. This study proposes a general process for automated threshold generation for structural evaluation indicators and patient-specific quality assurance (QA) for automated segmentation of nasopharyngeal carcinoma (NPC).
Methods
The patient-specific QA process for automated segmentation involves determining the confidence limit and error structure highlight stage. Three expert physicians segmented 17 OARs using computed tomography images of NPC and compared them using the Dice similarity coefficient, the maximum Hausdorff distance, and the mean distance to agreement. For each OAR, the 95% confidence interval was calculated as the confidence limit for each indicator. If two or more evaluation indicators (N2) or one or more evaluation indicators (N1) exceeded the confidence limits, the structure segmentation result was considered abnormal. The quantitative performances of these two methods were compared with those obtained by artificially introducing small/medium and serious errors.
Results
The sensitivity, specificity, balanced accuracy, and F-score values for N2 were 0.944 ± 0.052, 0.827 ± 0.149, 0.886 ± 0.076, and 0.936 ± 0.045, respectively, whereas those for N1 were 0.955 ± 0.045, 0.788 ± 0.189, 0.878 ± 0.096, and 0.948 ± 0.035, respectively. N2 and N1 had small/medium error detection rates of 97.67 ± 0.04% and 98.67 ± 0.04%, respectively, with a serious error detection rate of 100%.
Conclusion
The proposed automated patient-specific QA process effectively detected segmentation abnormalities, particularly serious errors. These are crucial for enhancing review efficiency and automated segmentation, and for improving physician confidence in automated segmentation.
Keywords
Introduction
The accurate segmentation of tumor targets and organs at risk (OARs) is the basis for accurate radiotherapy. With the development of deep learning in radiotherapy, automated segmentation techniques have been widely used in clinical therapy,1-5 demonstrating considerable potential and promoting effects for improving segmentation consistency and efficiency.6-9
In clinical settings, regardless of whether automated segmentation is based on the atlas or deep learning method, after automated segmentation is completed in each case, clinicians perform a patient-specific manual review of all segmented structures to ensure the accuracy of the structures used for the final planning design and treatment. However, a manual review requires a layer-by-layer expert examination of each organ in the image; for example, considering head and neck tumors, approximately 10-20 normal tissue sites of varying sizes exist. Thus, a manual review is a time-consuming process that may induce additional manual errors during the review and modification processes. Furthermore, the review process relies heavily on the availability, experience, and alertness of the independent reviewers. The process is also prone to errors due to limitations in display technology and limited quantitative evaluation tools. 10
Therefore, automated highlighting of the structure, which is deemed incorrect and has to be reviewed, could improve the review efficiency and effectiveness of automated segmentation. 11 One approach is to utilize statistical models or artificial intelligence methods to assess anomalies in the outlined structure by evaluating parameters such as the structure shape, volume, and centroid of the automatically generated outline or by determining the pass criteria of the deep learning model based on the validation set.12-16 However, this approach requires different models for distinct regions and specific structures. Another approach involves a complete segmentation using another set of independent automated segmentations. The results of the primary algorithms are compared with those of the secondary algorithm, and the difference exceeding a predetermined criterion is flagged. 17 However, for different organs, clinically recognized thresholds for distinct evaluation criteria are lacking. 18
In this study, we proposed an automated patient-specific quality assurance (QA) process for nasopharyngeal carcinoma (NPC) with confidence limits for multiple indicators and evaluated its performance.
Methods
Overview of the Automated Patient-specific QA Process
The patient-specific QA process detection workflow involved determining the confidence limit and error structure highlight stage (Figure 1). Workflow of automated segmentation error detection.
Confidence Limit Determination Stage
In the confidence limit determination stage, three expert physicians completed a number of patient cases and then determined the confidence limits for each structure based on comparing the segmentation results.
Thirty volumetric computed tomography (CT) datasets of patients with NPC who underwent radiotherapy using a Philips Brilliance Big Bore CT simulator (Amsterdam, The Netherlands) were randomly selected. The scanning voltage was 140 kV, and the scanning layer thickness was 3 mm. The image size of each layer was 512 × 512 pixels. CT image resolution varied between 0.7 and 1.2 mm in the transverse plane. The number of slices was 90-120. Patient confidentiality was also ensured.
Three expert physicians used the Monaco planning system (V5.11; Elekta AB, Stockholm, Sweden) to segment the CT images. The outlined structures included the brainstem, spinal cord, optical chiasma, optical nerves, parotid glands, lens, eyes, temporal lobes, thyroid gland, oral cavity, pituitary gland, and the larynx. Each OAR was segmented in strict accordance with the Radiation Therapy Oncology Group guidelines. 19
The segmentation results of the three physicians were compared in pairs using MIM (V6.9, MIM Software Inc., Cleveland, OH, USA), and assessment thresholds were established. The comparison parameters included the Dice similarity coefficient (DSC), 20 max Hausdorff distance (HD), 21 and mean distance to agreement (MDA). 22 The 95% confidence interval for each parameter was calculated; the lower limit of the interval was used for DSC, whereas the upper limit was used for HD and MDA. Each confidence limit was obtained for all the OARs with left-right symmetry (the optic nerve, parotid gland, lens, eye, and temporal lobe).These limits were used as default thresholds to compare the results of the two independent automated segmentations.
Automated Error Structure Highlight Stage
After the confidence limit determination stage, the automated error structure highlight stage is performed. To complete this stage, two independent segmentation systems must delineate the same set of CT images. The comparison indicators were DSC, HD, and MDA. Indicators exceeding the confidence limits were used as warning indicators. When the number of warning indicators was greater than or equal to N, the structure segmentation was highlighted as abnormal.
Testing and Quantitative Evaluation
Testing Data Sets and Ground Truth
To test the performance of the workflow presented in this study, CT images of 15 patients with NPC that were completely independent, as described in Section A.1, were used for testing. Three expert physicians independently delineated the structures manually. The average manually delineated structures were used as benchmark structures for the subsequent automated segmentation evaluation (ground truth). The benchmark structures were created by the majority vote of the three physicians manually delineated structures. The probability of each pixel in the image is determined according to each contour. When the owning probability exceeded 50%, the current pixel was determined to have the owning structure.
Independent Segmentation Results
We anticipate that applying the workflow to a secondary independent auto-segmentation tool can help detect possible errors in primary auto-segmentation by computing the geometric similarity. We introduced two independent automated segmentation systems to complete the automated segmentation for the test data set. Two deep learning-based automated segmentation systems, PV-iCurve (V4.5, PVmed, Guangzhou, China) (hereafter referred to as System A) and Smart-U (V1.1.0, Raydose Medical Technology Co. Ltd., Guangzhou, China) (referred to as System B) were used in this study.
The two systems used in the present study are described as follows: (1) PV-iCurve (V4.5, PVmed, China): Overall, 139 independent CT series with manual contours were collected from 139 patients with NPC. All CT images were clipped to a range of [WL-WW/2, WL+WW/2], followed by normalization to [−1, 1], where WW and WL indicated window width and window level, respectively. All the patients (139) were randomly assigned to the training and testing groups. During training, 10% of the training set was randomly divided into inner validation datasets to prevent overfitting. Data augmentation, including translation, rotation, and noise addition were employed, resulting in 360 three-dimensional images for model training. A five-fold cross-validation was performed to obtain an approximate prediction probability for the training data.
23
(2) Smart-U (V1.1.0, Guangzhou Raydose Medical Technology Co. Ltd., China): Independent CT sequences were collected from 119 patients with NPC. An AdamW
24
optimizer was used to train the convolutional neural network (CNN). The training batch size was set to two, and the OneCycleLR learning rate scheduler was employed,
25
with maximum and minimum learning rates of 0.001 and 1, respectively. A cosine annealing strategy was adopted for learning rate adjustment, with step size defined per sample. The models underwent 80 training epochs, and parameters were updated according to the minimum loss value of the evaluation set. The model architecture was based on a three-dimensional V-net,
26
with a 1 × 1 × 1 convolution kernel applied in the last layer and softmax as the activation function. The number of layers in the eigenvalue image was reduced to eight for the output.
The training data of both systems were collected from the same institute, and expert physicians reviewed all training data based on the Radiation Therapy Oncology Group guidelines. 19 The training cases for the two systems did not overlap. The commissioning process was based on previous studies.11,27 The commissioning process for both systems was completed before they were used in the clinics.
Introduction of Small/Medium Errors in Different Structures.

Method for Introducing Serious Delineation Errors.

Quantitative Evaluation
Quantitative evaluation indices included sensitivity, specificity, balanced accuracy (BA), and F-score.
12
Regarding sensitivity, a higher value indicates a more effective detection of positive individuals. Regarding specificity, a higher value indicated more effective detection of negative individuals. BA quantifies the system’s ability to prevent false classifications (including false positives and negatives). The F-score represents the harmonic mean of precision and recall. Comprehensively evaluating the precision and recall results, a higher score indicates a higher positive effect of model detection and a lower probability of false positives and false negatives. The parameters were calculated as follows:


In this study, all the structures of System C were defined as errors. The structures of Systems A and B were compared to the benchmark structures. If the indicators exceeded the confidence limit, the structures were defined as errors, and the opposite was defined as correct.
The results of System C were compared with those of Systems A and B. To get closer to the clinical application scenario, Systems A and B were compared with each other. The two system results were compared (A vs B, A vs C, and B vs C). A true positive represents an error contour that is highlighted as an error. Similar definitions were used for TN, FP, and FN. The key raw results in this study have been successfully uploaded and locked onto the Research Data Deposit platform. This study was approved by the Institutional Review Board of the Sun Yat-sen University Cancer Center in accordance with the Good Clinical Practice guidelines of the International Council for Harmonisation of Technical Requirements for Pharmaceuticals for Human Use, government regulations, and national legislature (approval number: YB2018-06). The requirement for patient consent was waived due to the retrospective nature of the study. All patient details were de-identified. The reporting of this study conforms to the STROBE guidelines. 29
Results
Determination of Confidence Limits according to Expert Segmentation
Confidence Limits of Different Indicators Determined by Three Expert Physicians.
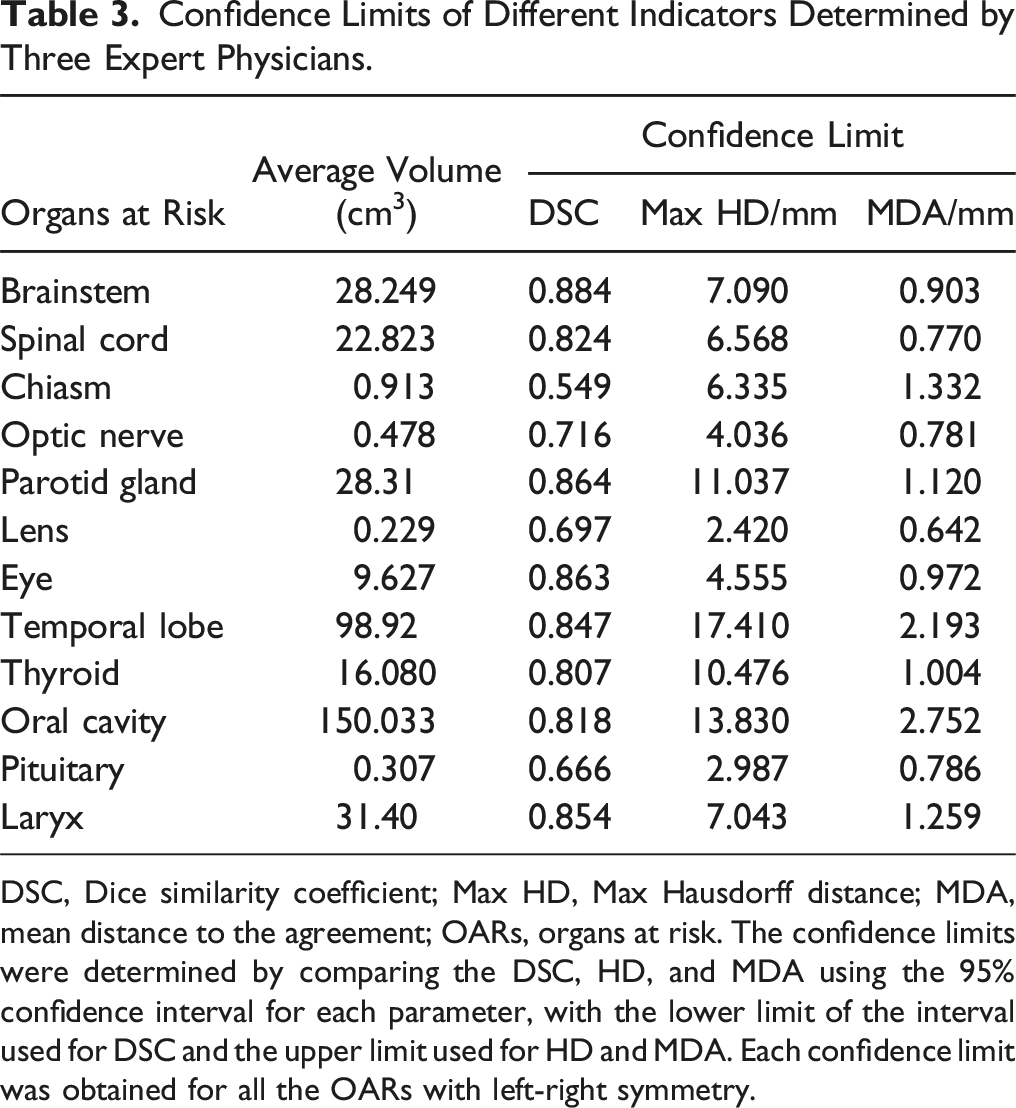
DSC, Dice similarity coefficient; Max HD, Max Hausdorff distance; MDA, mean distance to the agreement; OARs, organs at risk. The confidence limits were determined by comparing the DSC, HD, and MDA using the 95% confidence interval for each parameter, with the lower limit of the interval used for DSC and the upper limit used for HD and MDA. Each confidence limit was obtained for all the OARs with left-right symmetry.
Quantitative Analysis of the Automated Workflow
Systems A, B, and C were compared in pairs. When the number of warning indicators was greater than or equal to N, the structure segmentation was highlighted as abnormal. Sensitivity, specificity, BA, and F-score were used to quantitatively evaluate the workflow, with N = 2 (two or more evaluation indicators exceeding the confidence limits [N2]) and N = 1 (one or more evaluation indicators exceeding the confidence limits [N1]).
Sensitivity, Specificity, BA, and F-Score Values for N2 for Different Organs at Risk.

For N2, when two or more evaluation indicators exceeded the confidence limit, the structural segmentation was deemed abnormal. Quantitative evaluation indices included sensitivity, specificity, balanced accuracy (BA), and F-score.
Sensitivity, Specificity, BA, and F-Score Values for N1 for Different Organs at Risk.
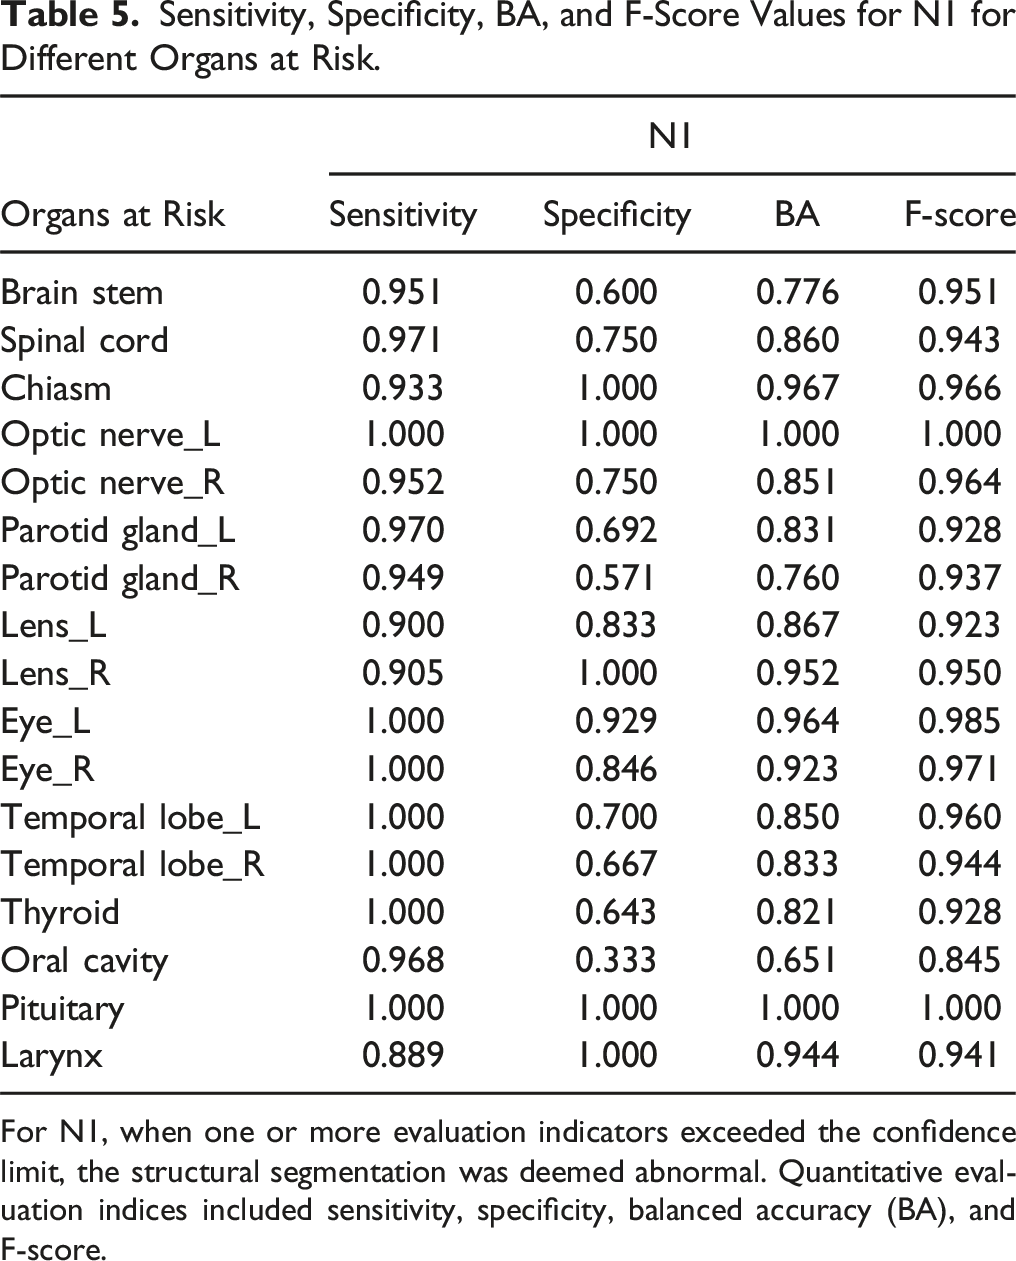
For N1, when one or more evaluation indicators exceeded the confidence limit, the structural segmentation was deemed abnormal. Quantitative evaluation indices included sensitivity, specificity, balanced accuracy (BA), and F-score.
Small/Medium and Serious Error Detection Effect
The results of system C were compared with those of systems A and B to evaluate the ability of the proposed workflow to detect errors. Both N1 and N2 exhibited high error detection rates of 100%. Figure 2 shows the detection rates of N1 and N2 for small/medium errors. N1 exhibited a higher average detection rate (98.67 ± 0.04%) than N2 (97.67 ± 0.04%). Detection rates of N2 and N1 for small/medium errors. Blue indicates N2, and orange indicates N1.
Discussion
Automatic evaluation of the quality of automated segmentation is a complex and challenging task. For different OARs, the sensitivity tends to vary owing to differences in organ size, shape, and geometric indicators. For example, the volume-based overlap of DSC is insensitive to the structural edges, particularly in large organs. Differences in distances between organ boundaries vary with size. Therefore, there is no accepted threshold value for comparison indicators of common geometric structures. 18 Based on previous interobserver and contouring studies, Dijk et al. have reported DSC and HD reference values for the glandular, central nervous system, upper digestive tract, and airway-related organs and graded them from “very poor” to “good.” However, when assessing an item, “Would you correct the contour” of different organs, using a questionnaire, a certain degree of difference was potentially introduced between the evaluation reference value of “very poor” and “good.” 30
In this study, we propose an automated patient-specific QA with a secondary independent automated segmentation system to detect possible errors in the primary automated segmentation system by computing the geometric similarity between them. We also propose setting the confidence limit with a 95% confidence interval as the threshold to achieve more quantitative indicators. By comparing the results and differences drawn independently by different experts, this method effectively provides a general workflow for establishing the threshold values for each structure and specific indicator. Furthermore, the confidence limit can be used as an indicator for commissioning/QA of auto-segmentation software.
In our proposed approach, confidence limits were determined by three expert physicians who segmented 17 OARs using CT images of patients with NPC and compared them using DSC, HD, and MDA. Regarding the 95% confidence interval for each parameter, the lower limit was used for DSC, whereas the upper limit was used for HD and MDA. Men et al. proposed another approach to determine the confidence limits based on the geometric indicators, DSC and HD, of the CNN model for the results of the validation set and used them as the QA decision criteria for tests. 16
We adopted DSC, HD, and MDA as parameters for the assessment of structural differences because they represent volumetric overlap metrics, maximal and average boundary distances. Notably, volumetric overlap and distance metrics are often not highly correlated and are potentially complementary. 7 Regarding alternate parameters for updating the comparison structure, the described process can also be used to generate the corresponding evaluation threshold. Furthermore, we evaluated the performance of abnormal early warning indicators N1 and N2. N1 exhibited greater sensitivity in error- and anomaly-detection than N2. Regarding small/medium errors, the average detection efficiency of N1 (98.67 ± 0.04%) was higher than that of N2 (97.67 ± 0.04%). However, oversensitivity has been observed in certain organs, resulting in a false-positive specificity. The average specificity of N1 (0.788) was lower than that of N2 (0.827). Different models exhibit different sensitivities for error detection. For critical OARs, the higher sensitivity of N1 may help prevent missing-error detection. For other OARs, N2 can be used to avoid over-sensitivity.
Given the robustness of the model in the automated segmentation process, segmentation exceptions can occasionally occur at varying degrees, such as a missing structure of a certain layer or segmentation beyond the boundary, numerous garbage spots, and small/medium errors, including significantly large or small segmentation structures.11,13,14 These errors should be detected during the QA phase, and the user should be reminded to fix them. Serious errors can have a marked clinical impact. For example, garbage spot errors can greatly impact small-volume structures such as lenses. Therefore, an additional QA test is necessary. Based on our findings, this process can detect 100% of serious errors regardless of the presence of N1 or N2. However, the workflow proposed in this study can only detect errors in segmentation and highlight structures. However, these errors cannot be corrected automatically. Notably, several vendors, including MIM and other TPSs, provide a post-processing function to fix garbage spots. In future work, combining the proposed method with other vendors to detect and correct the errors could improve clinical effectiveness.
During testing, three expert physicians independently delineated the structures manually. The average of these manually delineated structures was used as the benchmark for subsequent automated segmentation evaluation (ground truth). Benchmark structures were established based on the majority vote of the three physicians to minimize the impact of inter-observer variability on the results. However, for some structures with unclear boundaries on CT, such as the temporal lobe, substantial variability was observed among the experts. The confidence limit determined by HD for these structures was relatively high (17 mm). Despite this, comparisons between the contours generated by observers and those produced by automated segmentation suggest that automated segmentation is approaching the level of interobserver variability for these OARs. Furthermore, in tests where errors were introduced, the QA process present in the study effectively detected these errors.
We focused on NPC, which involves numerous OARs for segmentation and has one of the highest levels of complexity among radiotherapy-treated diseases. However, considering the numerous NPC tissues, manual reviews are relatively time-consuming and are more likely to induce additional manual errors. Therefore, independent tests for automated segmentation are valuable for clinical applications. However, the patient-specific QA process for automated segmentation and the proposed confidence limit for the metrics indicate that the outlined structure is universal and can be broadly applied to several other diseases, including those involving the oropharyngeal region.
The effects on schedule optimization and final dose distribution are distinct for several auto-segmented normal tissues, with considerable differences.3,31 In the present study, only geometric indices, such as DSC, HD, and MDA, were used. Dosimetric endpoints were not included in this study. This study has one limitation: geometric indices may not always accurately reflect spatial variations in contouring that could lead to meaningful changes in the delivered radiation dose. The workflow in this study applied equal weights to all OARs without considering the distance to the tumor. If dosimetric endpoints are considered, the workflow can automatically set different weighting factors to different organs. Regarding NPC, organs such as the brainstem, spinal cord, optic nerves, optic chiasma, pituitary gland, parotid glands, temporal lobes, and other organs closer to or overlapping the tumor area were assigned a weighting factor ≥100%. Regarding the extended distance from the tumor and high-dose distribution, the weights for organs such as the lens, eyes, oral cavity, thyroid gland, and other organs were set to ˂100%. Different models exhibit different sensitivities for error detection. For example, N1, with its higher sensitivity, may be more suitable for critical OARs to avoid missing-error detection. For other OARs, N2 can be used to avoid over-sensitivity. In future studies, the treatment plans and structures should be combined. These measures will further reduce the potential errors in automated segmentation and their impact on the final dose distribution, thereby facilitating secure automation.
Conclusions
In this study, an automated patient-specific QA process was proposed based on two sets of independent automated segmentation systems. DSC, HD, and MDA were used to compare and evaluate the segmentation results of the two systems, establish a confidence limit parameter to determine whether the structure was abnormal, and perform the next action. These methods effectively detect segmentation abnormalities, particularly serious errors, which are of considerable importance for clinicians to enhance the review efficiency and effect of automated segmentation and to improve confidence while utilizing automated segmentation technology. This strategy provides a good starting point for realizing a high degree of automated planning for future clinical workflow.
Supplemental Material
Supplemental Material - Automated Patient-specific Quality Assurance for Automated Segmentation of Organs at Risk in Nasopharyngeal Carcinoma Radiotherapy
Supplemental Material for Automated Patient-specific Quality Assurance for Automated Segmentation of Organs at Risk in Nasopharyngeal Carcinoma Radiotherapy by Yixuan Wang, Jiang Hu, Lixin Chen, Dandan Zhang and Jinhan Zhu in Cancer Control.
Footnotes
Author Contributions
YW: Writing – original draft, formal analysis, investigation; JH: Writing – review and editing, investigation, Resources; LC: Writing – review and editing, project administration; DZ: Writing – review and editing, validation, funding acquisition; JZ: Writing – review and editing, conceptualization, methodology, funding acquisition.
Declaration of Conflicting Interests
The author(s) declared no potential conflicts of interest with respect to the research, authorship, and/or publication of this article.
Funding
The author(s) disclosed receipt of the following financial support for the research, authorship, and/or publication of this article: This study was supported by the National Natural Science Foundation of China (Numbers 12005315 and 11905303).
Ethical Statement
Supplemental Material
Supplemental material for this article is available online.
Appendix
References
Supplementary Material
Please find the following supplemental material available below.
For Open Access articles published under a Creative Commons License, all supplemental material carries the same license as the article it is associated with.
For non-Open Access articles published, all supplemental material carries a non-exclusive license, and permission requests for re-use of supplemental material or any part of supplemental material shall be sent directly to the copyright owner as specified in the copyright notice associated with the article.