
Abstract
Background
Immune-based therapies are commonly employed to combat hepatocellular carcinoma (HCC). However, the presence of immune-regulating elements, especially regulatory T cells (Tregs), can dramatically impact the treatment efficacy. A deeper examination of the immune-regulation mechanisms linked to these inhibitory factors and their impact on HCC patient outcomes is warranted.
Methods
We employed multicolor fluorescence immunohistochemistry (mIHC) to stain Foxp3, cytokeratin, and nuclei on an HCC tissue microarray (TMA). Leveraging liver cancer transcriptome data from TCGA, we built a prognostic model focused on Treg-associated gene sets and represented it with a nomogram. We then sourced liver cancer single-cell RNA sequencing data (GSE140228) from the GEO database, selectively focusing on Treg subsets, and conducted further analyses, including cell-to-cell communication and pseudo-time trajectory examination.
Results
Our mIHC results revealed a more substantial presence of Foxp3+Tregs in HCC samples than in adjacent normal tissue samples (P < .001). An increased presence of Foxp3+Tregs in HCC samples correlated with unfavorable patient outcomes (HR = 1.722, 95% CI:1.023-2.899, P = .041). The multi-factorial prognosis model we built from TCGA liver cancer data highlighted Tregs as a standalone risk determinant for predicting outcomes (HR = 3.84, 95% CI:2.52-5.83, P < .001). Re-analyzing the scRNA-seq dataset (GSE140228) showcased distinctive gene expression patterns in Tregs from varying tissues. Interactions between Tregs and other CD4+T cell types were predominantly governed by the CXCL13/CXCR3 signaling pathway. Communication pathways between Tregs and macrophages primarily involved MIF-CD74/CXCR4, LGALS9/CD45, and PTPRC/MRC1. Additionally, macrophages could influence Tregs via HLA-class II and CD4 interactions.
Conclusion
An elevated presence of Tregs in HCC samples correlated with negative patient outcomes. Elucidating the interplay between Tregs and other immune cells in HCC could provide insights into the modulatory role of Tregs within HCC tissues.
Keywords
Introduction
Hepatocellular carcinoma (HCC) represents about 85% of all primary liver cancers and continues to be a leading cause of cancer-related fatalities globally.1-3 Over recent years, apart from traditional treatments like surgery, chemotherapy, and targeted interventions, immunotherapy and even integrated treatment approaches have gained traction in combating HCC. 2 Notably, therapies involving immune-checkpoint inhibitors (ICIs) and adoptive T cell transfers, such as chimeric antigen receptors and TCR-modified T cells, have shown promising clinical results.4-6 Yet, given HCC’s highly aggressive and metastatic tendencies, the relapse frequency remains elevated, and post-surgery survival rates for HCC patients are still unsatisfactory.2,7
From studies analyzing the immune composition of the tumor microenvironment (TME) in human HCC, it’s evident that inhibitory elements like regulatory T cells (Tregs), MDSCs, and M2-type macrophages pose significant challenges for patients with HCC trying to benefit from immunotherapies.8-11 Thus, it remains imperative to deeply probe the immune-regulatory matrix involving these inhibitory elements and assess their effects on the clinical trajectories of human HCC patients. Tregs are pivotal in upholding immune balance within the host and facilitating tumor immune evasion. 12 Broadly, fork-head box protein P3 (Foxp3)+Tregs can be categorized into thymus-originated Tregs (tTregs), TGF-β-induced Treg (iTreg), and those that arise outside the thymus at peripheral locations (pTregs). 13 While these Tregs exhibit similarities in their immune-dampening roles and express common crucial factors (eg, Foxp3, CD25, CTLA-4, GITR, IL-10, and TGF-β), they also showcase distinct traits in self-stability maintenance and modulating the immune milieu. 14
Our previous research and findings from other studies indicate that Tregs tend to amass in a variety of solid malignancies. This includes esophagus, stomach, intestines, and liver cancers. These Tregs play a role in mediating immunosuppression within the TME, fostering intra-tumor angiogenesis, and accelerating tumor growth, and are often linked with worse outcomes for cancer patients.15-17 The immunosuppressive mechanisms orchestrated by these tumor-infiltrating Tregs within the TME can be segmented into 3 primary dimensions. First, Tregs have been observed to express high levels of the IL-2 receptor IL-2Rα. This allows them to competitively bind to IL-2, which in turn suppresses T cell metabolism and growth, subsequently boosting the self-destruction of these activated T cells. 18 Second, Tregs are capable of secreting a range of inhibitory cytokines, including IL-10, IL-35, and TGF-β. Furthermore, they can curtail MHC-II expression on antigen-presenting cells (APCs). Such actions result in both the impairment of T cell functionality and a reduction in tumor-penetrating T cells. 18 Third, these Tregs often exhibit high levels of immunosuppressive checkpoint molecules, such as PD-1, TIM-3, CTLA-4, CD39, and LAG-3. These molecules act to suppress the maturity of dendritic cells and their ability to present antigens. 17
Currently, immunotherapy strategies targeting Tregs primarily concentrate on the specific Tregs within the TME, particularly the tissue-resident Tregs. 19 Yet, it’s worth noting that allowing Tregs to remain in regular tissues (like lymph nodes or other peripheral immune structures) is crucial, as they play a vital role in averting autoimmune disorders and minimizing the side effects associated with immunotherapy. 19 In our current research, we found that the presence of infiltrating Tregs could serve as a crucial prognostic indicator for human HCC. Furthermore, we utilized publicly available single-cell transcriptomic datasets to uncover cellular operations and interactions. These findings helped us further unravel the immunosuppressive influence of infiltrating Tregs within the TME of HCC.
Materials and Methods
Patients and Tissue Specimens
The Correlation Between Numbers of Infiltrating Tregs and Clinical Features of the Patients.
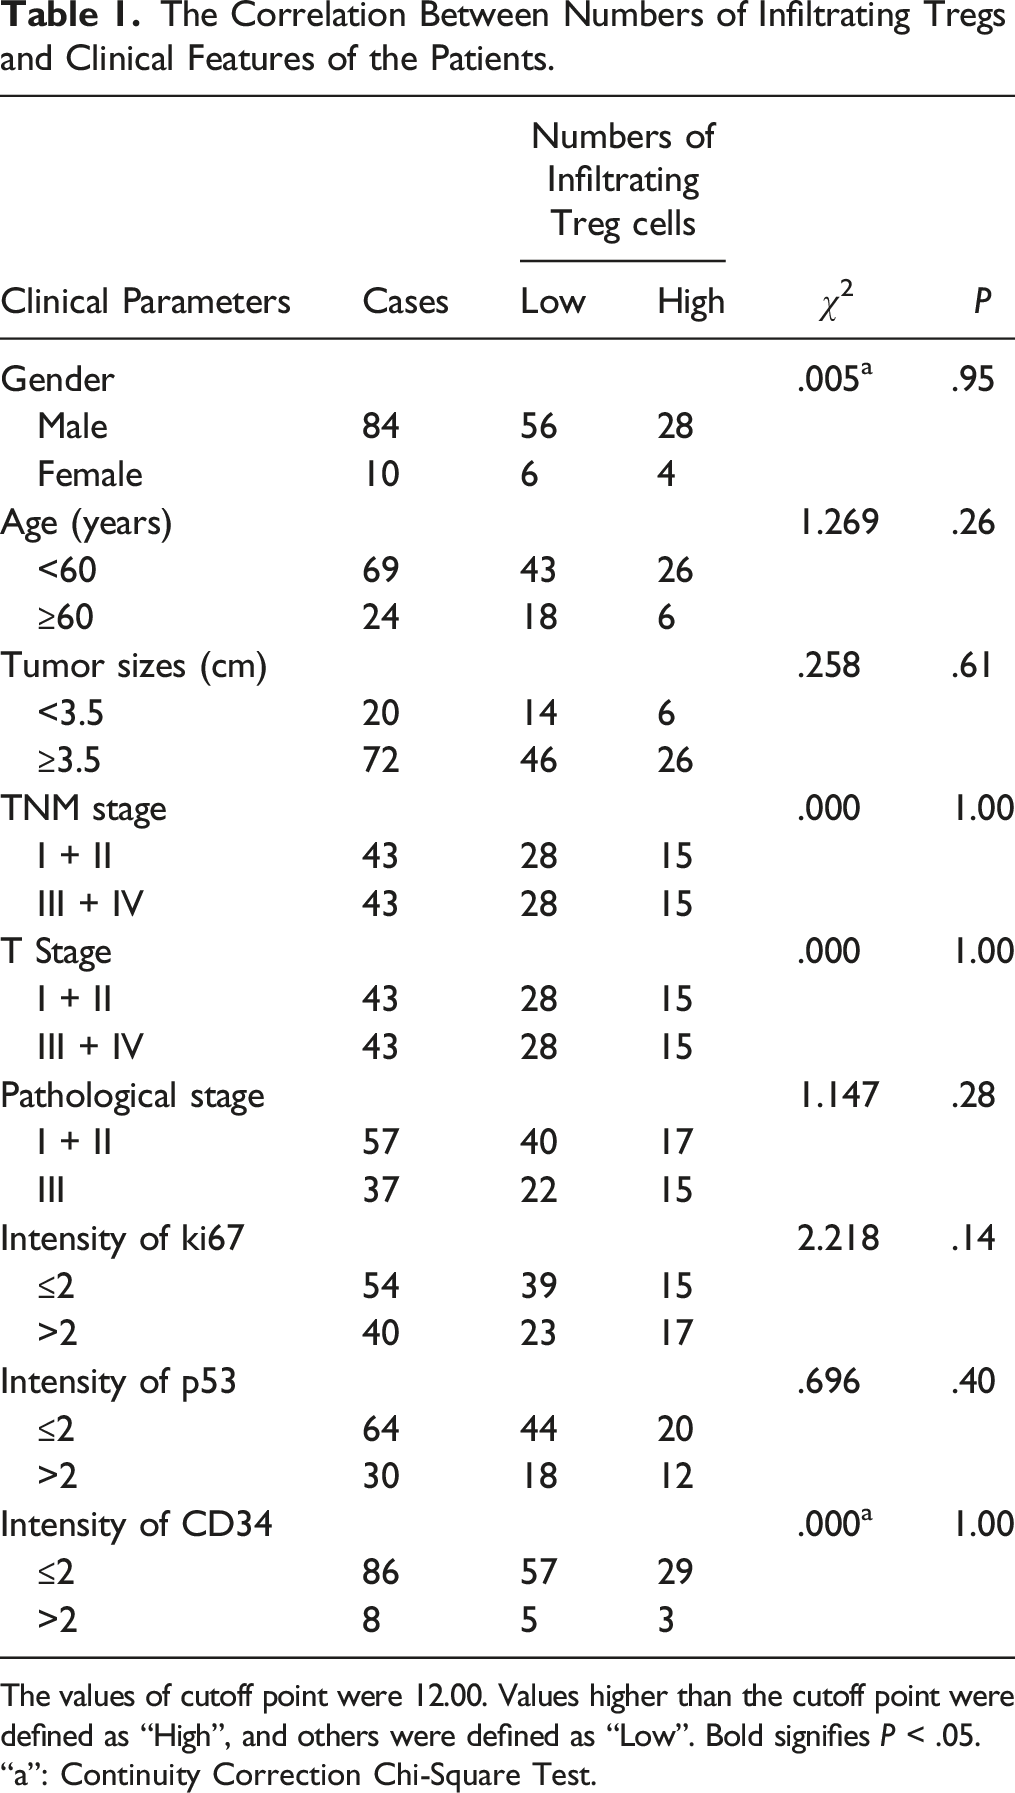
The values of cutoff point were 12.00. Values higher than the cutoff point were defined as “High”, and others were defined as “Low”. Bold signifies P < .05.
“a”: Continuity Correction Chi-Square Test.
Multicolor Immunohistochemistry (mIHC)
The mIHC was conducted utilizing the Opal 5-color fluorescent IHC kit (product number NEL811001 KT, PerkinElmer, USA), paired with automated quantitative analysis tools provided by PerkinElmer, USA. This process followed the guidelines given by the manufacturer and as previously outlined in references.20,21 Briefly, cytokeratin (CK), Foxp3, and 4′,6-diamidino-2-phenylindole (DAPI) were employed to pinpoint epithelial cells, Tregs, and nuclei, respectively. The primary antibodies involved were anti-Foxp3 (at a 1:500 dilution, product number ab4728, sourced from Abcam, Cambridge) and anti-CK (at a 1:2 dilution, product number PA125, procured from BioDot, USA). During the secondary antibody staining phase, the HCC TMA slides underwent incubation with HRP-linked secondary antibodies (from PerkinElmer, USA) present in the Opal working solution (also by PerkinElmer, USA). Subsequently, the slides were sealed using the ProLong Diamond Antifade Reagent containing DAPI (Thermofisher, USA).
Survival and Multivariate Cox’s Model Analysis
By employing the surv_cutpoint () function within the R package survminer, cutoff values were established for each subset within the HCC TMA. Subsequently, these subsets were divided into 2 groups: ‘Low’ and ‘High’. Subsequent to this step, Kaplan-Meier survival curves were generated, and univariate Cox regression analysis was carried out. Additionally, we conducted multivariate Cox regression analysis utilizing the coxph () function from the survival package to investigate the relationship between these variables and clinical data.
scRNA-seq Data Download and Processing
We obtained the scRNA-seq data GSE140228 related to liver cancer from the GEO database, originally published by Zhang et al. 9 Using the “Seurat” package in R, we began our analysis by reading the count matrix and then created a “Seurat” object using the “CreateSeuratObject” function. To filter out doublets, we employed the “DoubletFinder” package. We set criteria to filter cells, including those with unique feature counts either exceeding 4000 or fewer than 300. Additionally, cells with over 10% mitochondrial counts were removed. After filtering out irrelevant cells, we normalized the data using the “LogNormalize” method.
To highlight the most variable features, we identified them and, by default, selected 2000 genetic features for subsequent analysis. We then employed the “ScaleData” function, paving the way for linear transformations essential for upcoming dimension reduction procedures. Following this, we utilized non-linear dimension reduction techniques, such as tSNE and UMAP, to visually explore and delve deeper into the datasets.
Analysis of Intercellular Communication Network
We employed the “CellChat” R package to delve into the interactions between Treg groups and other T and myeloid cell clusters as previously described. 22 To depict the cell-to-cell communication network, we utilized hierarchy plots, circle plots, and chord diagrams. Additionally, bubble plots were harnessed to showcase interactions mediated through various ligand receptors.
Trajectory Analysis
The “Monocle3” R package was employed to investigate the trajectory patterns of selected cell clusters. This algorithm delineates the progression of gene expression modifications and pinpoints genes that are regulated throughout the trajectory’s duration. 23
Construction of Prognostic Risk Model of Treg Cell Characteristic Genes Based on TCGA LIHC Data
Data from TCGA LIHC were retrieved from the UCSC Xena portal (https://xena.ucsc.edu/). Utilizing the R packages “Survival,” “rms,” and “survminer,” we applied the Cox proportional hazard model to the characteristic Treg genes in relation to overall survival (OS). The “ggrisk” package was then used to compute and illustrate the patients’ risk scores. A nomogram was subsequently crafted based on a Cox model that incorporated clinical variables, risk scores, and survival metrics, with its validity confirmed through calibration curves.
Imaging Analysis
We employed the Tissue FAXS system from Tissue Gnostics Asia Pacific Limited, Austria, for comprehensive multispectral scanning of the TMA slide. The images obtained were subsequently analyzed using the Strata Quest analysis software (Version No. 7.0.1.165, Tissue Gnostics Asia Pacific Limited, Austria), as detailed in our earlier work.20,21 DAPI was harnessed to create a binary mask, identifying all living cells in the image. In a similar fashion, Foxp3+Tregs were enumerated and logged.
Statistical Analysis
Statistical evaluations were carried out with Prism 7 software (GraphPad) and R4.2.2 (R Core Team 2021, Vienna, Austria). We assessed the correlation between Foxp3+T cell infiltration intensities and clinical-pathological attributes utilizing the Chi-square test. The Cox model assisted in gauging the connection between Foxp3+T cell infiltration and patient outcomes. All tests were two-tailed, deeming P < .05 as the threshold for statistical relevance.
Results
Localization of Foxp3+Tregs in HCC Tissues and Normal Tissues
Through our mIHC analysis, we discerned the positioning and arrangement of Foxp3+Tregs and CK+ epithelial cells in HCC samples (Figure 1(A) shows CK in green color, while Foxp3 is depicted in purple) and their counterparts in normal tissues (Figure 1(A)). HCC samples had a noticeable increase in the count of Foxp3+Tregs when juxtaposed against normal tissues (P < .001, Figure 1(B)). The number of Foxp3+Tregs within HCC samples showed no substantial link to the clinical data of patients (Table 1). However, greater numbers of Foxp3+Tregs in HCC samples indicated a reduced patient OS rate (HR = 1.722, 95% CI: 1.023-2.899, P = .041, Figure 1(C)). As delineated in Table 2, the tumor’s advancement stage (T stage) emerged as a critical predictor of prognosis for those with HCC (HR = 2.903, 95%CI: 1.636-5.152, P = .0003, Table 2). Additionally, the quantity of Foxp3+Tregs was identified as a separate predictor of prognosis for individuals diagnosed with HCC (HR = 1.981, 95%CI:1.110-3.535, P = .020, Table 2). Foxp3+Tregs in human HCC tissues. (A) mIHC and single-color images were obtained from human HCC TMA (top: low infiltrating intensity of Tregs in normal hepatocellular tissue, middle: low infiltrating intensity of Tregs in HCC tissue, bottom: high infiltrating intensity of Tregs in HCC tissue). (B) The infiltrating intensity of Foxp3+Tregs was higher in tumor tissues compared to normal tissues (P < .0001). (C) The OS of the HCC patients with higher infiltrating intensity of Foxp3+Tregs was significantly poorer compared with those with lower infiltrating intensity (HR = 1.722, 95% CI: 1.023-2.899, P = .041). Univariate and Multivariate Analyses of Clinical Parameters of the Patients With Hepatocellular Carcinoma. Bold signifies P < .05.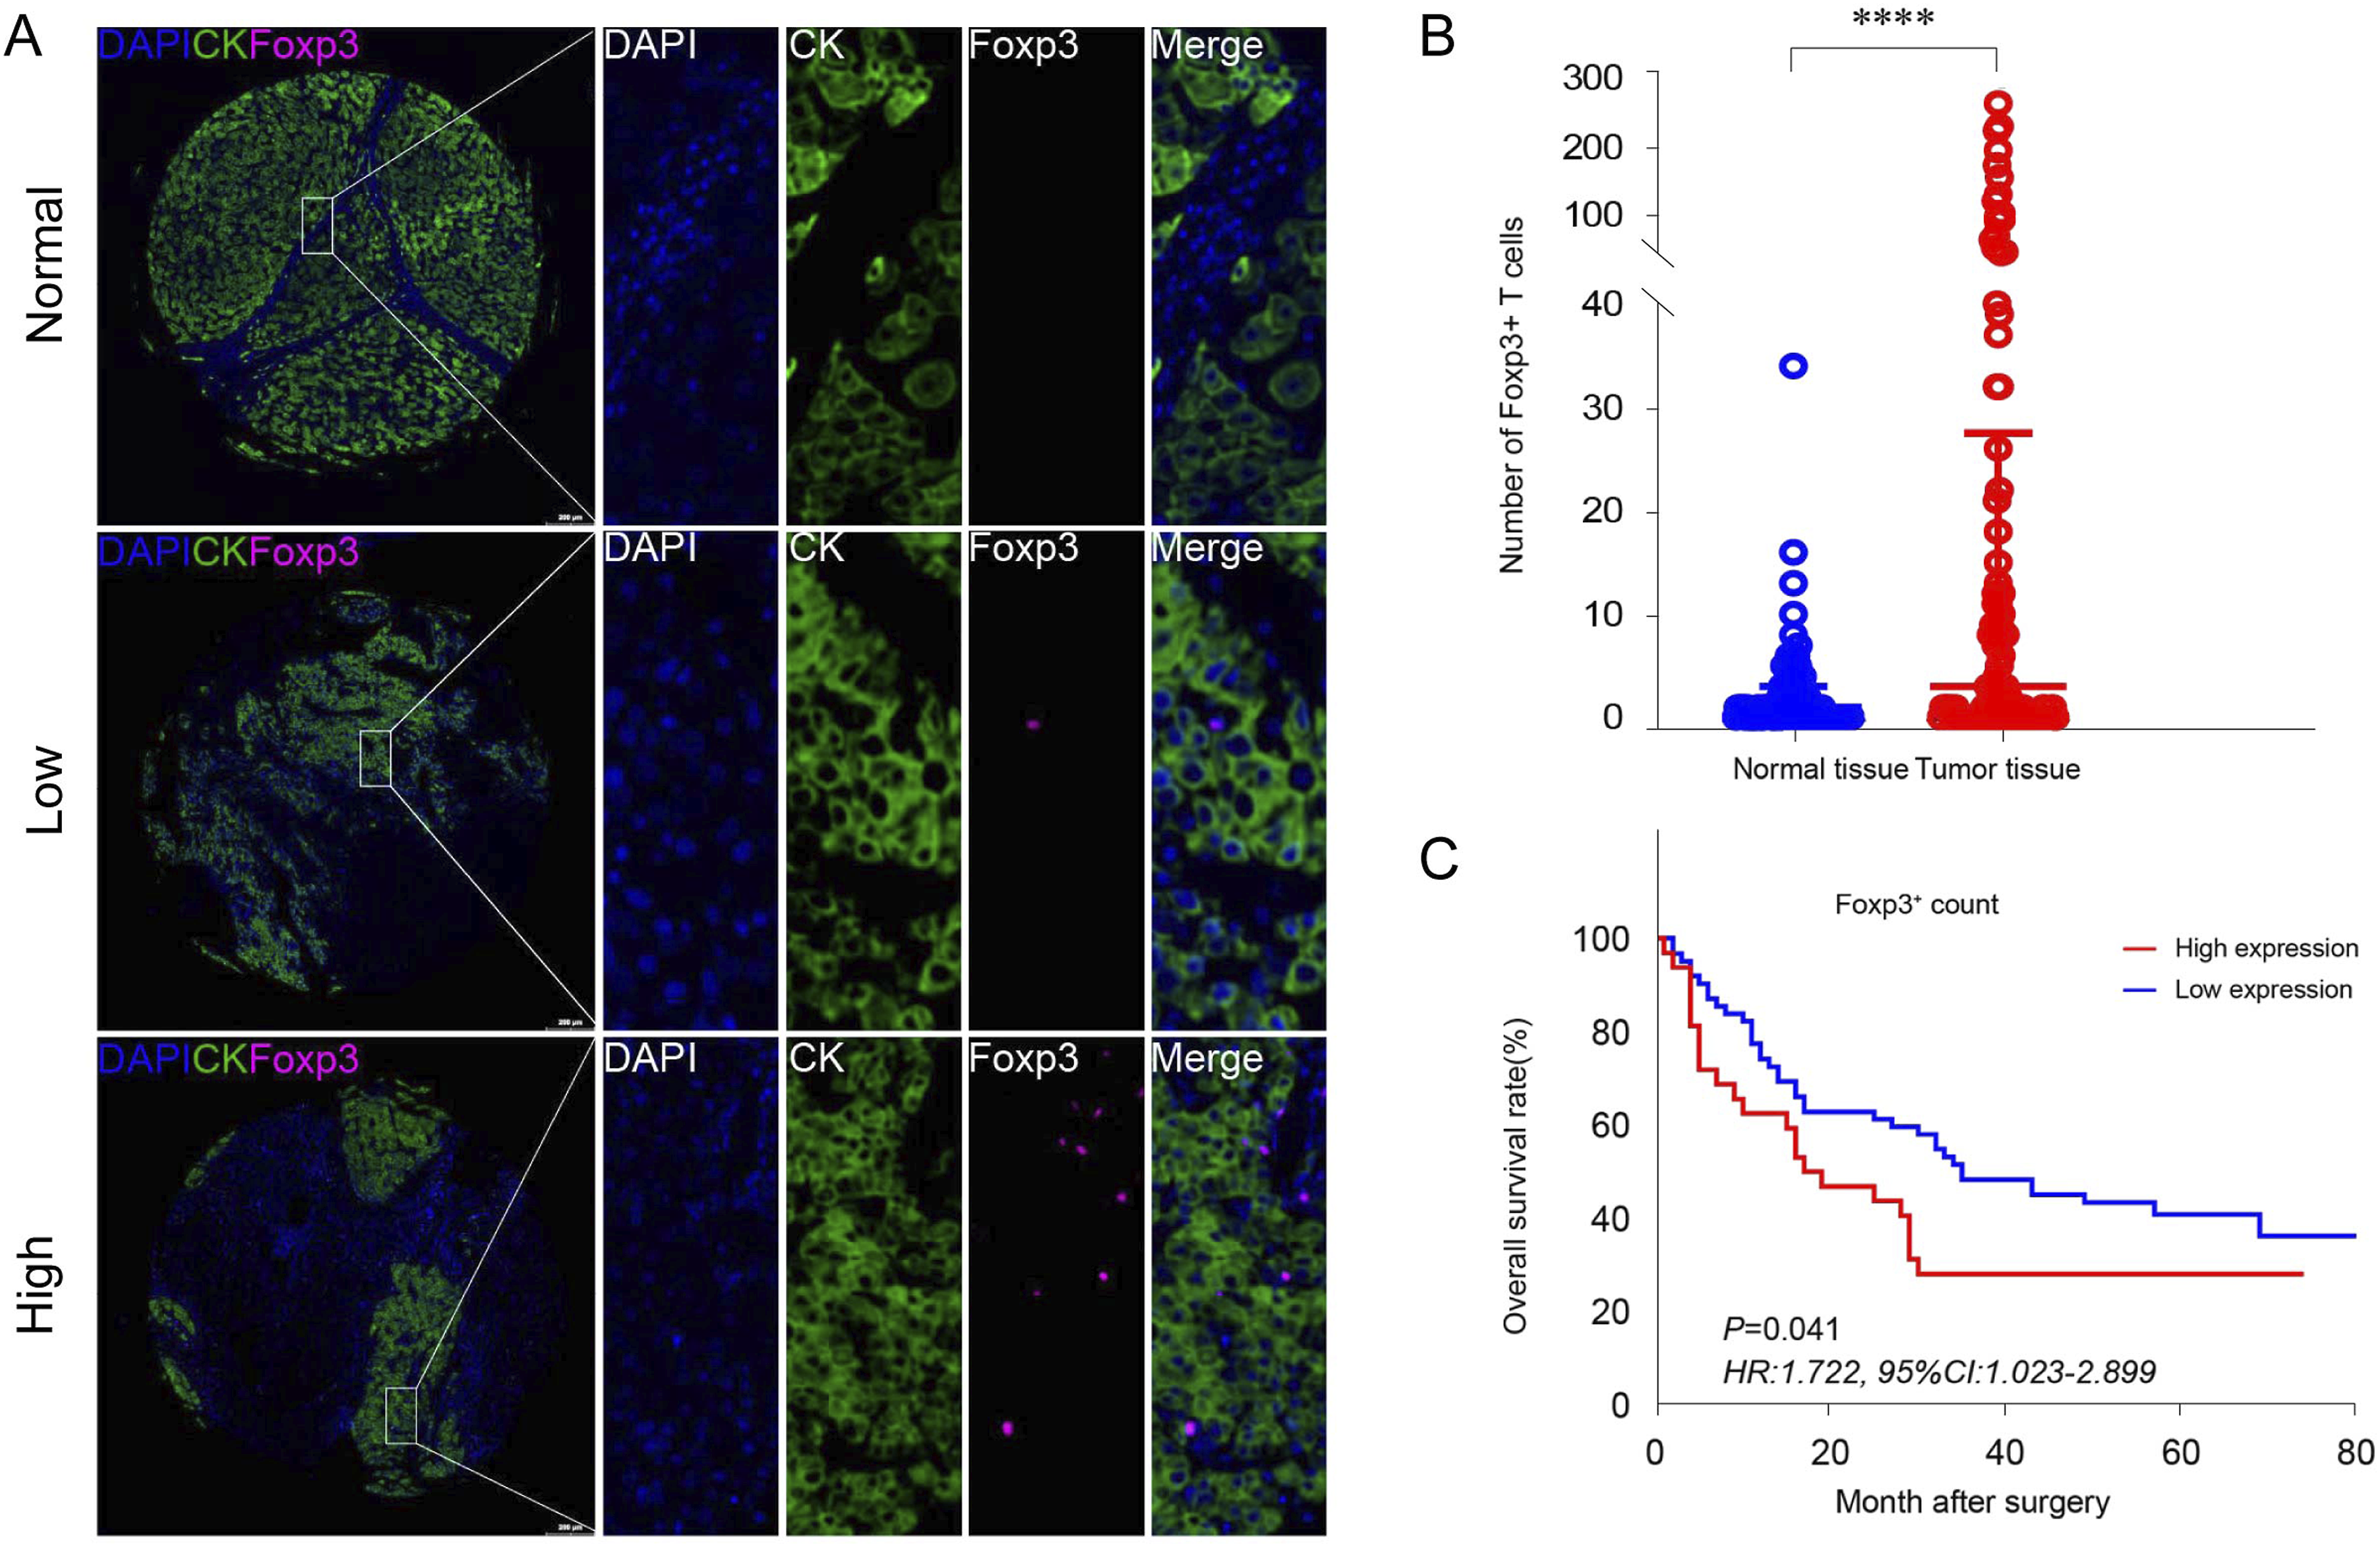

Construction of a Prognostic Model Of Characteristic Genes of Tregs Based on the TCGA Database of Human HCC
We utilized the Cox model, positioning the hallmark genes of Tregs as the independent variable and the OS of liver cancer patients as the dependent factor. Based on the model we previously established, we then gauged the risk score for each patient. A significant alignment was observed between the calculated risk score and actual patient mortality (Figures 2(A) and(B)). There existed a notable association between the expression values of Tregs’ hallmark genes and the risk scores (Figure 2(C)). On further stratifying patients based on their risk score magnitude, survival evaluation highlighted the capability of risk scores to act as a significant forecasting indicator for HCC in humans (P < .001, Figure 2(D)). We then reconfigured the Cox model to encompass age, gender, pathological rating, clinical phase, and the aforementioned risk score as influencing variables. The outcomes highlighted both the clinical phase (HR = 2.01, 95%CI:1.37-2.94, P < .001) and risk score (HR = 3.84, 95%CI: 2.52-5.83, P < .001) as distinct determinants impacting the prognosis of those with HCC (Figure 2(E)). Subsequently, we drafted a nomogram rooted in our definitive Cox predictive model to estimate the likelihood of mortality for patients within a span of 1 to 3 years (Figure 2(F)). The model’s accuracy was corroborated via the calibration curve, which verified the model’s proficiency in forecasting both 1-year and 3-year survival rates (Figures 2(G) and (H)). Prognostic model based on characteristic genes of Tregs. (A, B) Cox proportional hazard model based on characteristic genes of Tregs. B) Risk-score of each patient predicted by the Cox model. (C) Correlation between expression levels of Treg cell characteristic genes and risk-score. (D) survival analysis based on the patients with different risk scores. (E) Forest plot to display Cox model based on clinical parameters and risk score. (F) Nomogram based on the established Cox model based on clinical parameters and risk score. (G, H) Calibration curves, which are used to verify the consistency between the predicted and true values of the model for 1-year and 3-year survival rates.
Differential Expression Profiles of Characteristic Genes of Tregs in Different Tissue Types
We isolated and meticulously assessed Tregs data to delve into the expression patterns of distinctive genes across varying tissue types from HCC patients. Notably, genes including IGHG1, IGHG3, IGLC2, LGALS1, and SOX4 demonstrated particular and elevated expression in tumor tissues (Figure 3(A)). Conversely, no genes showcased such specific and heightened expression within adjacent liver tissues (Figure 3(B)). In the context of lymph nodes, CCR7, CXCR4, AIM1, and ICA1 were discernibly upregulated (Figure 3(C)). Meanwhile, in ascites, genes such as PTGER2, TXNIP, ITGB7, IL10RA, and SELL displayed unique and augmented expression (Figure 3(D)). Single-cell data of HCC show the expression level of Treg cell-specific genes in different tissue types from HCC patients. (A) Treg cell-specific genes expression profile in tumor tissues. (B) Treg cell-specific genes expression profile in adjacent normal tissues. (C) Treg cell-specific genes expression profile in the hepatic lymph node. (D) Treg cell-specific genes expression profile in ascites from HCC patients.
Cellular Communication Analysis Between Tregs and Other T-Lymphocyte Subsets
The predominant interaction observed between Tregs and other CD4+T cell subsets focused on the CD4+ T cells that specifically expressed CXCL13 and the CD4+T/CD8+T subsets that prominently expressed MKI67 (Figure 4(A)). The CXCL13-specific CD4+ T cell and MKI67-specific CD4+/CD8+ T cell subsets are major signaling output cell populations. As a B cell activation-dependent CD4+ T cell subset related to B cell activation and humoral immunity, CXCL13-specific CD4+ T cells likely regulate Tregs primarily through interaction of the human major histocompatibility complex HLAs-CD4 Ligand-Receptor (L-R) pair. As highly proliferative cell subsets, MKI67-specific CD4+/CD8+ T cells as signaling output cells mainly regulate Tregs through interactions of following L-R pairs: HLAs-CD4, MIF-CD74, and MIF-CD44 (Figure 4(B)). When Tregs act as signaling output source, they regulate CD4_CXCL13 and CD4/CD8_MKI67 cell subsets primarily through HLAs-CD4 and HLAs-CD8 L-R pairs (Figure 4(C)). Moreover, Tregs displayed broad regulatory functions over effector and exhausted CD8+T cells (Figure 4(D)). When CD8+T cells act as a signal output source, the effector CD8+T cells (CD8_GZMK) and the exhausted CD8+T cell subgroups (CD8_PDCD1) primarily regulate Treg cells through L-R pairs of MIF-CD74, MIF-CD44, and HLA-CD4 (Figure 4(E)). Conversely, when Treg cells serve as the signal output source, they mainly regulate the CD8_GZMK and CD8_PDCD1 groups through L-R pairs of HLA-CD8 and the C/D-type lectin CLEC2C/CLEC2D-KLRB1 (Figure 4(F)). There is extensive regulatory crosstalk between Tregs and NK cells (Figure 4(G)). When NK cells act as the signal output source, they primarily regulate Treg cells through interactions of ligand-receptor pairs such as HLA-CD4, MIF-CD74, and MIF-CXCR4 (Figure 4(H)). Conversely, when Tregs serve as the signal output source, they mainly regulate activated populations of NK cells through interactions involving HLA-E-KLRC1 and HLA-E-CD94 (Figure 4I). Cellular communication analysis between Treg subsets and other T-lymphocyte subsets. (A-C). Communication between Treg subsets and other CD4+T-cell subsets. (D-F). Communication between Treg subsets and CD8+T-cell subsets. (G-I). Communication between Treg subsets and NK cell subsets.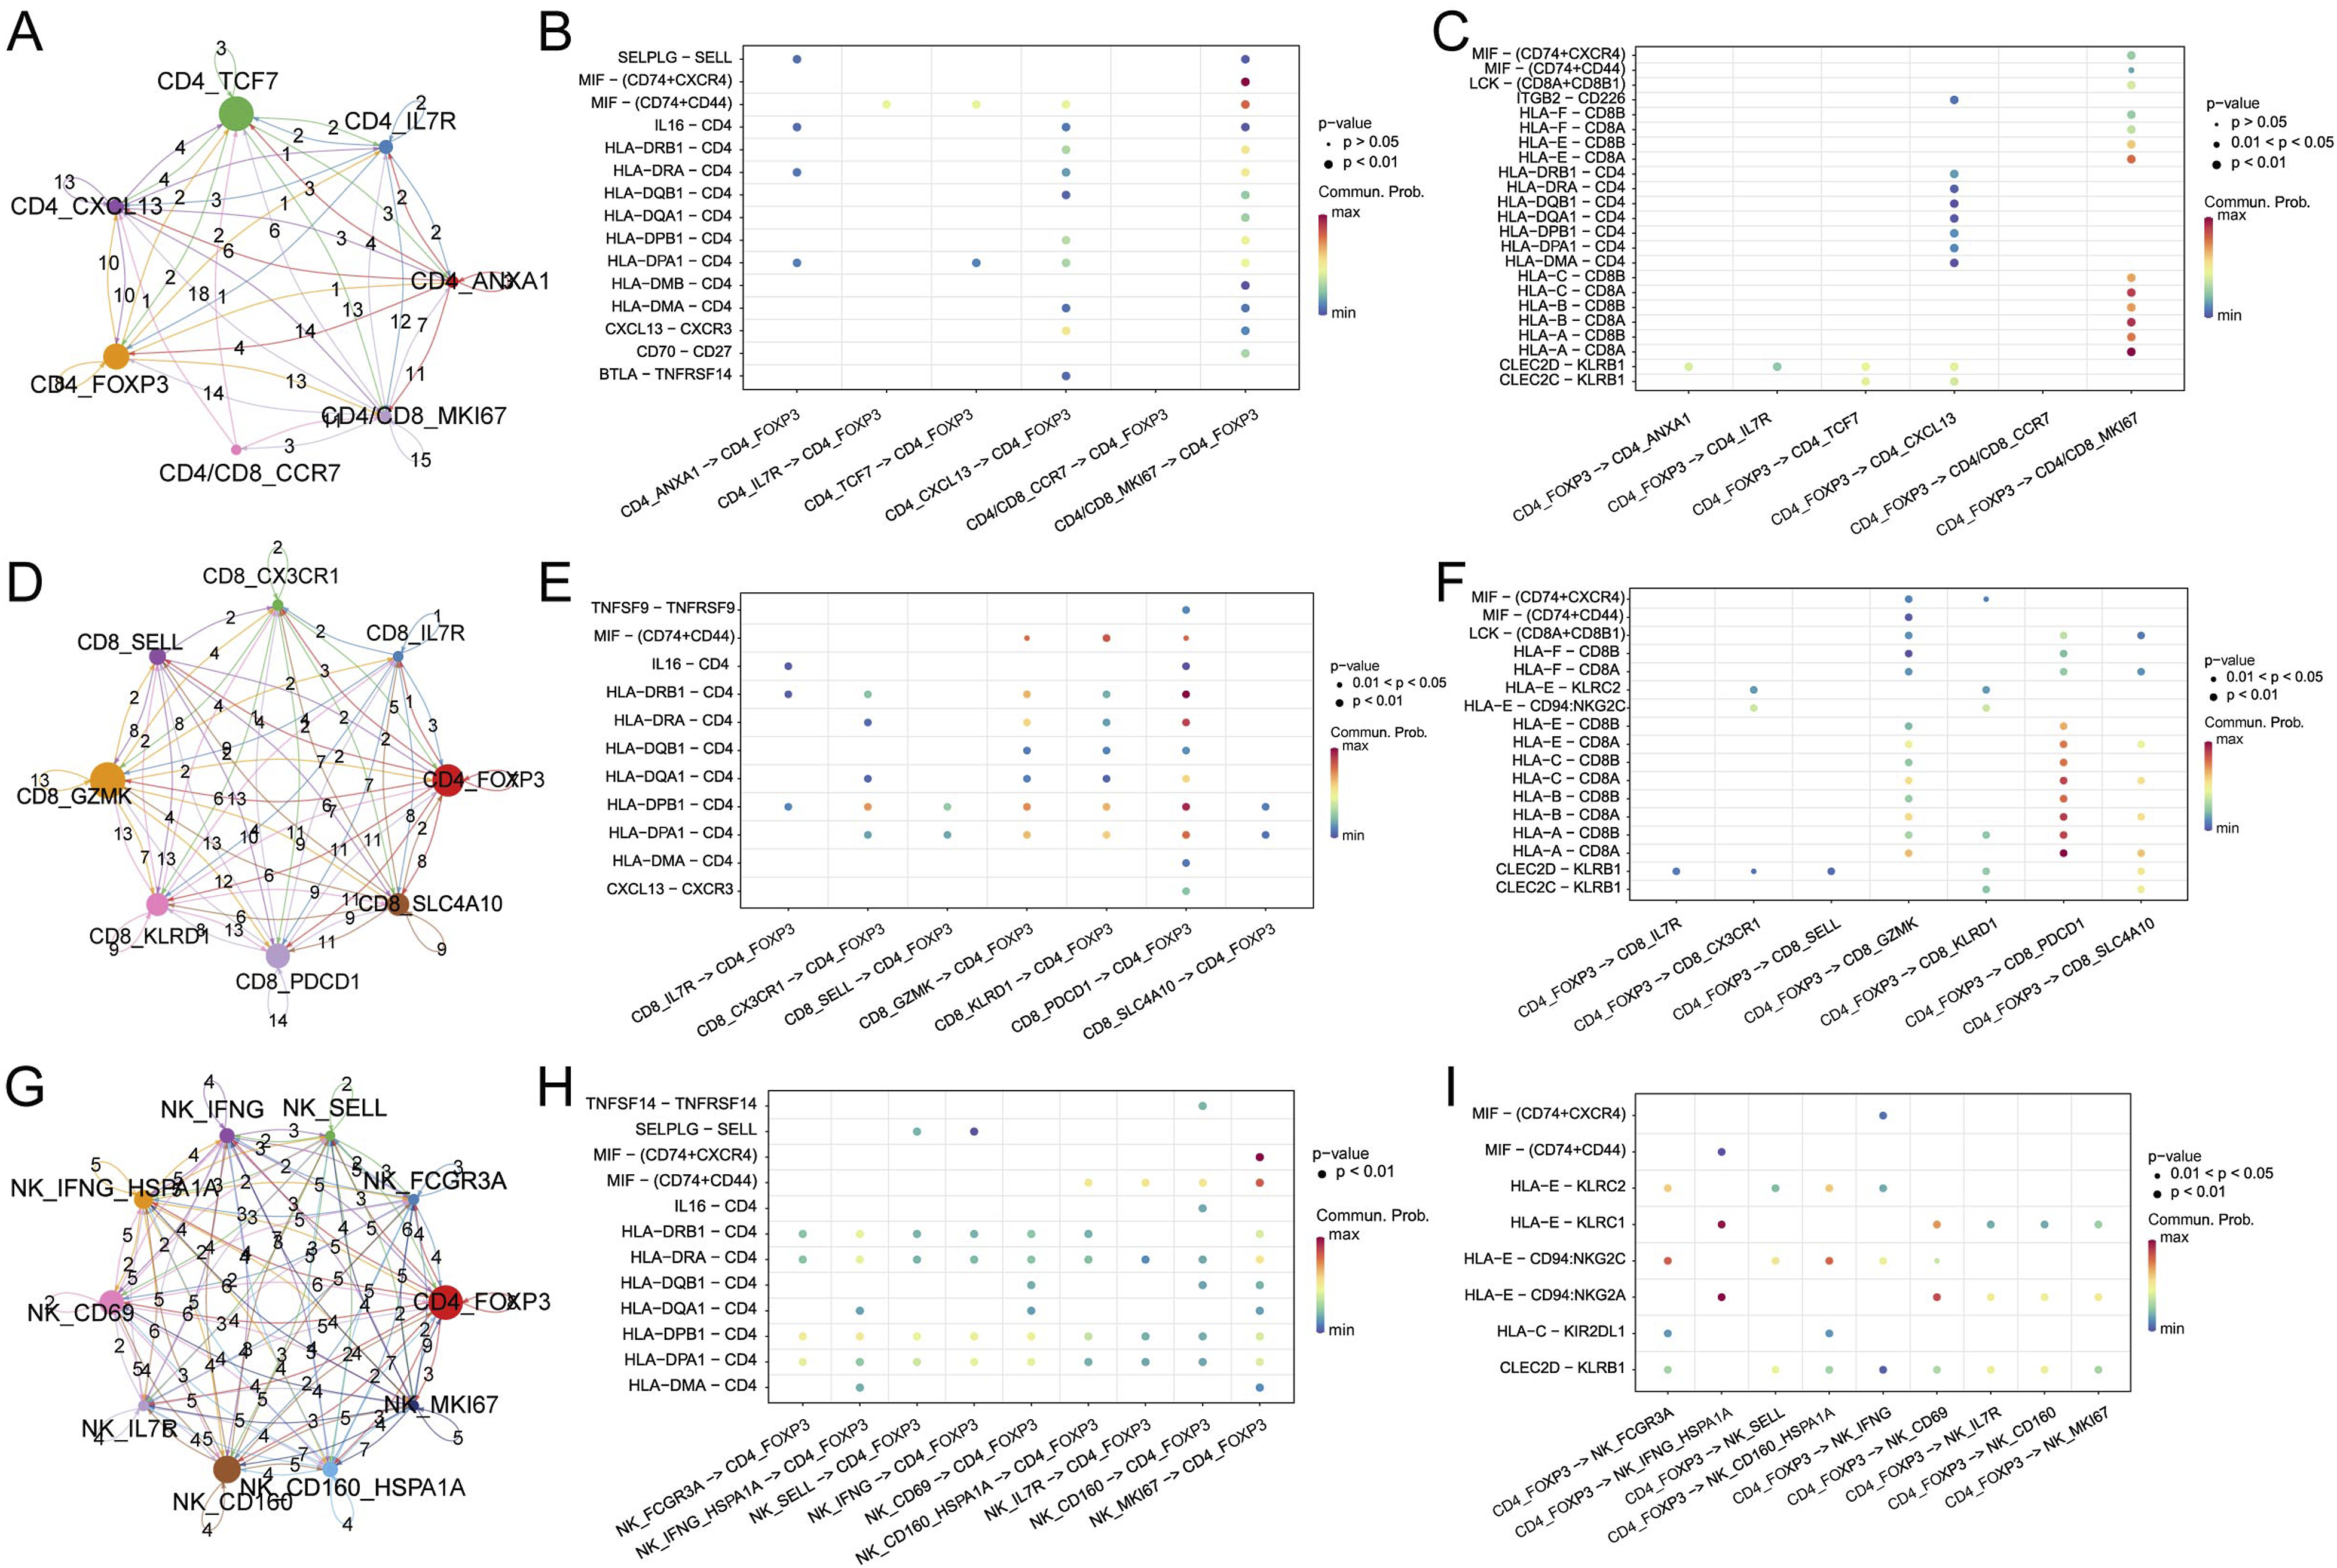
Cellular Communication Analysis Between Subsets of Tregs and Myeloid Cells
Communication between Tregs and macrophage subpopulations is predominantly mediated by macrophages acting as the main signal output source (Figure 5(A)). Specifically, THBS1-specific macrophages (Mac_THBS1, related to angiogenesis), C1QA-specific macrophages (Mac_C1QA, associated with complement activation and inflammatory responses), APOE-specific macrophages (Mac_APOE, linked to immune regulation), and MARCO-specific macrophages (Mac_MARCO, involved in anti-tumor immune regulation) regulate Tregs through interactions involving L-R pairs such as HLA-CD4, MIF-CD74, MIF-CD44, and LGALS9-CD45 (Figure 5(B) and (C)). Communication between Tregs and dendritic cell (DC) subpopulations is primarily facilitated by DCs acting as the main signal output source (Figure 5(D)). Specifically, CD1C and CLEC9A-specific DC cells (DC_CD1C, DC_CLEC9A, related to cDC1 functions), FCER1A-specific DC cells (DC_FCER1A, activated DCs), and LAMP3-specific DC cells (DC_LAMP3, phagocytic DCs) predominantly regulate Tregs through interactions involving LGALS9-CD45 and CD86-CTLA4 (Figure 5(E)). Conversely, Tregs regulate DC cells mainly through interactions among ligand-receptor pairs such as PTPRC-MRC1, MIF-CD74, and MIF-CXCR4 (Figure 5(F)). Cellular communication analysis between Treg subsets and myeloid cell subsets. (A) Circle plot reveals the communication weights between Treg subsets and macrophage subsets. (B) Dotplot of macrophage subsets regulated by Treg subsets. (C) Dotplot of Treg subsets regulated by macrophage subsets. (D) The circle plot reveals the communication weights between Treg subsets and DC subsets. (E) Dotplot reveals the signal axis of DC subsets regulated by Treg subsets. (F) Dotplot reveals the signal axis of Treg subsets regulated by DC subsets.
Identification and Pseudo-time Analysis of Treg Subsets
Utilizing the UMAP algorithm, the Treg subsets were re-categorized into 3 distinct populations. The evolutionary sequence of cells on the timeline was determined as cluster1 - > cluster 0 - > cluster 2. An analysis was undertaken to discern the relationship between the expression of the top 10 genes and the cell evolution timeline in the pseudo-time trajectory difference examination. This investigation unveiled that the expression patterns of TNFRSF18 and PKM genes closely mirrored the evolutionary path of Tregs (Figure 6). Pseudo-time analysis of Treg cell subsets. (A) Treg subsets were re-clustered by the UMAP algorithm into 3 populations (Cluster 0, 1, and 2). (B, C). Cell Evolution Trajectory Recognition and Root Cell Search. (D) The correlation between the gene expression level and the cell evolution timeline of the top 10 genes yield by trajectory difference analysis of monocle3 package.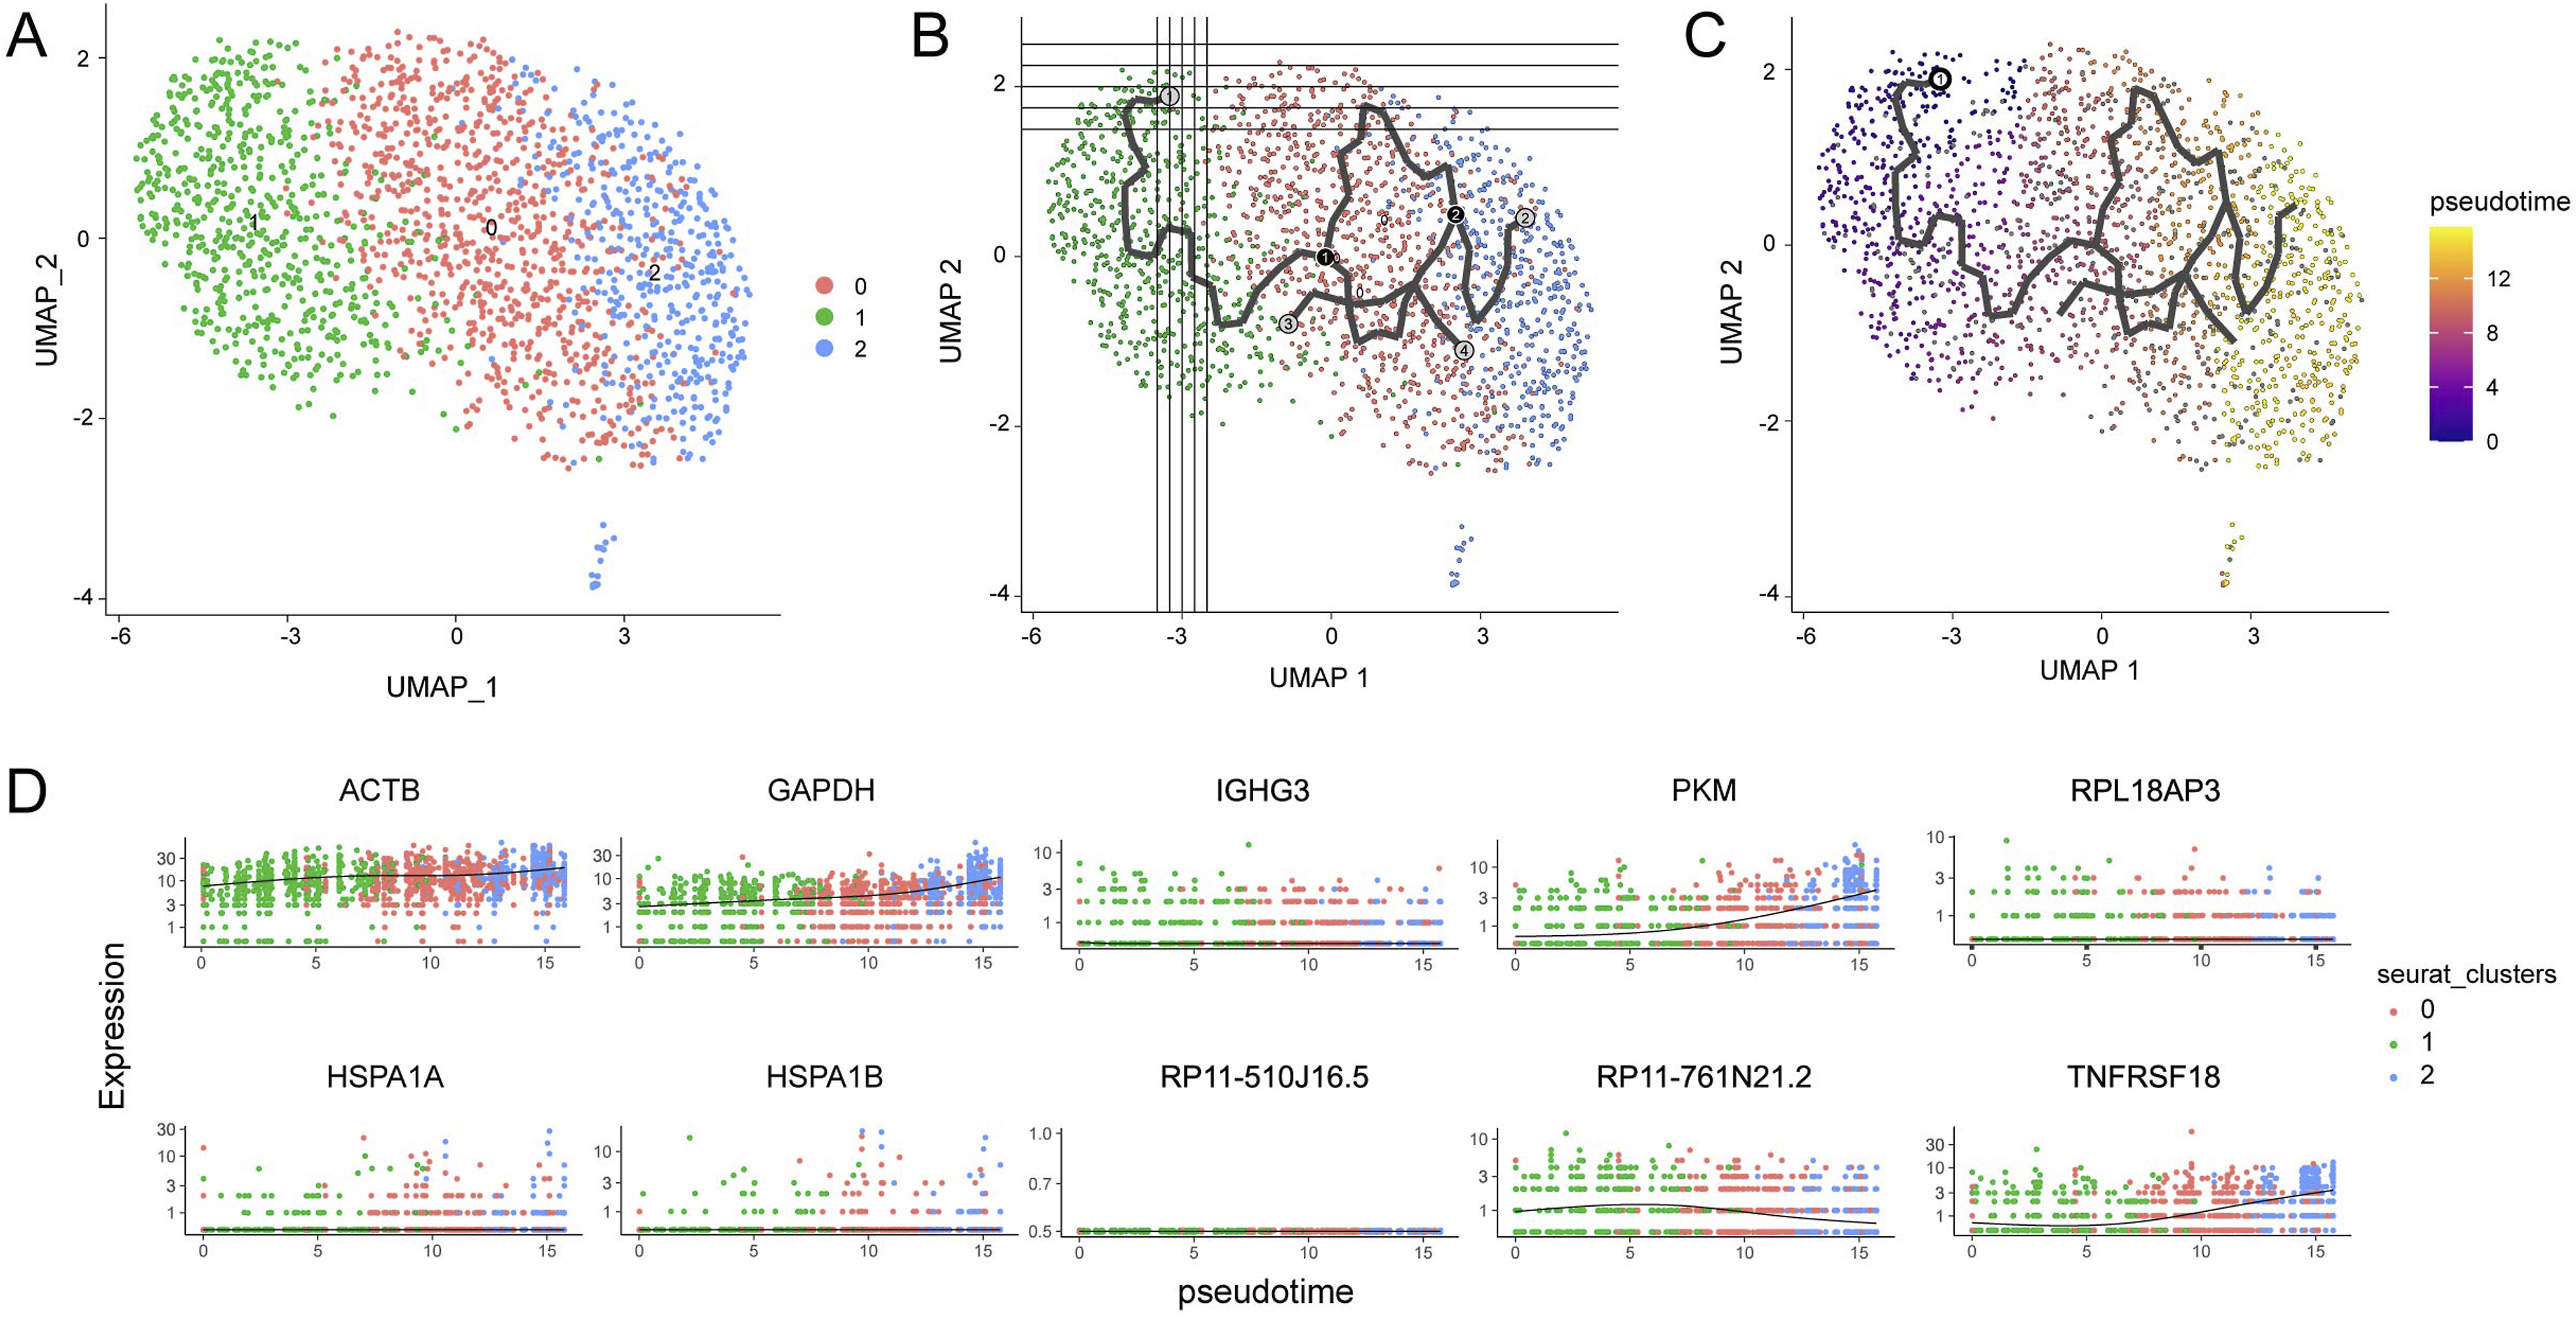
Discussion
To sustain immune equilibrium, it’s essential for the host to not only detect and eliminate foreign antigens but also uphold peripheral immune tolerance, modulating the immune system’s intensity of response to external pathogens and cancerous markers. Typically, CD4+ T cells can be bifurcated into 2 primary categories based on their roles: the effector T cell (Teff) and Treg. 24 Tregs, in contrast to Teffs, are characterized by their unresponsiveness (anergy) and immunosuppressive properties, contributing to the suppression of T cell effector functionalities, immune stability, and even tumor immune tolerance.24,25 The significance of the transcription factor Foxp3 in guiding the evolution, distinction, and operation of Tregs is widely acknowledged. 17
Interestingly, within the TME, Tregs are instrumental in thwarting anticancer immune responses and catalyzing tumor onset and growth. 17 Our prior examinations confirm that in tissues from human esophageal cancer patients, a more pronounced infiltration of Tregs can signify a less favorable OS. 15 Our current analysis, coupled with other established studies, highlighted that an augmented presence of infiltrating Tregs in human HCC tissues correlated strongly with advancing cancer and the grim prognosis for patients.26-28 A sequence of investigations has further identified significant Treg accumulation within the TME of various cancers, including melanoma, breast, colorectal, lung, and pancreatic cancers. 29 The surge in infiltrating Tregs in solid tumors may arise due to chemokine-triggered tTreg recruitment, tTreg proliferation, and the evoked differentiation of pTreg in the TME. Documented chemokines and their receptors in this context encompass CCL22/CCR4, CCL5/CCR5, CCL28/CCR10, and CXCL12/CXCR4.30-33 It has been documented that KW-0761, an anti-CCR4 humanized monoclonal antibody, has the potential to eliminate CCR4-expressing Tregs in solid tumors. Post-treatment, 40% of these patients exhibit stability and experience extended longevity. 34 Another compound, BL-8040 (a CXCR4 antagonist), has been shown to enhance therapeutic outcomes in patients with pancreatic cancer when combined with pembrolizumab and chemotherapy. 35
Over the last half-decade, ICIs have ushered in significant advancements in the therapeutic landscape of HCC. 36 It has been well-established that a majority of these ICIs are predominantly expressed on Tregs. Hence, the impact of ICIs on tumor-infiltrating Tregs is crucial to determining the success of cancer immunotherapies. 17 Yet, therapies involving CTLA-4 antibodies come with the risk of acute autoimmune reactions, likely stemming from the comprehensive elimination of Tregs. Consequently, targeting and removing Tregs specific to the TME may reduce autoimmune side effects while amplifying therapeutic benefits. 37 Furthermore, research has indicated that merely removing Tregs does not necessarily counteract their inhibition of antitumor responses. A previous study has shown that it's the compound adenosine, rather than conventional suppressive agents like PD-L1, CTLA-4, TGF-β, IL-35, and IL-10, that plays a pivotal role in the immunosuppressive actions of apoptotic Treg cells. 38
This study, through analyzing the infiltration levels of Tregs in the tissues of HCC patients and the relationship with patient prognosis, demonstrates that high infiltration levels of Tregs are an independent factor for poor prognosis in HCC patients. A prognostic model constructed using signature genes of Tregs further validates the adverse impact of high Treg infiltration levels on the prognosis of liver cancer. In the analysis of cell communication based on single-cell data, it was found that Tregs extensively regulate other types of T lymphocytes, including B-cell activation-related CXCL13-specific CD4+ T cells, MKI67-specific highly proliferative CD4/CD8/NK cells, and effector and exhausted CD8+ T cells. Some studies have demonstrated a link between CXCL13 levels measured in patient blood or tissue samples and their response to checkpoint inhibitor immunotherapy. Higher CXCL13 expression ties to greater activity in splenic germinal centers and development of tertiary lymphoid organs. While this may initially boost immune response, it also provokes toxic side effects that influence the prognosis of patients undergoing this type of cancer treatment. Managing these immune-mediated reactions remains an important priority for improving clinical results with inhibitors targeting regulatory pathways.39,40 Tregs also have extensive regulatory relationships with macrophages and dendritic cells (DCs), mainly with macrophages and DCs acting as the signal output sources. Different functional macrophages involved in angiogenesis, inflammatory responses, and anti-tumor immunity regulate Tregs through various ligand-receptor pairs. DCs, characterized by antigen presentation and immature DCs with phagocytic function, and Tregs mutually regulate each other, though the specific mechanisms of action remain unclear. Therefore, the role and mechanisms of Tregs in the immune microenvironment of liver cancer require further exploration and research. Studies on the regulatory interaction between DCs and Tregs have mainly focused on inflammatory diseases. A study on multiple sclerosis (MS) showed that, through different co-stimulatory/inhibitory molecules, cytokines, and metabolic enzymes, DCs regulate the proliferation, differentiation and function of Tregs. On the other hand, Tregs inhibit the mature state and antigen presentation ability of DCs, ultimately improving immune tolerance. 41 Another study on chronic hepatitis B revealed that Tregs can impair the maturation and functionality of DCs by increasing the secretion of IL-10 and TGF-β, thus reducing the DCs’ efficacy as antigen-presenting cells and their expression of costimulatory molecules. Consequently, Tregs not only directly suppress CD4+ T cells but may also influence the immune response in chronic hepatitis B patients by modulating DCs. 42
This study also presents certain limitations, primarily due to its exploratory nature rather than being a meticulously designed randomized controlled clinical trial. As a result, it did not undertake a rigorous sample size calculation to ensure statistical significance in the study outcomes. Additionally, while the study validated the results obtained from mIHC analysis with published data, it lacked targeted, well-structured experiments to delve into the underlying mechanisms. Consequently, there is a clear need for further experimental work to comprehensively elucidate the role and mechanisms of Treg cells in the context of liver cancer.
Conclusions
In summary, Tregs are lured to the TME through chemotaxis, where they quash the body’s antitumor immune response, thereby fostering tumor growth. This process involves a complex interplay of intra- and extracellular molecules and signaling pathways. By strategically targeting Tregs—either by reducing their presence in the TME or attenuating their immunosuppressive capabilities—we can bolster the body’s innate antitumor defenses and hinder tumor progression. However, it’s vital to acknowledge that Tregs also serve a crucial role as immunosuppressors, essential for maintaining immune homeostasis. Hence, it’s imperative to conduct meticulous research to identify precise Treg targets within tumors when exploring potential therapeutic interventions. This precision is critical for minimizing adverse reactions and optimizing the efficacy of immunotherapy in cancer treatment.
Footnotes
Authors’ Note
The authors are accountable for all aspects of the work, including ensuring that any questions related to the accuracy or integrity of any part of the work have been appropriately investigated and resolved.
Author Contributions
(I) Conception and design: L.J.C. and B.X.; (II) Administrative support: L.J.C.; (III) Provision of study materials or patients: L.J.C. and B.X.; (IV) Collection and assembly of data: J.W.G., J.J.C., Q.S.; (V) Data analysis and interpretation: L.J.C. and B.X.; (VI) Manuscript writing: All authors; (VII) Final approval of manuscript: All authors.
Declaration of Conflicting Interests
The author(s) declared the following potential conflicts of interest with respect to the research, authorship, and/or publication of this article: The authors declare that the research was conducted in the absence of any commercial or financial relationships that could be construed as a potential conflict of interest.
Funding
The author(s) disclosed receipt of the following financial support for the research, authorship, and/or publication of this article: The present study was supported by the National Natural Science Foundation of China (82172689), the Key R&D Project of Jiangsu Province (BE2022721), China Postdoctoral Science Foundation (2021M700543), High-Level Talents Project of Jiangsu Commission of Health (LGY2020034), the Applied Basic Research Foundation of Changzhou (CJ20210089 and CJ20220229) and Changzhou International Cooperation Project (CZ20210035).
Ethical Statement
Data Availability Statement
All sequencing data in this study were obtained from publicly available articles, and no additional data were generated in the course of this research.