
Abstract
Objective
The gold standard for breast cancer screening and prevention is regular mammography; thus, understanding what impacts adherence to this standard is essential in limiting cancer-associated costs. We assessed the impact of various understudied sociodemographic factors of interest on adherence to the receipt of regular mammograms.
Methods
A total
Results
Model results demonstrated that all factors race and ethnicity had at least some bearing on compliance with screening guidelines among mid-life female Kansans. The strongest signal was observed in the rurality variable, which demonstrated a significant relationship with compliance regardless of how it was defined.
Conclusion
Understudied factors that are associated with regular mammography adherence, such as rurality and distance to nearest facility, may serve as important considerations when developing intervention strategies for ensuring that female patients stick to prescribed screening regimens.
Introduction
Breast cancer, as its name suggests, is a cancer that forms in breast cells, most commonly in the ducts, the tubes that transport milk from the lobules to the nipple. While a small proportion of those afflicted are male (<1%), the overwhelming majority of patients are female. To this point, in a typical year in the United States alone, a total of 2400 new cases are diagnosed in men as compared to over a quarter-million in women.1-3 Thus, while both sexes are affected, the disease is largely a women’s health issue. Indeed, after skin cancer, breast cancer is the most diagnosed cancer in women in the United States, being directly responsible for approximately 42,000 deaths each year.3,4 While the overall 5-year survival rate is quite high in developed countries such as the United States (
The current gold standard for early breast cancer detection is the mammogram, which has an estimated sensitivity of 85% and an estimated specificity of 90%. 7 While current screening guidelines differ by institution, the general consensus is that mid-life women (aged 45 to 74) with average risk should be screened once every 1–2 years.8,9 The U.S. Center for Disease Control and Prevention and the US Preventive Services Task Force (USPSTF), in particular, recommends that women aged 50 to 74 who are at least average risk for breast cancer receive a mammogram every 2 years. They further recommend that women aged 40–49 speak with their doctor or healthcare provider to determine if starting earlier is beneficial.10,11 The USPSTF lists adherence to this screening regimen as having a high certainty for moderate to substantial health benefits.
Biennial screening in particular has been demonstrated to avert seven breast cancer deaths for every 1000 women screened, increase overall life expectancy by approximately 1.4 months, and decrease the number of women who are initially diagnosed with a late-stage cancer. 10 Further, it is known that late-stage breast cancer is generally more expensive to treat than early-stage breast cancer; thus, it stands to reason that mammography is an effective tool in not only improving the health prospects of those screened but also in saving potentially large amounts of money. 12 Given the considerable evidence regarding the benefits of routine mammography, it is paramount that mid-life women adhere to a regular screening regimen.
Recent research concerning mammography screening adherence has largely been focused on racial or ethnic disparities, but these variables do not fully capture the issue.13,14 Rural, densely settled rural, and frontier counties make up 85% of the state of Kansas. 15 Consequently, as a state, Kansas has a sizable rural population, with 25.8% of its total population coming from these areas. 16 This makes Kansas screening data well equipped to investigate the effects of understudied factors, like rurality, on screening adherence. While rurality is clearly of great importance in Kansas, the Sunflower state is not alone in this regard. Indeed, in ten states, it has been shown that more than 26% of women had limited accessibility to get mammography’s in 2022, in part due to lack of facilities, distance required to get to facilities, and time required to get facilities. 17 Therefore, the purpose of the present study is to determine how several sociodemographic factors of interest including rurality impact adherence in the state of Kansas, with the hope that sub-populations at risk of engaging in less frequent screening may be intervened upon (via additional reminders, for instance) and the aforementioned benefits of routine screening may be enjoyed by a greater share of women.
Methods
Data for this project were collected by Centrus Health, an Accountable Care Organization (ACO) and participant in the Medicare Shared Savings Program (MSSP). 18 The earliest mammography claims in this dataset were filed in 2014 and originate from Aetna, BlueCross BlueShield, the Centers for Medicaid and Medicare Services (CMS), and the Great Plains Health Alliance (GPHA). To keep our analytic sample in line with screening guidelines while making use of as much data as possible, women younger than 45 and older than 54 were excluded from the study. The upper bound of 54 was chosen due to the fact that women 55 and older could potentially have uncaptured mammograms from 2013 and earlier. Additionally, to protect privacy, randomly generated identifiers were used in lieu of medical record numbers to group claims.
The sociodemographic factors of interest for this study included race (White, Black, AAPI, Native American, and other), ethnicity (Hispanic vs non-Hispanic), rurality (rural vs urban), health insurance type (public vs private), mammogram screening facility type (critical access hospital, mobile unit, clinic office, outpatient hospital, and other), and distance from the nearest mammography screening facility. Race is a categorical variable in which only one value can be assumed; thus, multi-racial assessments were not possible in the present study. Rurality was defined using the Rural-Urban Commuting Area Codes (RUCA), 19 which we mapped to the zip codes present in our claims dataset. RUCA codes of 1–3 were classified as “urban,” and codes of 4–10 were classified as “rural.” Aetna, BlueCross BlueShield, and the GPHA were defined as “private” health insurances, and the CMS was defined as “public” health insurance. A complete listing of mammogram screening facilities in the state of Kansas was obtained via a publicly available U.S. Food and Drug Administration (FDA) database; 20 distance was then computed using the zip_distance function from the zipcodeR package. 21 All other variables were used as parameterized in the original dataset.
To quantify a given woman’s adherence to the prescribed regimen of routine mammograms, we created a compliance ratio (CR), defined as follows

Summary of Each Compliance Group.

The nature of the compliance ratio (CR) allowed us to assess “compliance” in a multifaceted manner—both in terms of a raw, continuous “score” and in terms of a “threshold” to be reached. For categorical predictors, Kruskal–Wallis one-way ANOVAs were used for the continuous parameterization of compliance, and chi-squared tests were used for the categorical parameterization. In this context, both tests assess whether compliance differs across all levels of a given predictor. For the lone continuous predictor (distance), multiple linear regression models and multiple logistic regression models were used, respectively. Given the expected high correlation between rurality and distance from nearest facility, these regression models additionally controlled for rurality (urban/rural). A parameter
To get a sense of the likelihood that a future woman would comply with mammography screening recommendations given her sociodemographic profile, we also fit a series of multiple logistic regression models (one for each categorical compliance threshold) and a multiple linear regression model (where the outcome is the continuous compliance ratio), each of which contained the significant factors under study. Together, the parameter estimates can be used to generate a rough guess for a given profile.
All analyses were performed in R v. 4.1.0. To account for the testing of multiple hypotheses, the Benjamini-Hochberg procedure for multiple hypothesis testing
22
was used to control the type I error to
Results and Discussion
After data cleaning, a total of
Compliance (Categorical) by Distance.

aOR = odds ratio.

Categorical compliance by sociodemographic factor.
Continuous Compliance by Sociodemographic Factor.
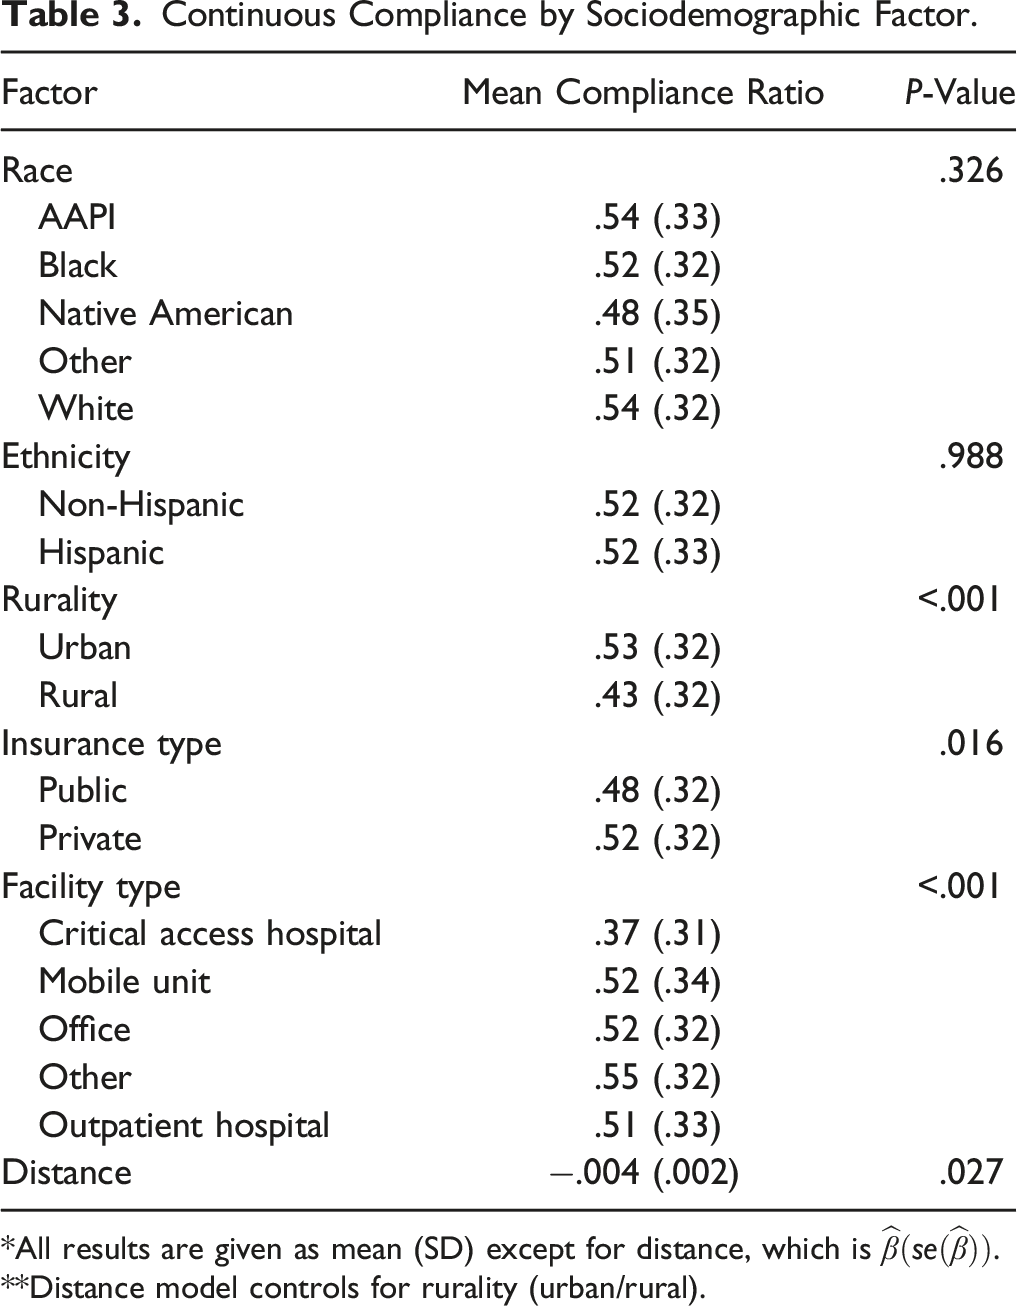
*All results are given as mean (SD) except for distance, which is
**Distance model controls for rurality (urban/rural).
Compliance Prediction Model Results.

*REF = reference category.
** OR = odds ratio, model-based point estimate.
When parameterized categorically, compliance continues to have a noticeable, significant association with rurality. More specifically, those who live in rural areas have anywhere from a 33% to a nearly 50% decrease in the odds of being compliant with screening recommendations (depending on which threshold is used). Of the other variables included in the prediction models, only insurance type and facility type displayed any indication of a signal, and only when full compliance (CR = 1) (for the former) and 1/4 compliance (for the latter) were analyzed. More specifically, those with public insurance had about 27% decreased odds of being completely compliant with screening recommendations as compared to those with private insurance, and women utilizing offices, outpatient hospitals, and other facilities had at least 50% greater odds of having a CR
This study sought to determine the impact of six sociodemographic factors (race, ethnicity, rurality, insurance type, facility type, and distance from nearest mammography facility) on a sample of mid-life female Kansans’ adherence to national breast cancer screening guidelines. We defined compliance two different ways: (1) continuously, where the number of years in which a woman received a mammogram was divided by the number of years she was recommended to have received a mammogram, and (2) categorically, where the continuous formulation of compliance was used to create binary variables indicating compliance was greater than or equal to
The findings suggest that all factors save race and ethnicity have at least some bearing on compliance with screening guidelines among mid-life female Kansans. The strongest signal was observed in the rurality variable, which demonstrated a significant relationship with compliance regardless of how it was defined. This supports the initial claim that various factors impact adherence in a multifaceted manner and rurality in particular is of considerable importance in the state. One study found that in Indiana and Ohio mailing a DVD and having a patient navigator call a week later resulted in rural women who were five times more likely to become up to date with mammography screening. 23 An outreach program like this may be beneficial from improving regular screening among rural women in the state of Kansas.
Strengths of our study include the large overall sample size, the use of objectively measured claims data to capture screening frequency (as opposed to self-report measures), and the use of a variety of sociodemographic factors as opposed to a single construct.
This study also contained some notable limitations. For instance, given that a total of twenty-five Native Americans were included in this study, we concede that findings related to this group may not be representative of the group as a whole; this is regrettable, especially given Kansas’ sizeable Native American population (estimated at just over 60,000, or 2.1%, of the state in 2017). 24 As described earlier, the database used for the study also necessitated that the ages under study be restricted to a relatively small range, thereby further limiting the generalizability of our findings. The database also does not constitute a complete listing of a woman’s medical history, for instance, it is entirely feasible that a mammogram could have been received and not recorded with Centrus Health. Additionally, the RUCA was used to define a zip code as rural or urban; however, this definition is likely stricter than is necessary. Further, the arguably rudimentary nature of the prediction model is another limitation; further work is needed to refine and assess the model’s utility before recommending it be used by clinicians and other health professionals.
Conclusion
Given its large rural population, Kansas is a feasible environment for studying the impacts of rurality; in this case, on adherence to and compliance with various mammography screening guidelines. Our findings suggest that improving rural women’s access to (and awareness of) mammography may be important targets for improving overall adherence to screening regimens, particularly in regions with large rural populations.
Footnotes
Declaration of Conflicting Interests
The author(s) declared no potential conflicts of interest with respect to the research, authorship, and/or publication of this article.
Funding
The author(s) received no financial support for the research, authorship, and/or publication of this article.
Ethics Statement
The present study does not meet the definition of either an animal or a human study.
Appendix A: Detailed Demographics of Analytic Sample
* Descriptive statistics presented as mean (SD) for continuous variables and N (%) for categorical.
Description
Summary Statistics
Age
49.11 (2.62)
Ethnicity = Hispanic
253 (4.0)
Insurance = public
270 (4.3)
Rural = yes
547 (8.6)
Race
AAPI
176 (2.8)
Black
626 (9.9)
Native American
25 (.4)
Other
449 (7.1)
White
5060 (79.9)
Facility type
Critical access hospital
38 (.6)
Mobile unit
72 (1.1)
Office
1776 (28.0)
Other
2013 (31.8)
Outpatient hospital
2437 (38.5)
Number of unique women
6336
Average number of claims
2.30 (1.32)
Average compliance ratio
.52 (.32)
Appendix B: Compliance (Categorical) by Sociodemographic Factor (Row Values)
* Results given as proportion of sampled group meeting given compliance; values can range from 0 to 1.
Compliance Proportion
Full
3/4
1/2
1/4
Race
AAPI
.292
.315
.528
.753
Black
.233
.286
.503
.758
Native American
.25
.25
.417
.833
Other
.232
.281
.491
.776
White
.259
.306
.532
.799
Ethnicity
Non-Hispanic
.246
.287
.496
.761
Hispanic
.267
.297
.496
.733
Rurality
Urban
.254
.296
.512
.778
Rural
.183
.21
.366
.618
Insurance type
Public
.25
.29
.503
.767
Private
.193
.263
.433
.707
Facility
Critical access hospital
.132
.184
.263
.526
Mobile unit
.25
.347
.472
.694
Office
.236
.276
.499
.766
Other
.261
.307
.535
.798
Outpatient hospital
.246
.283
.476
.741