
Abstract
Artificial Intelligence (AI) is the subject of a challenge and attention in the field of oncology and raises many promises for preventive diagnosis, but also fears, some of which are based on highly speculative visions for the classification and detection of tumors. A brain tumor that is malignant is a life-threatening disorder. Glioblastoma is the most prevalent kind of adult brain cancer and the 1 with the poorest prognosis, with a median survival time of less than a year. The presence of O6 -methylguanine-DNA methyltransferase (MGMT) promoter methylation, a particular genetic sequence seen in tumors, has been proven to be a positive prognostic indicator and a significant predictor of recurrence.
This strong revival of interest in AI is modeled in particular to major technological advances which have significantly increased the performance of the predicted model for medical decision support. Establishing reliable forecasts remains a significant challenge for electronic health records (EHRs). By enhancing clinical practice, precision medicine promises to improve healthcare delivery. The goal is to produce improved prognosis, diagnosis, and therapy through evidence-based sub stratification of patients, transforming established clinical pathways to optimize care for each patient’s individual requirements. The abundance of today’s healthcare data, dubbed “big data,” provides great resources for new knowledge discovery, potentially advancing precision treatment. The latter necessitates multidisciplinary initiatives that will use the knowledge, skills, and medical data of newly established organizations with diverse backgrounds and expertise.
The aim of this paper is to use magnetic resonance imaging (MRI) images to train and evaluate your model to detect the presence of MGMT promoter methylation in this competition to predict the genetic subtype of glioblastoma based transfer learning. Our objective is to emphasize the basic problems in the developing disciplines of radiomics and radiogenomics, as well as to illustrate the computational challenges from the perspective of big data analytics.
Keywords
Introduction
Brain cancer (tumor) is defined as aberrant and uncontrolled synaptic growth. Because the individual skull is inflexible and volume limited, any surprising growth in the brain may impact a human capability; moreover, it may swell into other body parts and affect individual capacities. 1 According to the WHO’s cancer report, Brain Tumor (BT) accounts for fewer than 2% of all cancers in humans; nonetheless, severe bleakness and problems are observed. BTs are classified into 2 types: those that grow inside the brain (primary brain tumors), which account for 70% of all BTs, and those that bulge into the brain from other areas of the body (secondary brain tumors), which account for 30% of all BTs, the majority of which are malignant. 2 The short intervention required is determined on the tumor extent, its type, and its location in the brain. Generally, brain surgery is seen to be the best approach to treat tumors. 3
The most common forms of brain tumors are gliomas, which account for roughly 30% of all BTs and Central Nervous System tumors and nearly 80% of all dangerous BTs. 4 magnetic resonance imaging (MRI), among other therapeutic advancements, provides information regarding tumor location and size. Its operation is based on the activity of protons enclosed in a massive magnetic field, which is accomplished by moving radiofrequency waves and recouping their stable condition. 5 MRI, among other therapeutic advancements, provides information regarding tumor location and size. Its operation is based on the activity of protons enclosed in a massive magnetic field, which is accomplished by moving radiofrequency waves and recouping their stable condition. 6 High precision MRI technology is fairly capable of separating delicate tissues decisively and is more sensitive to changes in tissue firmness necessary for pathological consultation. The MRI scans are classed as T1-weighted (T1-w), which is commonly used in non-invasive brain research.T2-weighted (T2-w) MRI slices, on the other hand, are significant MRI slices that are appropriate for perceiving the border structures of medical sequences. 7 The O6 -methylguanine-DNA methyltransferase (MGMT) gene, which codes for a DNA repair enzyme that can reverse the effects of alkylating chemotherapy, is found on chromosome 10q26. The MGMT gene is frequently inactivated in malignant gliomas due to abnormal methylation of its promoter region. The methylation status of the MGMT promoter has gained therapeutic significance as a biological marker combined to responsiveness to alkylating treatment and longer survival in glioblastoma patients. 8 MGMT promoter methylation testing is also being utilized as a patient selection marker in clinical studies, such as the current CENTRIC study, which is concentrating on patients with MGMT promoter-methylated glioblastomas. 9 The primary mechanism of MGMT gene silencing is promoter methylation, which predicts a positive prognosis in individuals with glioblastoma. This biomarker is on the cusp of being used to stratify or even select glioblastoma patients for clinical trials.10-12 In some glioblastoma subtypes, such as anaplastic gliomas, the importance of MGMT promoter methylation may go beyond predicting chemosensitivity and may represent a unique molecular profile. The most widely used assays for determining MGMT status, define the requirements for standardized testing, and assess the causes for test repeatability issues. 13 MGMT promoter methylation status is being employed as an essential stratification or selection criterion in ongoing clinical studies, despite the fact that treatment decisions in the regular context are not yet based on this marker. 14
Despite the potential benefits of tumor genetic biomarker testing, price and the requirement for direct tissue sample remain barriers to its broad clinical usage. As a result, non-invasive genetic biomarker status assessment using preoperative imaging has the potential to enhance glioblastoma patient treatment. 15
Deep Learning (DL) is a discipline of AI technology that simulates the functioning of the human brain in data processing and the generation of prototypes useful in making appropriate decisions. DL computations make use of a variety of non-linear layers that are well-organized for extracting features from region of interest. DL is considered to be a promising option to predict MGMT promoter methylation status of glioma patients.
16
The efficacy of the current standard of care in glioblastoma patients is associated to the promoter of the MGMT gene.
17
Deep neural networks may learn hierarchical characteristics from the input sequences rather than utilizing pre-defined hand-crafted features. Several previous studies have shown that quantitative image characteristics (such as tumor subcompartment ratios, difusivity values, and image texture features) may be utilized to predict MGMT hypermethylation on preoperative glioma imaging.18-20 Artificial intelligence and deep learning are 2 novel approaches for automating difficult medical imaging procedures that have recently developed. Deep convolutional neural networks (dCNNs) in particular have proven the capacity to quickly and accurately separate glioblastoma subcompartments from MRI images.21,22 Image feature based in Radiomics extraction tools and automated tumor segmentation provides an impartial and repeatable approach for retrieving quantitative image features.23,24 Deep learning methods need a massive training data to prevent the over-fitting problem, as well as a lot of processing power to speed up the training process. When used in conjunction with proper weight initialization and optimization techniques.
25
Deep convolution neural networks (CNNs), a recent innovation in deep learning, have shown success in the categorization of pictures. Deep learning is extremely effective for feature representation, thoroughly displaying both low-level and high-level information, and embedding the feature extraction and classification phases into self-learning, although it often requires a large training dataset.
26
The training datasets for most medical imaging scenarios are tiny, using deep learning and training CNN from scratch on such a short dataset is a difficult undertaking. In order to solve this challenge, we present a technique based on transfer learning and a pre-trained deep CNN model in Figure 1.
27
Transfer learning architecture.
In this context, Big data has implications for predictive analytical methods and machine learning platforms for medical decision medical. The processing of massive medical data including the training, test and prediction data impact supports machine learning algorithms and predictive analytical approaches for the supply of long-term solutions for the implementation of treatment plans and individualized medical care.28,29 Predictive medicine aims the acquired knowledge from analyses of clinical data, genomic medical data, and multimodal imaging to better understanding of disease development, therapeutic efficacy, and prevention in order to create novel, individualized medicines and interventions (see Figure 2).
30
These developments include the creation of big data analytics tools, research into precision medicine, standardization of the collection, storage, and open sharing of de-identified patient electronic health records (EHR), as well as a significant amount of patient involvement (self-assessment and reporting).
31
Radiogenomics system diagram.
Radiomics, which involves the high-throughput mining of quantitative image features from routine medical imaging, is playing an increasingly important role in cancer research because it makes it possible to extract data and use it to enhance the diagnostic, prognostic, and predictive accuracy of clinical-decision support systems. A useful tool for modern medicine, radiomic analysis makes use of complex image analysis software as well as the quick creation and validation of medical imaging data using image-based signatures. 32 The difficulty comes from the need to integrate diverse data and analyses it jointly in order to facilitate the discovery of new knowledge. Genomic analysis for medical data is important components of improvements in precision medicine. The challenges presented by radiomics, which provide a large number of quantitative scans features, are diverse. Simultaneously, there is a critical need to take into account computationally effective ways to enable the joint mining of radiomics, genomes, and clinical data (see Figure 2) and to promote the finding of Radiogenomics-related synergistic patterns. 33
Through the connotation of quantitative imaging features for tumor phenotyping and genomic signatures, Radiogenomics has grown significantly over the last 10 years and shown significant potential for the development of non-invasive prognostic and diagnostic methods, as well as the identification of biomarkers for treatment, particularly for cancer. Radiogenomics research benefits from the use of big data programming models and deep learning paradigms, which not only help to leverage computationally intensive tasks but also significantly aid in the development of new algorithms, methods, and workflows through effective data acquisition, storage, sharing, and indexing. Deep learning techniques train sophisticated classifiers to produce higher classification results by utilizing enormous datasets. Unfortunately, understanding how deep learning hidden layers work is frequently is considered tough.34,35
This is particularly true when deep learning techniques are applied for task of Brain Tumor Radiogenomics Classification of MGMT promoter methylation in malignant gliomas-based Transfer Learning presented in (Figure 2). Our work focuses on the particular clinical aspects based on transfer learning architecture, as indicated in Figure 1. The developing field of Radiogenomics holds a lot of potential for precision medicine-based transfer learning approach showing a promoter result for the classification of MGMT methylation in malignant gliomas. The rest of the paper is organized as follows: In Related Works, we will detail the description of our datasets as well as the mathematical modeling.in Methods and Materials we will designate our results based a comparative cases of transfer learning algorithms and discuss the impact of the classification of our approach of MGMT methylation in malignant gliomas classification. Finally, Results provides concluding remarks.
Related Works
The diagnosis, prognosis, evaluation of the therapeutic response, and follow-up of glioma patients are all significantly influenced by conventional magnetic resonance imaging (MRI). However, standard diagnosis of MRI images makes it challenging to ascertain the status of MGMT promoter methylation. The investigation of tumor biomarkers by radiomics has grown in popularity as a result of the quick development of molecular diagnostics and artificial intelligence.36-38 In general, “radiomics” refers to the extraction and high-throughput analysis of a wide variety of sophisticated quantitative imaging data from medical scans. Radiomics is the term used to describe the high throughput extraction and analysis of several advanced quantitative imaging aspects.39,40 These characteristics, or radiomics features, might highlight possible tissue and lesion traits including tumor heterogeneity. Radiomics has been used extensively to forecast glioma genetic indicators, such as alterations in the enzyme isocitrate dehydrogenase.16,41,42 However, due to technical restrictions, such as the inability to get tumor tissues, the high cost of detection, and the great complexity of intralesional heterogeneity, determining the MGMT methylation status using molecular approaches continues to be difficult. To get around these issues, we looked at whether it was possible to forecast the MGMT methylation status beforehand and noninvasively using a unique radiomics-based machine learning (ML) model.
Han et al study’s 43 using methylation data from TCGA and MRI images of glioblastoma patients obtained from TCIA showed an accuracy of 67% for the test data and 62% for the validation data. Convolutional recurrent neural network architecture was utilized (CRNN). Analysis was done on common imaging characteristics such tumor location, midline crossing, multifocality, necrosis, oedema, and enhancement. The cross-validation findings showed that the GA-based wrapper model had an excellent performance for predicting the MGMT methylation status in GBM, with a sensitivity of .894, specificity of .966, and accuracy of .925 according to Duyen et al 44 The performance of the XGBoost model was greatly enhanced by the combination of radiomics feature extraction and F-score feature selection, which may have consequences for patient classification and treatment approach in GBM. Nine radiomics characteristics that performed better than other classifiers, with an area under the curve of .896, were reported. 45
Comparaison of Deep Learning Algorithms for MGMT Prediction.
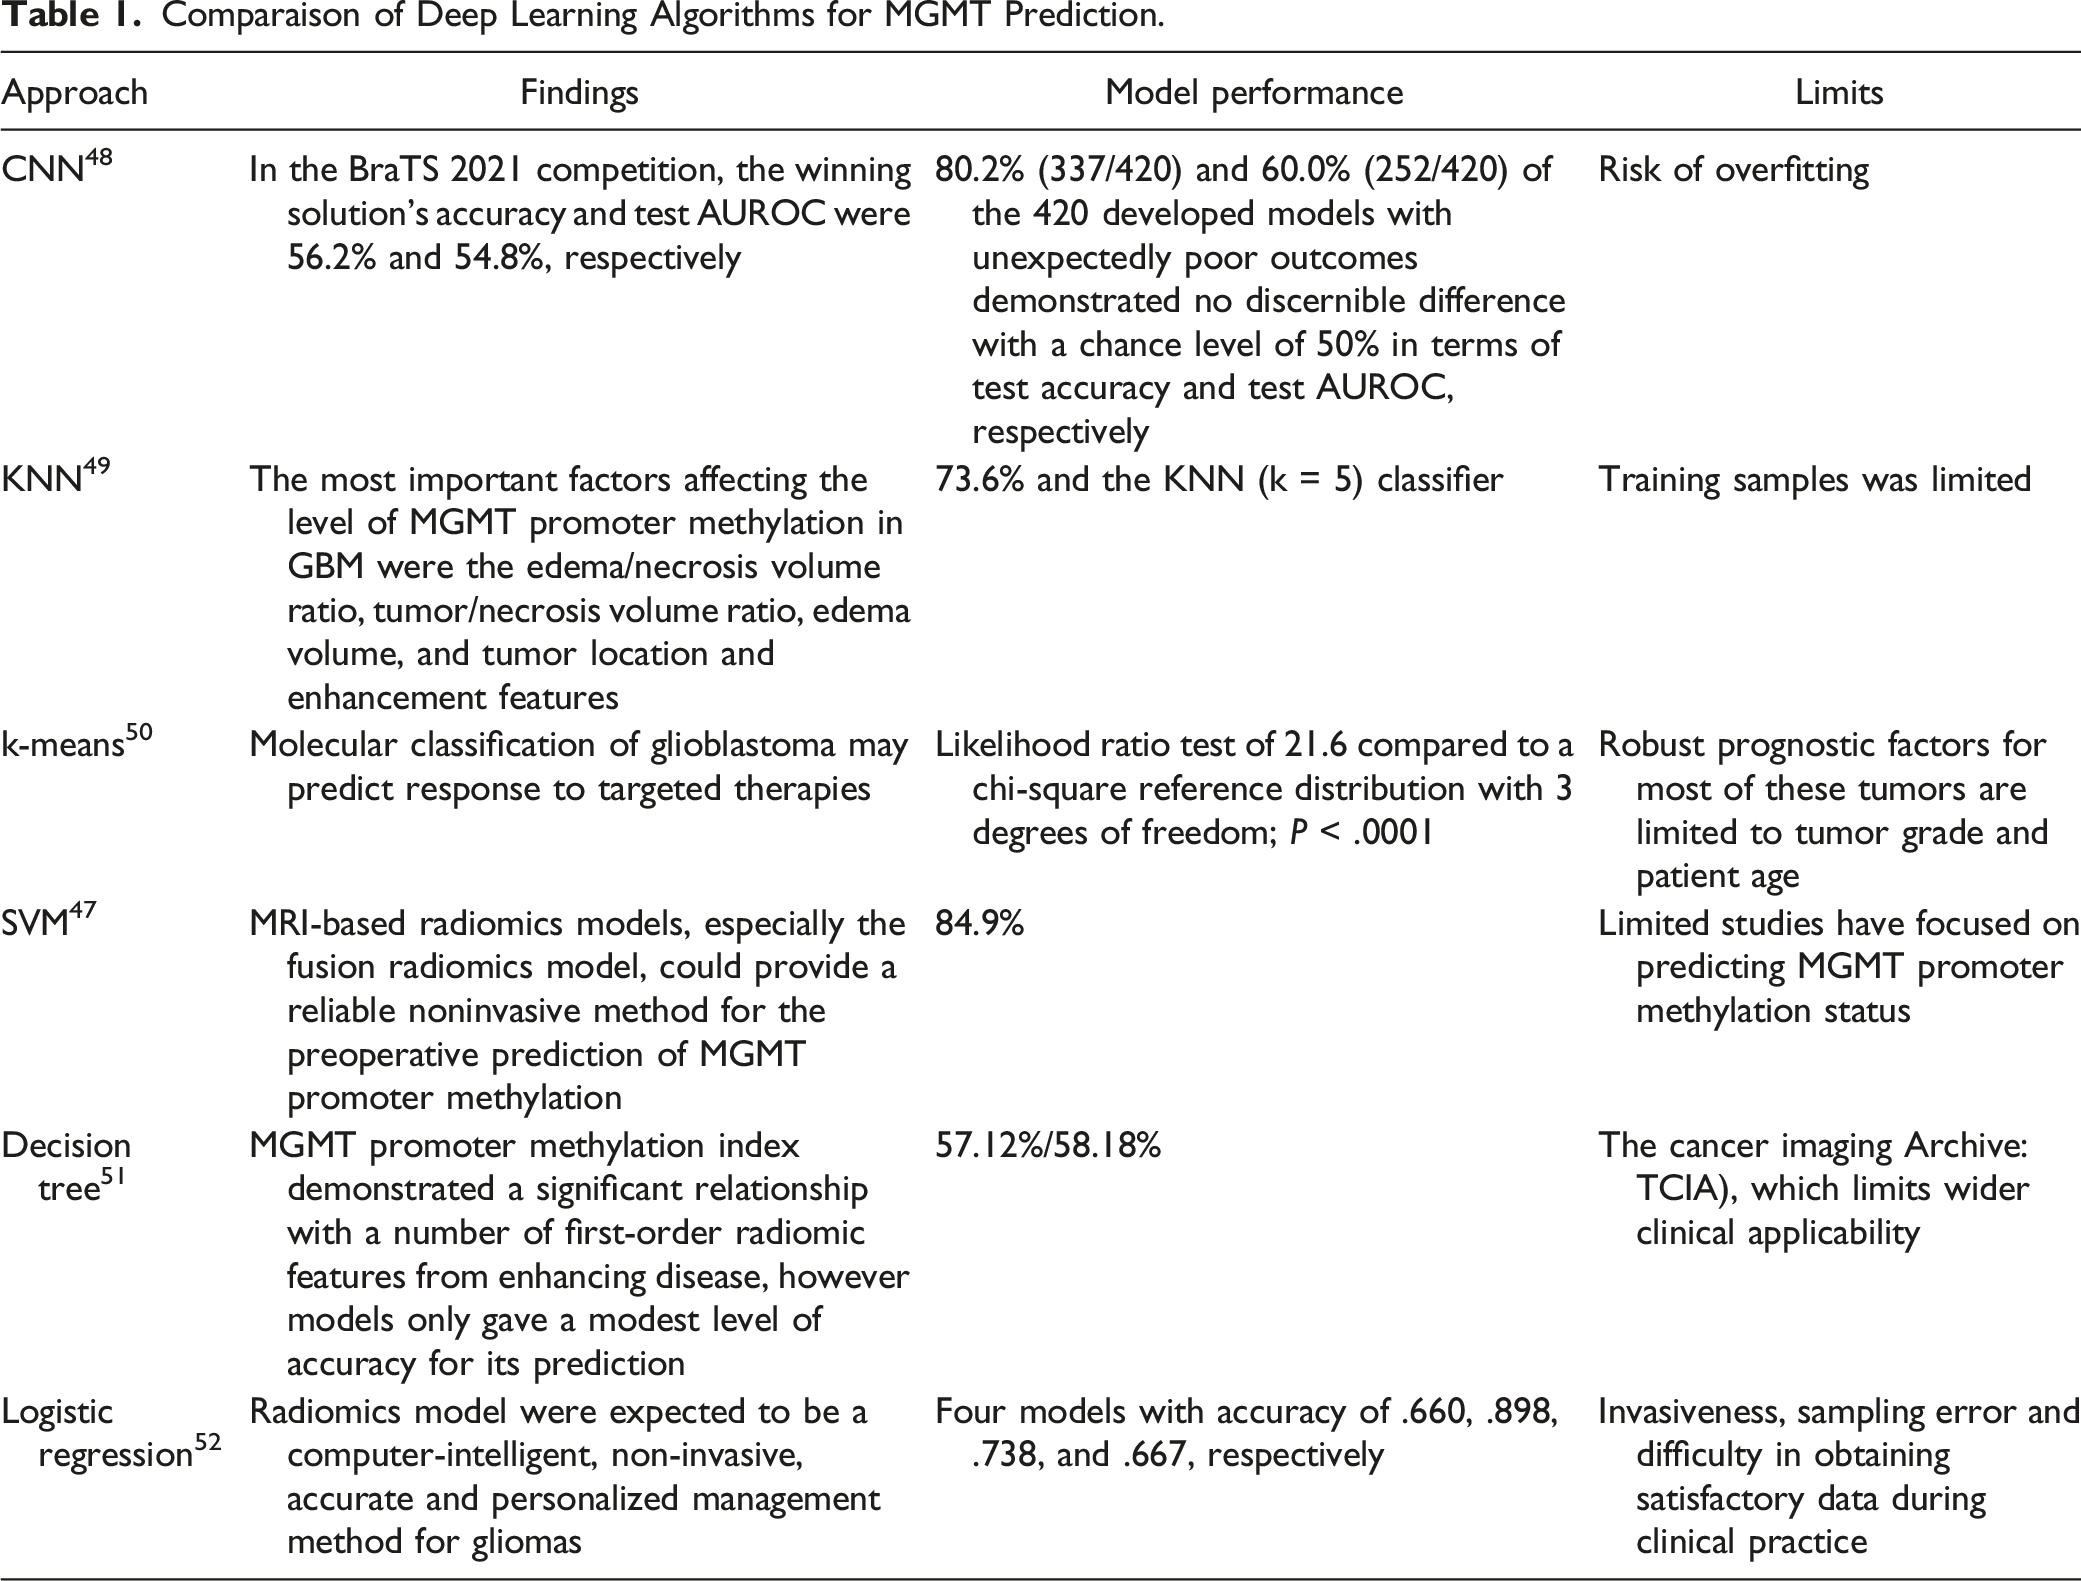
Glioblastoma with MGMT methylation exhibited mass-like edema with irregular enhancement, whereas glioblastoma without MGMT methylation exhibited infiltrative edema with thick enhancement, according to some earlier studies. 53 For more than 10 years, numerous researchers created models to forecast MGMT based on these radiological characteristics of conventional MRI, including radiomics approaches using high-throughput quantitative imaging features. 54 However, the majority of these studies either used a small dataset or did not conduct any external validation, which is insufficient to demonstrate generalizability.
comparaison of Transfer learning algorithms for MGMT prediction.

Methods and Materials
The goal of this work is to use DL algorithms and a Transfer Learning (TL) strategy to improve the accuracy of MGMT identification. The task of using a pretrained system’s knowledge to learn new models from new data is known as TL. It is typically much quicker and easier to calibrate a pretrained system with TL than to start from scratch. Pretrained DL systems enable us to pick up new tasks. Here, we performed with database from Kaggle 55 to evaluate 17 distinct DL models, including (“Alexnet, ImageNet,Googlenet, Resnet18,Resnet50,Resnet101,vgg16,vgg19,Inceptionv3,Inceptionresnetv2,Squeezenet,,densenet201,mobilenetv2,shufflenet, Xception,nasnetmobile, nasnetlarge”) and TL approaches to the provided dataset using Matlab-R022 was applied based on “Deep Network Designer” and “Transfer Learning” Toolbox.
These pre-trained CNN models are used in TL to separate out distinguishing and important features that may be seen. Last but not least, the softmax layer is used to classify these traits with the following parameters 1(S)*1(S)*1000(C)*1(B). Collected and sliced into cancerous MRI images of the brain. The suggested approach includes the following stages: pre-processing, data division and augmentation, feature extraction based on DL, and classification of MGMT promoter methylation in malignant gliomas.
Exprimental Dataset
Following is the structure of these 3 cohorts: Each individual case has a unique folder with a five-digit number assigned to it. Four sub-files, 1 for each of the structural multi-parametric MRI (mpMRI) images in DICOM format, are contained within each of these “case” folders. These particular mpMRI scans are included: Fluid Attenuated Inversion Recovery (FLAIR) T1-weighted pre-contrast (T1w) T1-weighted post-contrast (T1Gd) T2-weighted (T2)
The training data contains 585 values each corresponding to a patient/subject. Each row is marked with target MGMT_value for each subject (BraTS21ID) in the training data (eg the presence of MGMT promoter methylation). From the training set 307 subjects reported presence of MGMT promoter, and 278 reported absences. The imbalance in the training data set is acceptable.
Mathematica Modeling
Extraction of Features Through Deep Learning
Convolutional neural networks and deep learning networks are examples of artificial neural networks. After being trained, CNN’s various layers and the pooling layers are used to map multi-dimensional MRI images in order to produce the best results. 64 The advantage of utilizing DL is that the system learns how to perform the feature extraction while it is being trained. DL networks use their own kernels or convolutional filters to extract features on their own. Furthermore, there are numerous small size filters in the Convolutional Layers (CL). To generate a tensor of features, these filters are applied to each layer. The number of steps the filter will take to advance from 1 point to the next is referred to as a “stride.” Practically, 1 or 2 pixels per step are sufficient; anything beyond this results in a complete decline in CNN output. 65 Understanding the conditions that must be met and how the data is sent to the system is necessary for structuring a CNN for a certain job. Additionally, it should be borne in mind when choosing the stride that the output should always provide a whole integer and never a fraction. If the filter in the convolution layer does not cover all of the input images, zero padding may occasionally be needed. To maintain equal spatial measurements, this is done.ReLU in the activation layer determines the tensor of feature maps that are produced using a CL. The RLU is the most commonly used activation function in DL systems, and it is used to constrain all negative values in the feature map to zero. In order to reduce the dimensions, the rectified features are connected to the pooling layers, which create tiny, non-overlapping areas as input and select a single value for each region. The 2 well-known functions that the pooling layers frequently use are average and pooling. 66
After the activation layer, a batch normalization layer is frequently used to standardize feature maps and normalize feature maps. This layer of normalization governs the network and quickens training. To outline the final result of the system, the features obtained from the most recent pooling or convolutional layers are converted to a 1-D vector and connected with at least 1 dense layer. A “soft” variation of the max function is the softmax function. Instead of choosing just 1 maximum value, it divides the entire distribution (1) into smaller halves, with the maximal element receiving the majority of the distribution and other smaller elements receiving the remainder. The Softmax layer, which is used to classify images and is often the last layer of the system, is formulated as follows:
3
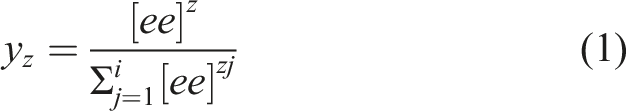
The classification layer is next applied, which calculates the cross-entropy loss due to classification and provides the final expected clear-cut labels for each MRI images. One often used substitute for squared error is the cross-entropy measure. When the output is a probability distribution, or when node activations can be regarded as expressing the likelihood that each hypothesis would hold, it is employed. At neural networks with softmax activations in the output layer, it is therefore employed as a loss function. Equation (2), where “s” denotes the labels sent to the target and “r” denotes the output from the softmax layer, provides the estimation of loss.
Regularization and Optimization Techniques
During training, a regularization function is used to prevent overfitting. It suggests use a function solver properly to prevent network overfitting. Overfitting has been avoided using a variety of techniques throughout preprocessing and training phases. Image data is initially supplemented to prevent overfitting. 67 Different system structures are then tested to prevent system irregularity. After that, dropout layers are used, to exclude hidden weights randomly. Finally, in some situations, the “early stop approach” is used to protect the system while it is being trained and validated and to halt the training process before all epochs have been completed. This prevents the system from being overfit. 68
The widely held of DL algorithms use various optimization techniques for either maximizing or minimizing a function 𝑓 (x) by varying x. The function is known as the cost function or loss (error) function once it has been minimized. In order to optimize an objective function 𝐽 (?) categorized by a model’s constraint θ ∈ R 𝑑, we use Gradient descent technique to reverse path of the objective function ∇θ 𝐽 (θ). Based in these parameters (w.r.t). ‘η’ provides the step size needed to reach the (local) minimum and is the learning rate. SGDM is a method that quickens the descent in the right direction and lessens oscillations. This is accomplished by adding of the update vector from the previous step to the current update vector.
Metrics for Assessment
Calculating important findings that are used to validate the performance of the classifier is used to evaluate the feasibility of the proposed BT detection and identification framework. Following is how the suggested framework performance is determined: 1. Accuracy: This refers to a system’s capacity to accurately identify the kind of BT and is determined by: 2. Specificity is the system’s capacity to accurately recognize the authentic BT, and it is calculated as: 3. Sensitivity is the ability of a model to accurately categorize the BT, and it is quantified as:


Results
Model Perfermance
In this paper, MGMT promoter methylation in malignant gliomas is classified according to brain tumor Radiogenomics subtypes using a Transfer Learning-based deep learning system. To achieve the system’s highest level of accuracy, the system is trained utilizing a variety of deep learning pretrained networks, including AlexNet, GoogLeNet, Vgg19, ResNet50, ResNet101 and others. By fine-tuning the characteristics, softmax layers of pretrained networks are used to identify images. Here, the skilled viewers can discern each detail by sight.The softmax layer performs BT classification by adding the number of neurons to 2 classes and adjusting DL networks to the objective dataset. As a result, it is crucial to adjust the optimal parameters in accordance with the results of training MRI images for performance improvement because these fine-tuned parameters are not self-trained. To achieve the best trained system possible, the system is trained multiple times for each of the aforementioned pretrained networks using a variety of well-known optimizers, including Stochastic gradient descent with momentum (SGDM). The training progress and loss of the pre-trained networks of each transfer learning analogue in our modeling system are shown in Figure 3(A-Q). Perfermance of models -based transfer learning.
The original data with image seize (random) 512*512*3 with 4 classes composed of included the following scans: Fluid Attenuated Inversion Recovery (FLAIR),T1-weighted pre-contrast (T1w),T1-weighted post-contrast (T1Gd) and T2-weighted (T2).The number of original image is 498 while the training image is 348 and the validation dataset is composed of 150 Sans. The pre-trained -model of each neural network is depicted in Table 2. We have proceeded with pre-trained model with 70% training data and 30% for the validating data for the classification MGMT promoter methylation. The confusion matrix is widely used to show how a certain classification network is performing on a test dataset where the real values are already known. The confusion matrix that summarizes the effectiveness of the method for classifying MGMT promoter methylation in malignant gliomas is shown in Figure 7. The Target class is shown on the X-axis of the provided matrix, while the Output class is shown on the Y-axis. The training outcomes of several pretrained DL networks employing the SGDM optimizer listed in the table, along with training time, are shown in Table 2. It is clear from the data listed above that, when compared to the other networks described, the pretrained network Resnet50 has produced the best results in the shortest amount of computing time. The provided training curves make it obvious that Resnet50 and densenet201 attained 100% accuracy after complete iterations. The performance of each models of Transfer Learning is depicted in Figure 3 as follows:
Statistical Analysis
After normality testing, the statistical differences between quantified APTw parameters for methylated and unmethylated GBMs were analyzed using Mann-Whitney U-tests. The diagnostic performance was evaluated using Receiver Operating Characteristic (ROC) curves for the important different APTw parameters. Statistical software was used to conduct the studies (SPSS, Version 23; Chicago, IL). Statistics were deemed significant for P values under .05.
Retrospective analysis was performed on 18 patients (aged 20-67) who met the eligibility requirements according to their medical data. From all subjects who underwent gross total resection (n = 15) or subtotal resection (n = 3) tumor tissue samples were provided for MGMT analysis. In 10 instances (55.6%, 47.3 14.3 years), a methylated MGMT promoter was discovered, and in 8 cases (44.4%, 51.1 12.4 years), an unmethylated MGMT promoter was established. Three of the subjects in this retrospective study had already discussed in this work. 69
Quantitative APTw Intensity Values and Associated Diagnosis Efficacy for Unmethylated and Methylated MGMT (O6-Methylguanine-DNA Methyltransferase) Glioblastomas (GBMs). 70
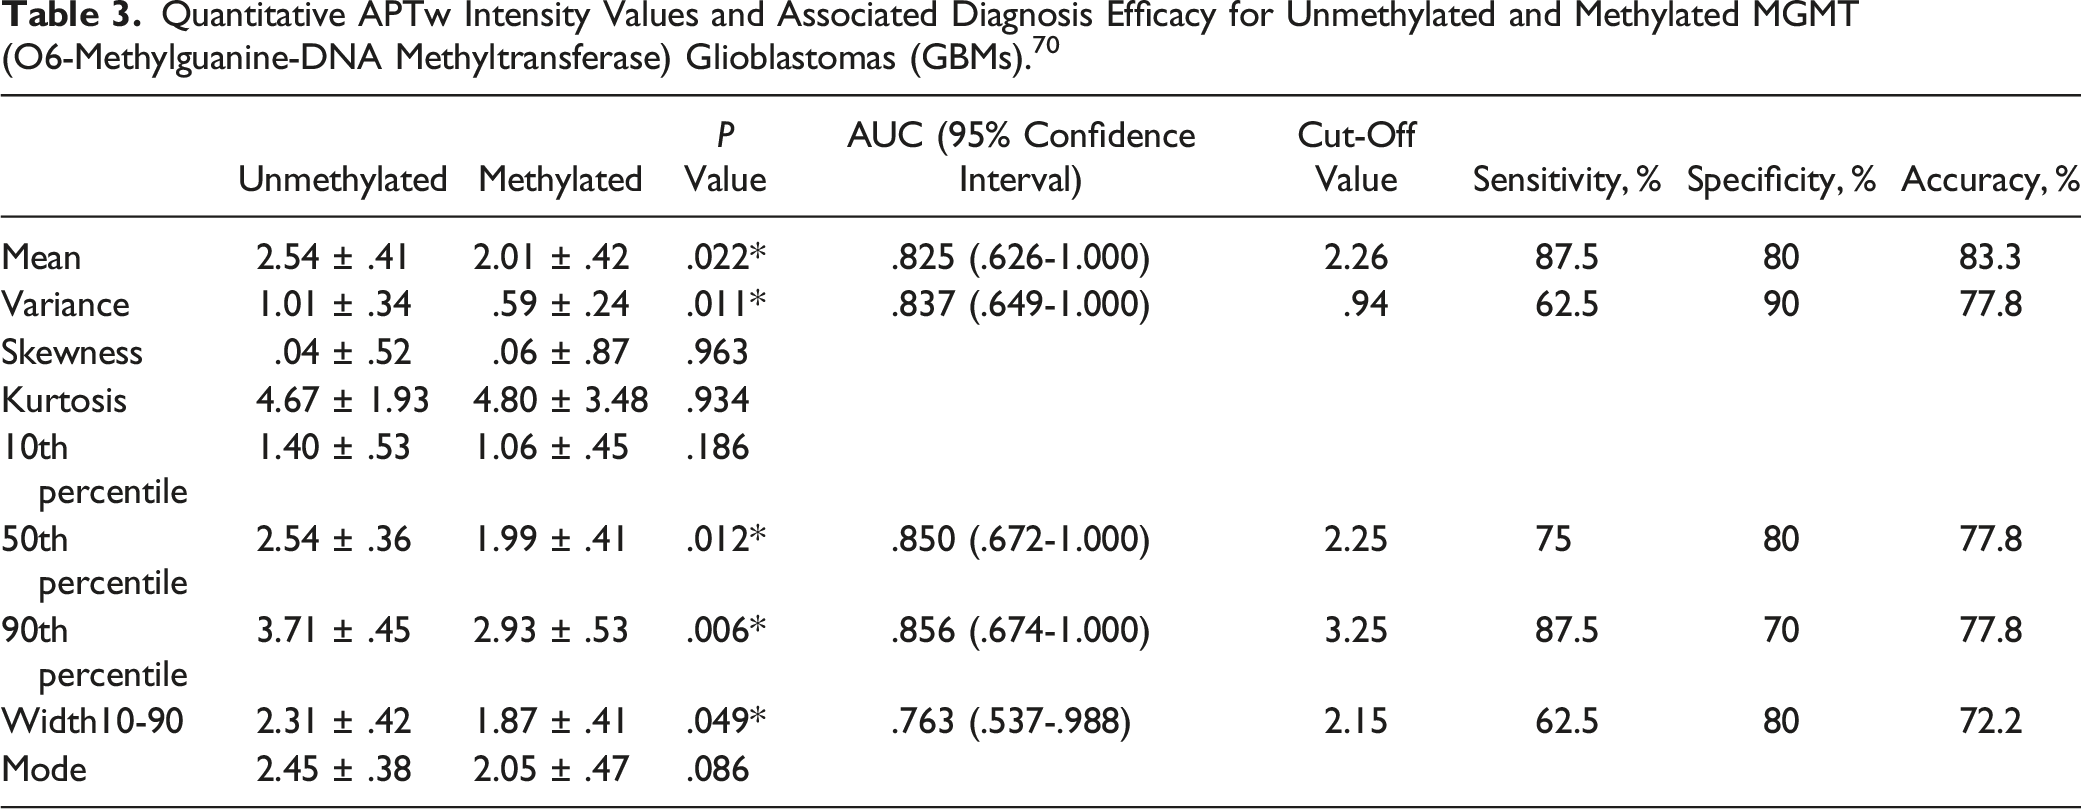
The whole-tumour APTw histograms for GBMs with methylated and unmethylated MGMT promoters are shown in Figure 4(A). Comparatively to methylated GBMs, the GBMs with an unmethylated MGMT promoter contained more voxels with APTw hyperintensity. Table 1 lists the histogram-based APTw measures for 2 groups of GBMs. The MGMT unmethylated GBMs had significantly higher Mean (2.54 .41 vs 2.01 .42; P = .022), Variance (1.01 .34 vs .59 .24; P = .011), 50th percentile (2.54 .36 vs 1.99 .41; P = .012), 90th percentile (3.71 .45 vs 2.93 .53 Comparison of O6-methylguanine-DNA methyltransferase (MGMT) promoter methylation levels in glioblastomas (GBMs) with unmethylated (n = 8) and methylated (n = 10) histograms of typical tumour mass. The ROC curve.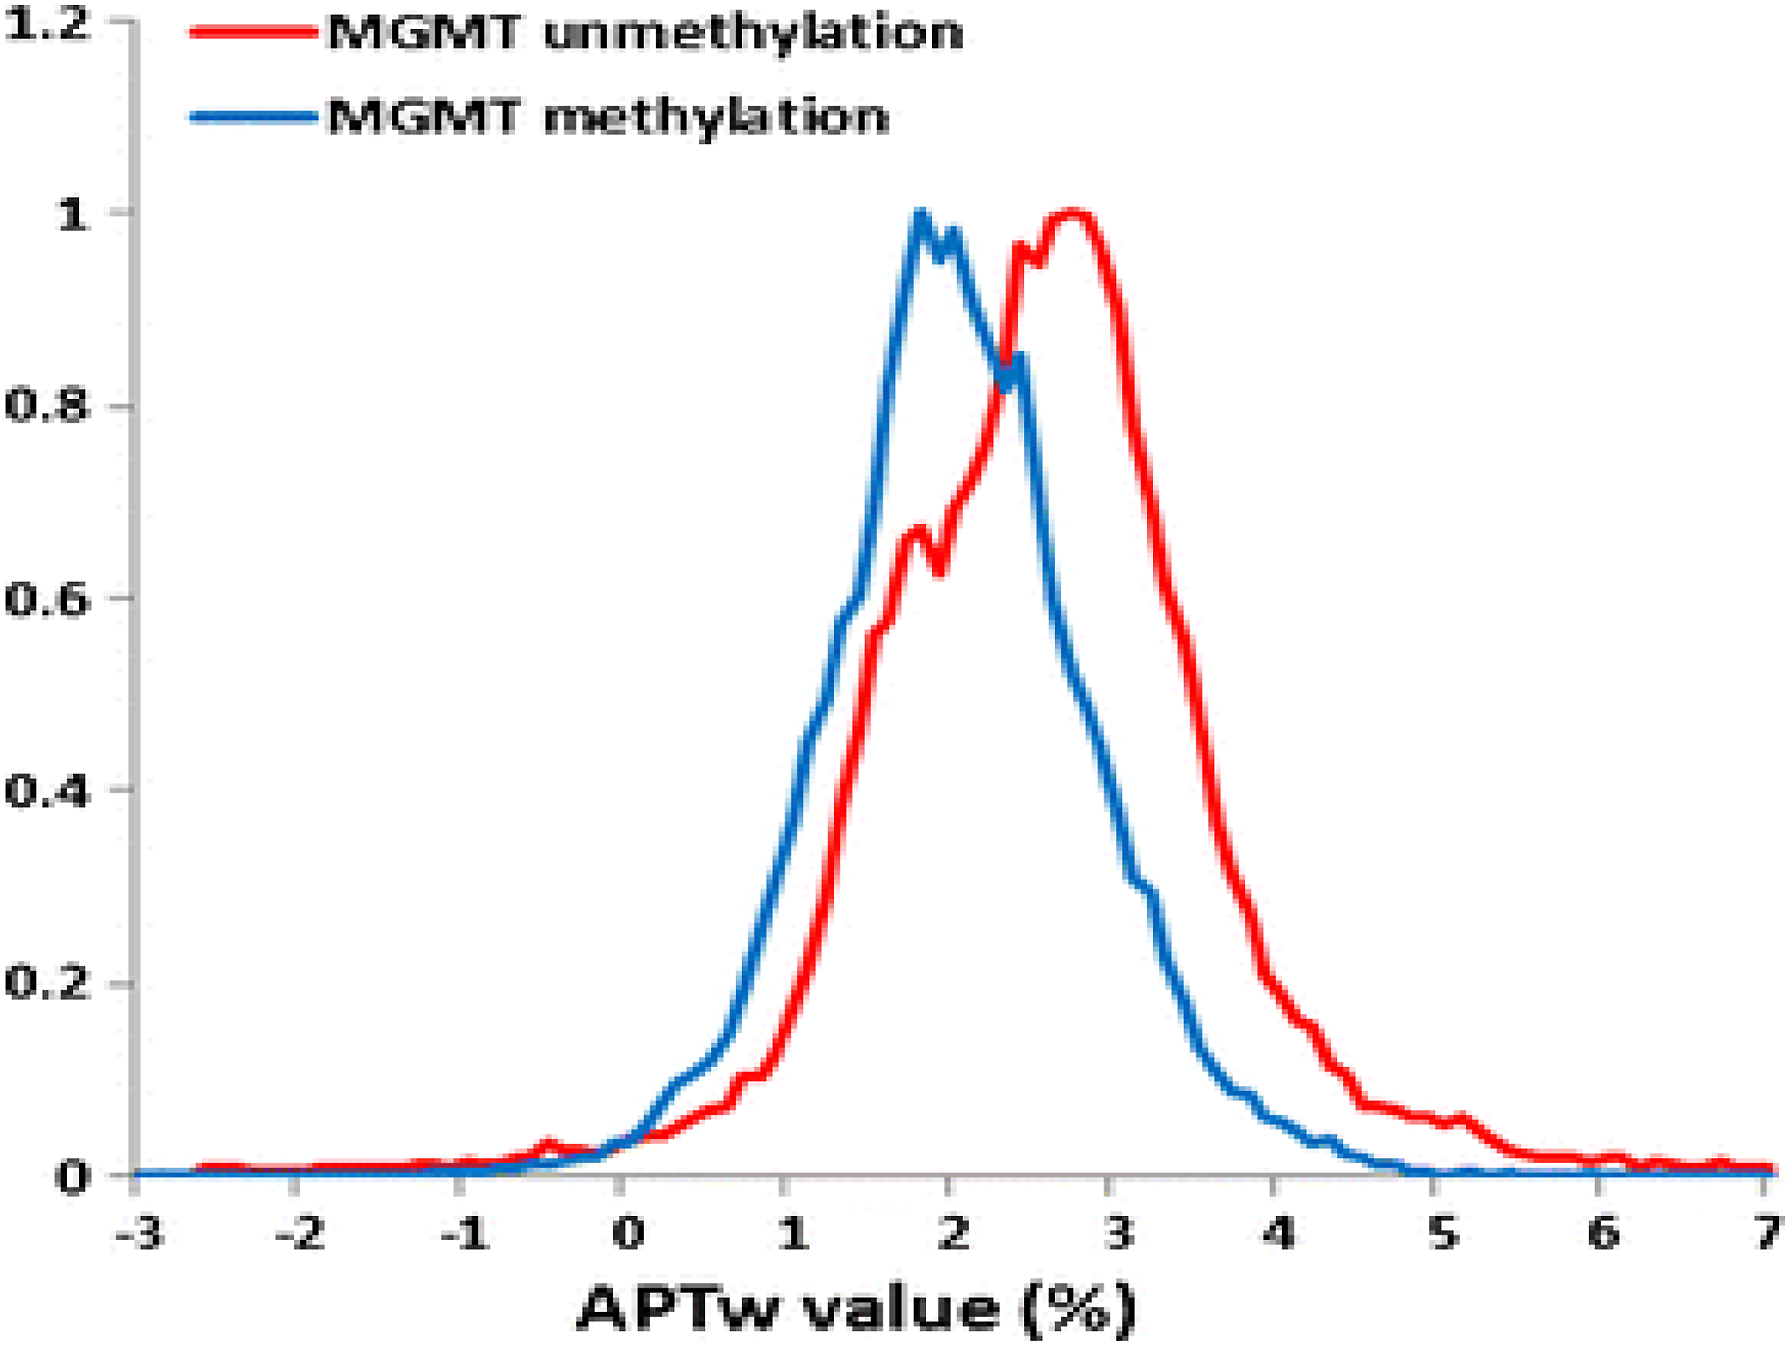

The median and 10th percentile readings demonstrated an upward tendency in the MGMT. In comparison to the MGMT methylated group, the 10th percentile and Mode values demonstrated a stronger tendency in the MGMT unmethylated group (P = .186 and .086, respectively). Skewness and Kurtosis did not vary between the 2 groups (P = .963 and .934, respectively), indicating that the 2 groups’ histograms’ nearly similar shapes.
Challenges of BraTS Project Radiogenomic Classification of MGMT Promoter Methylation in Malignant Gliomas
The dearth of data access and reporting, which obstructs clinical validation, is a significant obstacle to the therapeutic application of multimodal DL methods. It’s important to note that 2 included studies left out crucial details about the choice of data as well as the creation and assessment of models, leading to ambiguous assessments of the risk of bias. When evaluating the written literature, researchers and clinicians should always take the possible risk of bias into cautious consideration. The various degrees of bias risk found in the included studies emphasizes the need for uniform reporting standards to guarantee the accuracy and repeatability of findings. 71
Although the BraTS database was used by many of the computers in this research, they also used other institutions' imaging, genetic, and clinical data—some of which have not yet been published. Institutional patient groups tended to be tiny. Additionally, the majority of the used code and models were not published, which made it difficult for other researchers to evaluate those models using various data. Large amounts of extra data are needed for multimodal DL techniques, particularly in research involving triple and quadruple fusions. Because the BraTS dataset does not contain all of this information, academics must depend on data from their own organizations, which can be inaccurate and result in a dearth of training and testing data.The BraTS collection has been crucial in the creation and improvement of DL for glioma research. The MGMT promoter methylation status can be predicted using their imaging dataset using novel techniques (many of them DL), according to the annual BraTS challenge request for entries. Expanded information about elements that are well known to play a significant role in clinical outcomes, such as the histological type of tumors, thorough surgical, chemotherapeutic, and radiotherapeutic data, as well as the molecular characteristics of tumors, may be added to databases in the future. More high-quality data sources like these can significantly improve the data shortage and promote the application of new advancements in DL to these issues.
Discussion
Comparison of Transfer learning CNN Architecture for the Classification of MGMT Promoter Methylation in Malignant Gliomas.
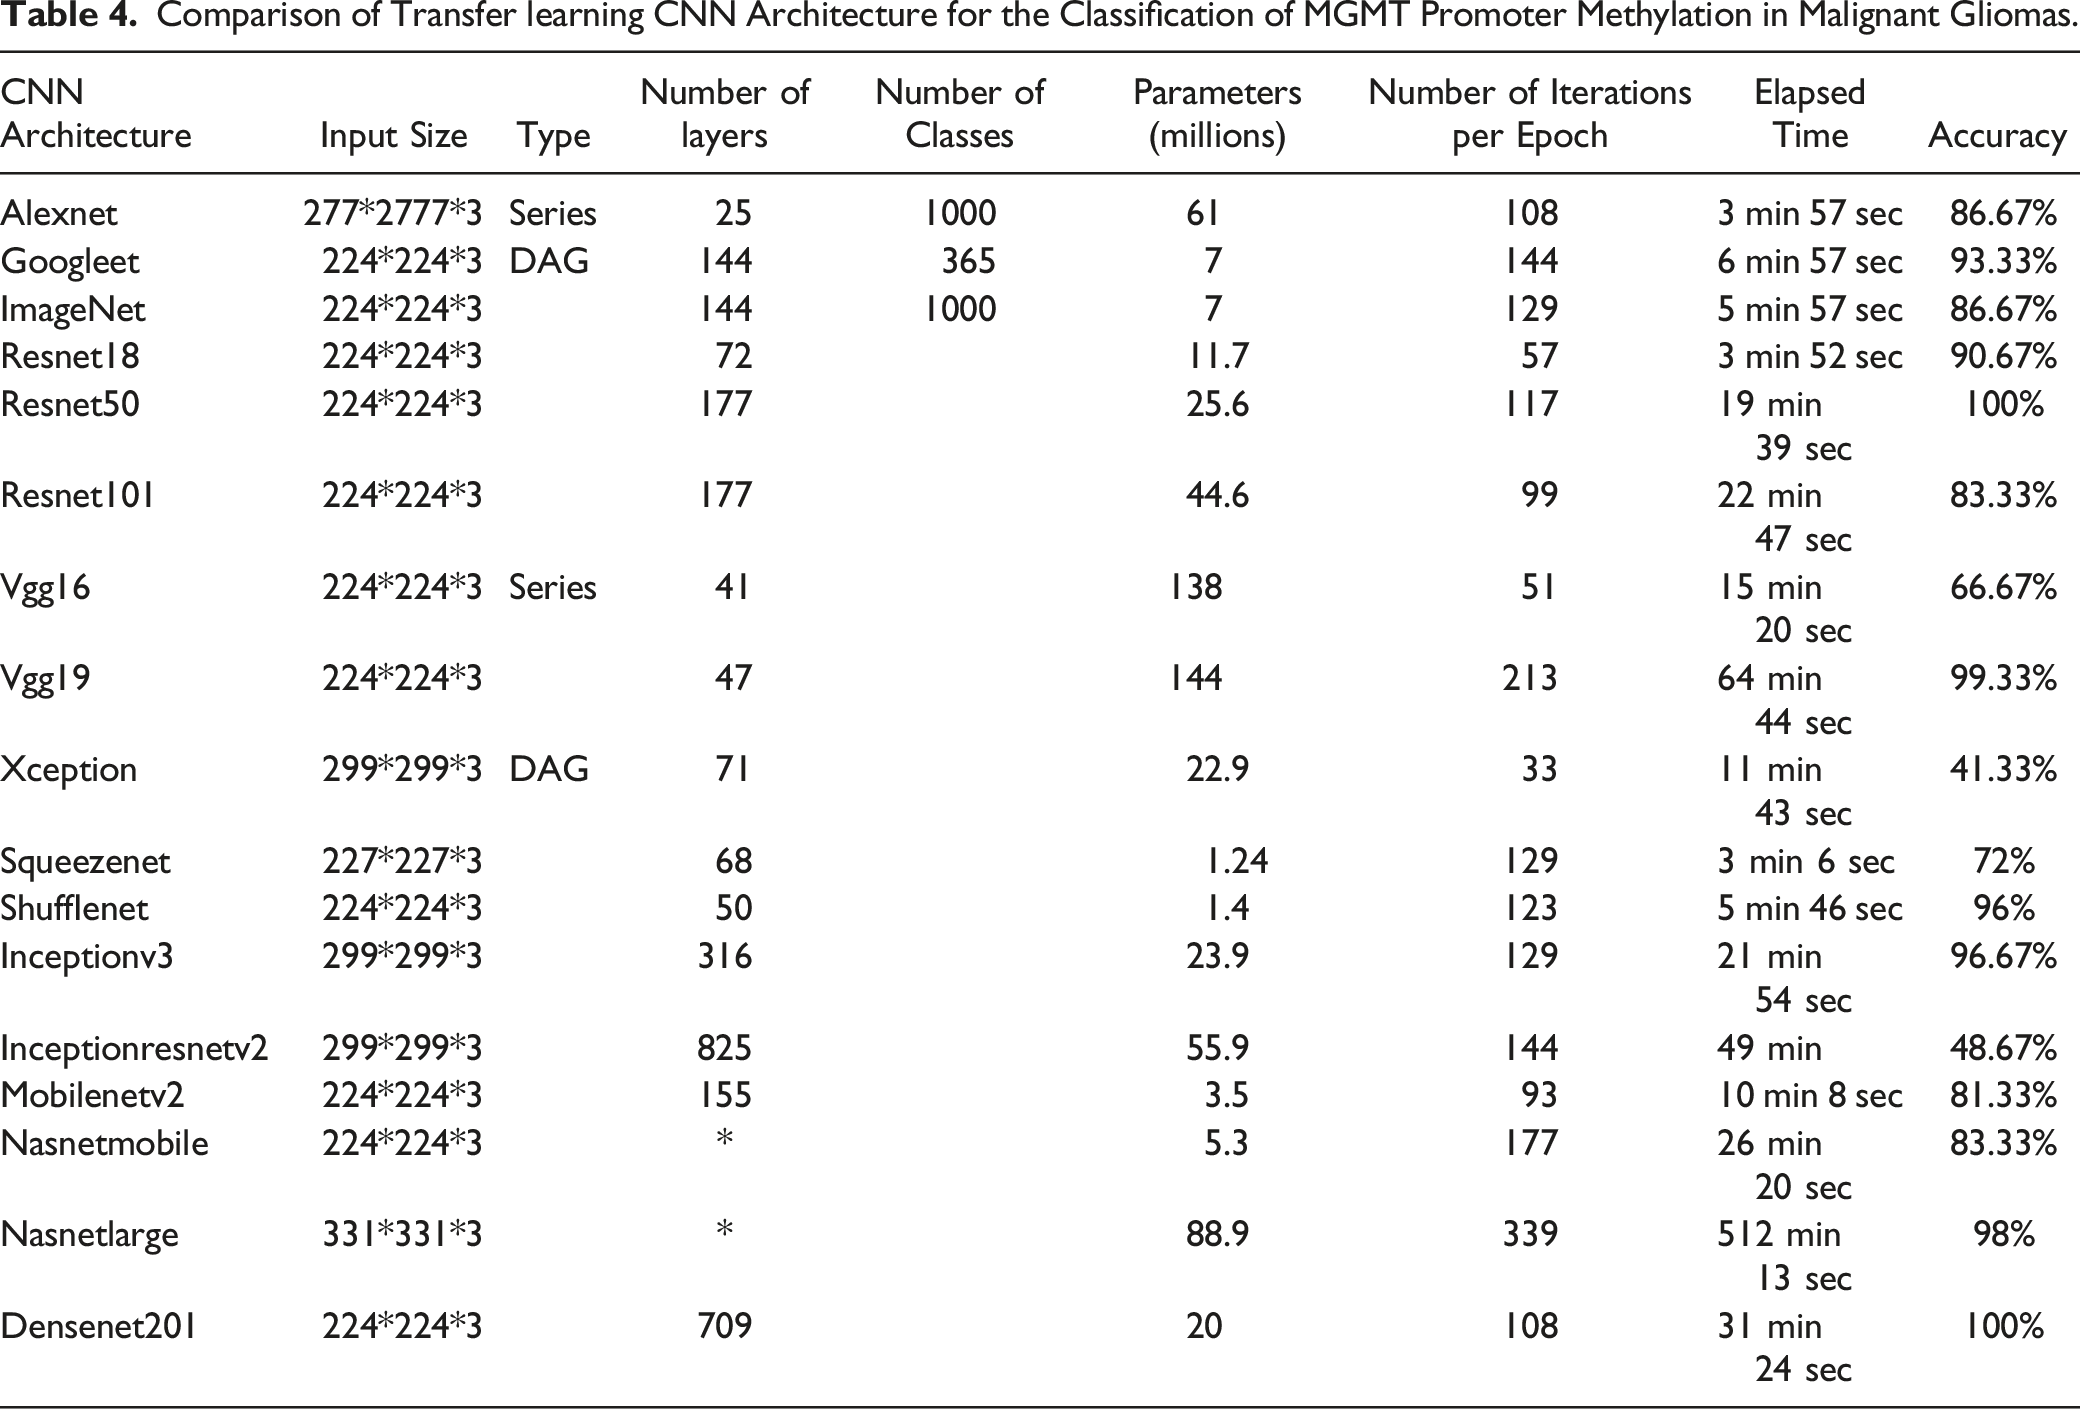
Comparatively, Xception, Inceptionresnetv2 and vgg16 the classifier shows the lowest accuracy respectively: 41.33%, 48.67%, and 66.67% mentioned in Table 4. This implies that there is some important information stored in the individual pixels, but that repeatability and performance are probably enhanced by adopting a technique that can better capture spatial information. We primarily focused on patient-level outcomes, using many MRI images for each patient to produce an ensemble forecast. Since being able to predict methylation status from a single MRI scan would be extremely useful to physicians and patients, we also evaluated the findings of MRI scans. In the test set, the findings at the MRI scan level were equivalent to those at the patient level, but the performance dropped in the validation set. This is probably because our classifier is less certain about the MRI scan level, which leads to more variation in the outcomes and prediction probabilities. The discrepancy in confidence between patient level and MRI scan findings shows that MGMT methylation prediction benefits from pooling data from many MRI scans. In other classification challenges, deep learning models have proved effective in learning several representations of the same object. However, we think it is more reliable and practically applicable to combine many representations of the same tumor to arrive at a forecast for each patient. We achieve this by majority vote. The performance of our model might be further enhanced by adding further layers that mix MRI scans.74,75
—Table 1 our classifier Resnet50 and densenet201 is overfitted to the training set since it has an accuracy for the training set that is almost 1.0. We used L2 regularization, dropout layers, and data augmentation to prevent overfitting. Regularization had only a little impact on reducing overfitting and raising performance, and additional regularization increases had a negative impact on validation set performance. Even if data augmentation was able to significantly slow down the rate of model overfitting, with enough training epochs, we can still achieve virtually flawless classification. The amount and variety of photos used for training also rose significantly as a result of data augmentation, which enhanced our model’s robustness and performance. The training based optimizable ensemble based Adaboost hyperparameters was performed with a 14 total cross validation and accuracy of 78.5%. The ROC curve, confusion matrix and the error classification are described respectively in Figure 6, Figure 7 and Figure 8: The confusion matrix. Minimum classification error.

Conclusion
In this paper, our work is within the goal for Brain Tumor Radiogenomics Classification of MGMT promoter methylation in malignant gliomas-based Transfer Learning. The task of using pretrained Deep Learning systems enable us to pick up new tasks. Here, we performed with database from Kaggle36 to evaluate 17 distinct DL models, including (“Alexnet, ImageNet Googlenet, Resnet18,Resnet50,Resnet101,vgg16,vgg19,Inceptionv3,Inceptionresnetv2,Squeezenet,,densenet201,mobilenetv2,shufflenet, Xception,nasnetmobile, nasnetlarge”) and we apply TL approaches to the provided dataset. This work seeks to predict the methylation status of MGMT from brain MRI data, we built a jointly trained, convolutional neural network-based Transfer Learning in this study. The second contribution is to depict the best classifier for the identification of MGMT which are Resnet50 and densenet201 with 100% accuracy Comparatively, Xception, Inceptionresnetv2 and vgg16 the classifier shows the lowest accuracy respectively: 41.33%, 48.67%, and 66.67%.
A brain tumor that is malignant poses a serious threat to life. Glioblastoma is the most prevalent type of adult brain cancer and also has the poorest prognosis, with a median survival time of less than a year. It has been demonstrated that the presence of a certain genetic sequence in the tumor known as MGMT promoter methylation is a positive prognostic factor and a reliable indicator of treatment responsiveness.
Currently, obtaining a tissue sample for genetic study of cancer requires surgery. The process of identifying the tumor’s genetic makeup can thereafter take many weeks. A later operation can be required, depending on the outcomes and the initial therapy method used. The number of surgeries and the type of therapy needed may both be reduced if a reliable approach for predicting the genetics of the cancer by imaging alone (ie, radiogenomics) could be created.
In conclusion, contrary to predictions, even in a deep learning method with a sizable multicenter dataset, MGMT methylation cannot be predicted using only conventional structural MRI. Radiogenomics has the potential to change how patients with brain tumors are treated in the future, but in order to enhance the noninvasive diagnostic performance of MGMT methylation, additional tumor features from advanced MRI, such as cellularity and angiogenesis, should be explored.
Footnotes
Acknowledgments
The dataset for this challenge has been collected from institutions around the world as part of a decade-long project to advance the use of AI in brain tumor diagnosis and treatment, the Brain Tumor Segmentation (BraTS) challenge. Running in parallel with this challenge, a challenge addressing segmentation represents the culmination of this effort.A comprehensive description of the both tasks of the RSNA-MICCAI Brain Tumor challenge can be found at: ![]() . The authors extend their appreciation to the Deanship of Scientific Research at King Khalid University for funding this work through large group Research Project under grant number RGP2/212/44.
. The authors extend their appreciation to the Deanship of Scientific Research at King Khalid University for funding this work through large group Research Project under grant number RGP2/212/44.
Declaration of Conflicting Interests
The author(s) declared no potential conflicts of interest with respect to the research, authorship, and/or publication of this article.
Funding
The author(s) received no financial support for the research, authorship, and/or publication of this article.