
Abstract
Objectives
Now a days, squamous cell carcinoma (SCC) margin assessment is done by examining histopathology images and inspection of whole slide images (WSI) using a conventional microscope. This is time-consuming, tedious, and depends on experts’ experience which may lead to misdiagnosis and mistreatment plans. This study aims to develop a system for the automatic diagnosis of skin cancer margin for squamous cell carcinoma from histopathology microscopic images by applying deep learning techniques.
Methods
The system was trained, validated, and tested using histopathology images of SCC cancer locally acquired from Jimma Medical Center Pathology Department from seven different skin sites using an Olympus digital microscope. All images were preprocessed and trained with transfer learning pre-trained models by fine-tuning the hyper-parameter of the selected models.
Results
The overall best training accuracy of the models become 95.3%, 97.1%, 89.8%, and 89.9% on EffecientNetB0, MobileNetv2, ResNet50, VGG16 respectively. In addition to this, the best validation accuracy of the models was 94.7%, 91.8%, 87.8%, and 86.7% respectively. The best testing accuracy of the models at the same epoch was 95.2%, 91.5%, 87%, and 85.5% respectively. From these models, EfficientNetB0 showed the best average training and testing accuracy than the other models.
Conclusions
The system assists the pathologist during the margin assessment of SCC by decreasing the diagnosis time from an average of 25 minutes to less than a minute.
Keywords
Introduction
Skin cancer is the most common type of cancer that affects humans worldwide. According to the literature out of three people diagnosed with cancer, there is a possibility of one patient with skin cancer.
1
It is a common type of cancer that starts to grow in the epidermis layer of the skin.2,3 The number of people affected by skin cancer will be expected to exceed 13.1 million by 2030.2,4 In the United States, the occurrence of skin cancer is reported to be 22.1 per 100 000 people. The number of new patients yearly predicted is expected to be more than 63 000, and skin cancer is now rated as the sixth most common of all cancers.
4
Skin cancer is generally classified into two major groups; melanoma and non-melanoma. The frequency of non-melanoma skin cancer (NMSC), including basal cell carcinoma (BCC) and squamous cell carcinoma (SCC) has increased from 3.4 to 4.9 million cases per year.
5
Nevertheless, they can be fatal when it is left undiagnosed and untreated early.
6
SCC accounts for most NMSC-related metastatic cancer diseases and death. According to Ref. 1 it is the second most frequent kind of skin cancer. Generally, scaly red spots, open sores, raised growths with a central depression, or warts are frequent signs of SCC. Nevertheless, there are three differentiation stages of SCC. These are (see Figure 1); (1) well-differentiated SCC, (2) poorly differentiated SCC, and (3) undifferentiated/or invasive SCC. The well-differentiated SCC is characterized by having one property of grade I SCC. The poorly differentiated property of cells indicates grade II and grade III SCC. Grade IV SCC can be characterized as an invasive/undifferentiated type. Visual inspection,, and histopathology are the current diagnostic methods for surgeons to differentiate between tumor and normal tissue for skin cancer including SCC. Of these techniques, histopathology diagnosis is the gold standard method used not only to identify its type but also for grading and diagnosing/assessing the tumor margins.
7
The differential diagnosis between SCC histologic grades is crucial, as it will further determine the therapeutic approach and follow-up of the tumor.
8
However, in this research, since we are focusing on the marginal diagnosis of the tumor, we consider all grades as malignant and the cancer-free margin as normal/or benign. Sample histopathology SCC images acquired from Jimma University Medical Center (a) Well-differentiated SCC, (b) Poorly differentiated SCC, (c) Undifferentiated/or invasive SCC. Abbreviation: SSC, squamous cell carcinoma.
As shown in Figure 1 above, in well-differentiated tumors, the cells are organized and have a shape that has been usually seen in normal tissue images. The poorly differentiated cells are looking disorganized when seen under the eyepiece of the microscope, and tend to grow and spread faster than grade I tumors, ie, the well-differentiated ones. Those SCC tumor cells, which are not differentiated, look highly disorganized and spread more tremendously than the poorly differentiated categories.
Therefore, early detection of skin cancer margin is required to prevent the progression of cancer to advanced stages and reduce cancer fatality. Nowadays, SCC is clinically diagnosed using dermoscopic examination and tissue biopsy followed by Mohs micrographic surgery (MMS).6,9 Among these, biopsy tests are the gold standard method in the diagnosis procedure of SCC. After diagnosis, for treatment planning, the surgical excision is the routinely used method for all SCC treatments, followed by a histopathological margin assessment of all ribs of the tumor. This would help for the confirmation of the total removal of the tumor cells. 10 A cancer margin, as defined by the National Cancer Institute (NIH), is “the edge or border of the tissue removed in cancer surgery”. 11 If the margin is assessed correctly, this border surrounds the cancerous tissue as well as a rim of normal tissue to later confirm a successful resection. Histopathological assessment of surgical margin is performed by analyzing by taking sample tissue from all margin and examining it under the microscope. Surgery can cure ∼45% of all patients with cancer, 5 however, in 40% to 50% of cases a remaining tumor cell is found at the margins, 7 and extra surgery is required, which results in sophisticated treatment, high cost, greater morbidity, infection risk, and late therapy. 12 Unfortunately, up to 39% of the patients who experience, surgery leave the operating room without a complete resection due to positive or close margins.
The manual histopathology, which is based on the conventional microscope margin assessment method, is a time-consuming and tedious process. The accurate decision of the margin diagnosis needs an experienced pathologist. Sometimes it may require the decision of two or more experts to provide a reliable pathology report, which directly affects the delay of the treatment plan and cure rate. The current procedural protocol for any skin cancer-related treatment in Ethiopia is the removal of the tumor part and waiting for a pathology report for the complete removal of cancer. The report took more than a month.12–14 A current topic of research focuses on creating computer-aided diagnostic (CAD) systems for skin lesions, intending to help dermatologists by reliably analyzing histopathology images of skin lesions for automated identification of SCC.
Related Works
To date, various image processing and machine learning techniques have been used to diagnose the SCC margin. However, the accuracy of the developed system was not sufficient most probably due to the use of few data sets only from online sources and use of Most recently, M. Halicek et al 15 proposed the studies on hyperspectral imaging (HSI) and fluorescent imaging of head and neck SCC in fresh surgical samples from 102 patients/293 tissue samples. HIS was captured using Maestro spectral imaging system. The autofluorescence images were acquired from 500 to 720 nm in 10 nm increments to produce a hypercube of 23 spectral bands using autofluorescence-imaging modality. They used a deep learning method of Inception V4 transfer learning to classify the whole tissue specimens into cancerous and normal. In this study two experiments were performed. The first experiment consisted of training the CNN on the primary tumor (T) and all normal (N) tissues while testing on T and N tissues from other patients. The second experiment consisted of training on the primary tumor (T) and all normal (N) tissues while testing only tumor-involved cancer margin (TN) tissues from other patients. HSI detected conventional SCC in the larynx, oropharynx, and nasal cavity with .85-.95 AUC score, and autofluorescence imaging detected HPV+ SCC in tonsillar tissue with .91 AUC score for different organ sites. Generally, the result shows that AUCs upwards of .80-.90 were obtained for SCC detection with HSI-based. Again another study in Ref. 16 which was written by M. Halicek et al shows the ability of HSI-based cancer margin detection for oral cancer of thyroid cancer and oral SCC. The CNN-based method classifies the tumor-normal margin of oral squamous cell carcinoma (SCC) vs normal oral tissue with an area under the curve (AUC) of .86 with 81% accuracy, 84% sensitivity, and 77% specificity. In the same study, thyroid carcinoma cancer normal margins were classified with an AUC of .94 for interpatient validation, performed with 90% accuracy, 91% sensitivity, and 88% specificity. This study compared support vector machine (SVM) with radial basis function (RBF) type kernel and CNN deep neural network model to classify SCC, and .80 and .85 AUC were achieved by the models respectively. In Ref. 7 L. Ma et al proposed, that a fully convolutional network (FCN) model based on U-Net architecture was implemented and trained for tissue classification in hyperspectral images (HIS) of 25 ex vivo SCC surgical specimens from 20 different patients. They used only patches containing the tumor-normal margin to train the model, while the patches with only tumor or only normal tissue were not used in the training process. The model was evaluated per patient and achieved pixel-level tissue classification with an average area under the curve (AUC) of .88, as well as .83 accuracy, .84 sensitivity, and .70 specificity. Kassem. M.A et al 17 proposed Skin Lesions Classification Into Eight Classes for ISIC 2019 Using Deep Convolutional Neural Network and Transfer Learning. This paper proposes a model for highly accurate classification of skin lesions. The proposed model utilized the transfer learning and pre-trained model with GoogleNet. The proposed model successfully classified the eight different classes of skin lesions, namely, melanoma, melanocytic nevus, basal cell carcinoma, actinic keratosis, benign keratosis, dermatofibroma, vascular lesion, and Squamous cell carcinoma. The achieved classification accuracy, sensitivity, specificity, and precision percentages are 94.92%, 79.8%, 97%, and 80.36%, respectively. They used online datasets to train and test their models.
L. Zhang et al 14 proposed a deep learning-based stimulated Raman scattering (SRS) microscope of laryngeal squamous cell carcinoma on fresh surgical specimens using a 34-layered residual convolutional neural network (ResNet34) to classify 33 fresh surgical samples into normal and neoplasia to diagnosis the abnormality of the samples. Even though they modeled the system with high accuracy (100%) for the classification of samples into normal and neoplasia, margin assessment was not addressed. On the other hand, Khalid M et al in Ref. 18 proposed Classification of Skin Lesions into Seven Classes Using Transfer Learning with AlexNet. The parameters of the original model are used as initial values, where they randomly initialize the weights of the last three replaced layers. The proposed method was tested using the most recent public dataset, ISIC 2018. Based on the obtained results, they could say that the proposed method achieved great success where it accurately classifies the skin lesions into seven classes. These classes are melanoma, melanocytic nevus, basal cell carcinoma, actinic keratosis, benign keratosis, dermatofibroma, and vascular lesion. The achieved percentages were 98.70%, 95.60%, 99.27%, and 95.06% for accuracy, sensitivity, specificity, and precision, respectively. In Ref. 19 B. Fei et al proposed a machine learning-based quantification method for HIS data from 16 patients, who underwent head and neck surgery used for binary classification as cancer normal tissues. They used normal and tumor tissues for training and the model were evaluated on the histopathology of tumor-normal interface from the same patients. The study classifies the normal and cancer tissues but not on the boundary of the tumor margin. They got distinguished of 90% ± 8% accuracy, 89% ± 9% sensitivity, and specificity of 91% ± 6. The above-mentioned studies used hyperspectral imaging (HSI) modalities for the peripheral margins, which has a limitation on the deep penetration of the deep margins where the most positive margin cases were reported. Starting with the primary clinical samples obtained from the Jimma Medical Center (JMC), Department of Pathology, histopathology images tainted with typical artifacts such as fringing dust, and non-collimated lighting were acquired using a locally available microscope. Our setup closely resembled a clinical microscope that is often seen in resource-poor hospital settings. The images were then preprocessed to remove the artifacts and increase the number of trained data sets. Different transfer learning and deep learning artificial intelligence-based models were applied and their classification performance was compared.
Proposed Models
The acquired microscopic histology images often contained artifacts from diverse sources that needed to be rectified using appropriate preprocessing methods. Therefore, this section explicates the details of the image acquisition and image processing techniques required for the margin classification, followed by a brief discourse on the transfer learning methods used in this work. The overall workflow/block diagram used for developing the system is outlaid in Figure 2. The general diagram of the proposed system.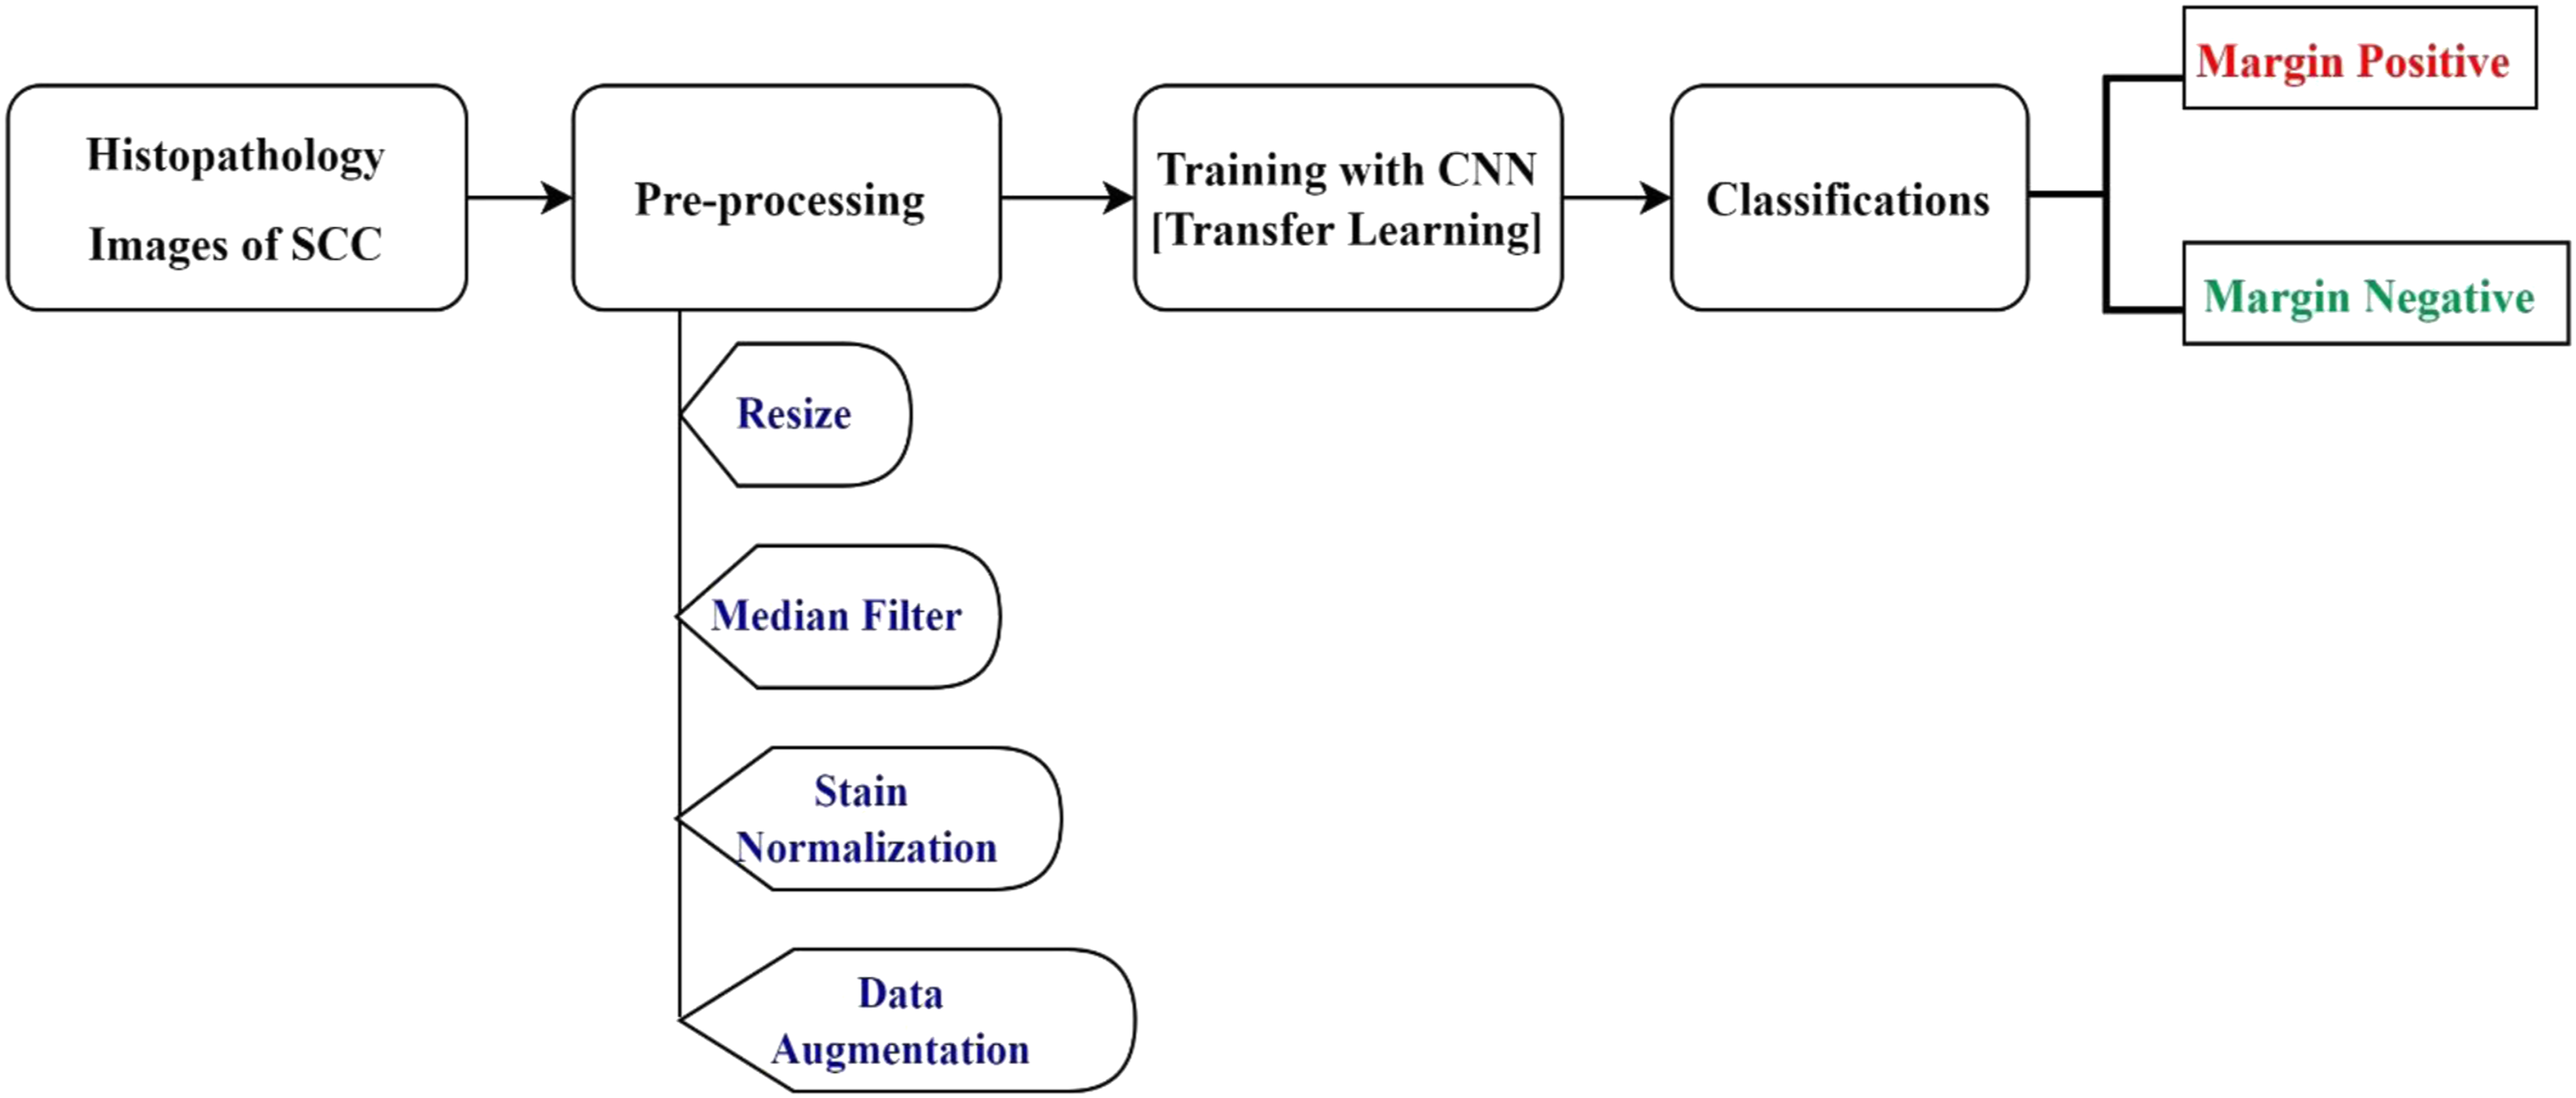
In this research, four models have been selected and trained with the locally collected SCC data sets. These models were selected due to their outperforming in related works. These were, VGG16, ResNet-50, MobileNetV2, and EfficientNetB0. A detailed explanation of each model is found in Supplementary Material 1.
Experimental Design
Data Collection/Image Acquisition
Squamous Cell Carcinoma Data Set the Information of Patients and Whole Slide Images.

Abbreviation: WSI, whole slide images.

Data acquisition procedure in Jimma University Medical Center pathology department. (a) The setup used for image acquisition, (b) Shows sample slides with SCC, (c) during the image acquisition, (d) sample acquired well-differentiated SCC histopathology image. Abbreviation: SSC, squamous cell carcinoma.
The safest margin for surgical resection of different cancer types is different based on the tumor resection margin standards of the providers.20–23 For the oral tongue, a negative margin was proposed to be 2.2 mm. Another study found cuts within 1 mm of oral cavity tumor margins are associated with significantly increased recurrence rates. Negative resection margins are the primary prevention of disease relapse of the cancer cells.16,24 For this study, based on the JUMC standard of care for skin cancer histopathology margin assessments, more than 1 mm surgical margin is considered as a margin negative, and less than 1 mm is considered as a margin positive. Taking19,22 as a reference three regions of interest were selected and images were acquired in this study: the tumor, normal, and tumor-normal interface regions.
The collected slides (see sample slides in Figure 3(b)) were from 50 patients. The number of patients distributed for each organ was: 12 patients with SCC of the legs, 8 on hands, 3 on the eyes, 14 on feet, 6 on toes, 4 on the neck, and 3 on the face. Regarding histologic grading, 17 patients with well-differentiated SCC and 15 patients with poorly differentiated SCC, 18 patients were Invasive SCC as stipulated in Table 1. Tissue samples that are entirely normal were used as Margin Negative and the sample that contains tumor-normal margins and entire tumor were used as Margin Positive category. All H&E‐stained histopathology images were labeled as margin negative and margin positive and confirmed by 2 (two) pathologists for histopathologic assessment. Finally, both pathologists and histologists validated the correct labeling of the captured slide images, which were used as our acquired data used for developing our model. In this research, a total of three 345 normal, 284 images for tumor, and 199 for a tumor-normal section of histopathology images were originally acquired (see sample acquired image in Figure 3(d)).
From Table 1 above, out of 50 patients originally 345 margin negative and 483 margin positive (the combination of pure tumor and tumor-normal section) histopathology images were acquired. Seven different skin organs and three histologic grades of SCC were used aiming to use the models for most skin parts of the body. As the research did not involve the direct use of humans, animals or other subjects, a formal ethics approval was not required for this study. This was checked and confirmation for this was received from the Jimma University’s institutional review board.
Image Preprocessing
The acquired images usually contained noise due to excessive irregularities arising from the staining procedure. On the other hand, the number of originally acquired images could be not enough to train our model. Thus, the purpose of preprocessing is to improve image quality by removing unwanted objects and noise from histopathology images and increasing the number of images by applying different image augmentation techniques.25,26 In the preprocessing step, the following methodology was adopted. 1. Resize: Deep learning models are computationally expensive and require all input images to have the same size. Therefore, to decrease the computational time,20,27 the original Red Green Blue (RGB) image (2048 × 1536) was reduced to 224 by 224 pixels (see Figure 4). 2. Image Smoothing: during image capturing of microscopic images, it could be susceptible to different noises, such as additive, random, impulsive, and multiplicative are normally associated with any image. Noise deletion is most important in medical image analysis.
28
The most frequently affected noises in the medical images are Gaussian, pepper, speckle, and Poisson noises. As compared with other filters, in this research, a median filter was used to remove the salt and pepper noise in the whole slide image. One of the major advantages of the median filter is that it strongly preserves the edges of an image
29
(see Figure 5). 3. Stain Normalization: color normalization is an important preprocessing task in the whole-slide image (WSI) of digital pathology.30,31 It refers to standardized color distribution across input images and focused on hematoxylin and eosin (H&E) stained slides. Color normalization techniques like stain normalization are an important processing task for computer-aided diagnosis (CAD) systems
32
which is achieved by normalizing the stains for enhancement and reducing the color and intensity variations present in stained images from different laboratories, consequently, increasing the estimation accuracy of CAD systems.
30
In this study, a Macenko stain normalization algorithm, which was popular in histopathology slides32–34 was used (see Figure 6). 4. Data Augmentation: It is a method used to significantly increase the amount and variety of data available for training models.28,35,36 Data augmentation was performed by rotating the images in 90°, 180°, 270°, horizontal flip, and vertical flip to increase the available data without affecting their features. As result, the number of data was increased by six times. Original and resized image. The original resized image and the median filtered image. The median filtered image and stained normalized image.


Model Training
The obtained original data was split into 80% for training, 10% for validation, and 10% for testing through a stratified cross-validation method. This means out of 828 originally acquired images, 662 were used for training, 82 for validation, and 84 for testing purposes. After augmentation of 6× (with 90°, 180°, 270°, horizontal flip, and vertical flip), the number of images in each class becomes 1656 for Margin Negative, and 2316 for Margin Positive excluding the testing data set, which needs to be the original dataset and is 84 (35 for MN and 49 for MP) images. Therefore, the training, validation, and testing data classes contain 3972, 492, and 84 images, respectively. To train the models for the SCC classification task, utilizing the concept of transfer learning,37,38 the actual classifier was replaced (1000 nodes) in each pre-trained model with a new one (sigmoid layer with 1 node) for binary classification of SCC images.
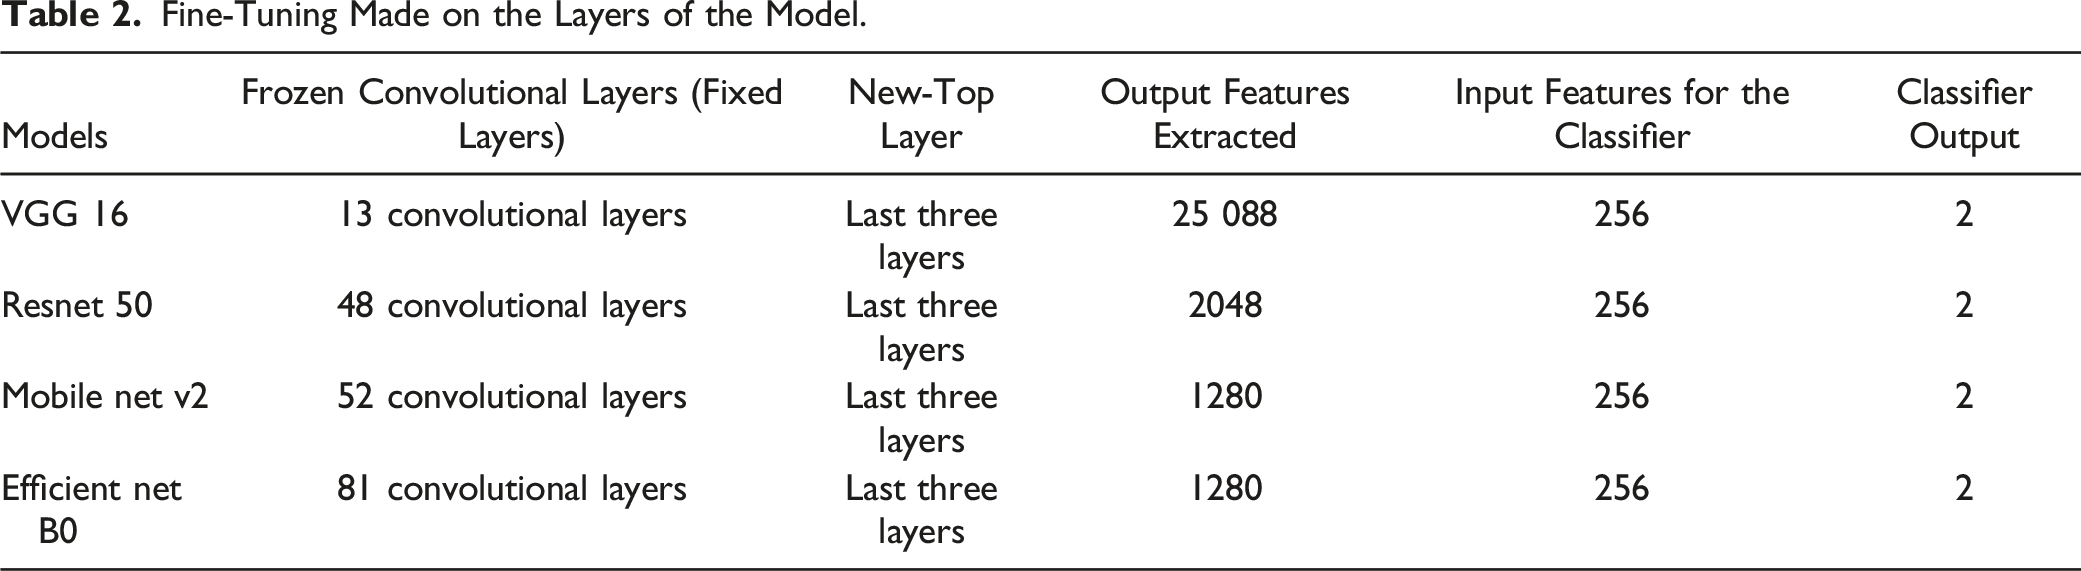
Fine-Tuning Made on the Layers of the Model.
Functions and Parameters Used for Each Model During the Training.

Taking a pre-trained deep neural network (VGG 16, Resnet 50, Mobile net v2, Efficient net B0) as a feature extractor and freezing the weights for the convolutional layers in the network. The last three layers have been replaced with a new fully-connected, sigmoid, and 2 classification output layers on top of the body of the network.
After operating on several trials and testing with different transfer learning pre-trained models, we have selected four models and compared their results. These were (1) the visual geometry group (VGG16), (2) Residual Network (ResNet50), (3) EfficientNetB0 and MobileNetV2.
The network architecture of VGG16 is a sixteen-layer deep CNN. It consists of thirteen convolution layers arranged into five blocks, each followed by a pooling operation. The network uses filters of size 3 × 3 for convolution and 2 × 2 size windows for pooling operation. The convolutional stack is followed by two fully connected layers, each consisting of 4096 nodes. The final layer is a SoftMax layer that assigns a class to each image. 37 The residual network (ResNet50): has a depth of fifty (50) layers, forty-eight (48) convolutions, one max-pooling, and one average pooling and 3 times deeper than VGG-16, having less computational complexity. 37 The residual addresses the problem of training a really deep architecture by introducing an identity skip connection, which is also called a shortcut jump over layer. 39 On the other hand, an EfficientNetB0, which is an Efficient Net family a newly developed classifier, uses a compound scaling approach with fixed ratios in all three dimensions to maximize speed and precision and shows enormous results in this study 40 and does not change the layer operation in the baseline network while scaling. Furthermore, MobileNetV2 is having bottleneck layer in the residual connections. Lightweight depth-wise convolutions are used by the intermediate expansion layer to filter features as the source of nonlinearity. MobileNetV2 is having 32 filtered initial fully connected convolutions. 39
In this research, different hyper-parameters of the model were fine-tuned to increase the performance of our developed module while it was trained with the modified models. These include choosing the right optimizer, adjusting the learning rate, and choosing the appropriate activation and loss function. The following Table 3 shows the functions and parameters used for the models during the training.
As an optimizer, the Adam optimizer was chosen for its best performance in terms of speed to converge faster and accuracy. 37 The number of epochs used was different based on the models, while the learning rate was set to .0001 and the activation function used was ReLu. The loss function for binary class classification was binary cross-entropy.
Performance Evaluation Metrics
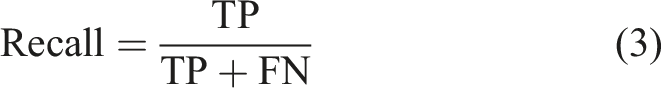
To evaluate the performance, we calculated accuracy, precision, recall, F1-score, specificity, and AUC value. These statistical metrics are based on True Positives (TP), False Negatives (FN), False Positives (FP), and True Negatives (TN). Here, TP and TN represent the number of correctly identified margin positive and margin negative images, respectively, while FP and FN denote the number of margin negative images wrongly classified or accepted as margin positive and the number of margins positive images incorrectly classified as margin negative respectively.27,37 All equations from equations (1)-(5) were taken from Ref. 41. 1. Accuracy: the accuracy scores tell how often the models produced correct results and it is calculated using equation (1) below 2. Precision: it simply shows “what number of selected data items are relevant”. In other words, out of the observations that the algorithm has predicted to be positive, how many of them are positive is calculated by precision. In other words, precision reflects a model’s consistency concerning margin positive outcomes. Precision is calculated based on the following equation (2) 3. Recall: it presents “what number of relevant data items are selected”. It indicates out of the positive observations, how many of them have been predicted by the algorithm. According to equation (3), the recall equals the number of true positives divided by the sum of true positives and false negatives: Recall calculates the ratio of correctly identified Margin Positive images to all Margin Positive images in the test data (see equation (3)). 4. Specificity: determines how much it classifies the Margin Negative images correctly (see equation (4)). 5. F1 score: The F1 score represents a weighted average of precision and recall (equation (5)). 6. ROC-AUC score: This metric is calculated using the ROC curve (receiver operating characteristic curve) which represents the relation between the true positive rate (sensitivity or recall) and false positive rate (1- specificity). Area Under ROC Curve or ROC-AUC is used for binary classification and demonstrates how good a model is in discriminating between positive and negative target classes. Especially, in our case, the importance of margin positive (reduced recurrence) and margin negative (organ conservation) classes are equal for us, ROC-AUC score can be a useful performance metric.37,42 Receiver Operating Characteristic (ROC) plots TP rate (equation (6)) vs FP rate (equation (7)) and helps us understand the relationship between correctly classified Margin Positive and misclassified Margin Negative images. The area under the curve (AUC) is a scalar value ranging between 0 and 1 and represents how well our model differentiates between Margin Negative and Margin Positive images.


An excellent model has an AUC near 1 which means it has a good measure of separability. A poor model has an AUC near 0, which means it has the worst measure of separability.
Results
Training and Validation Results
In this study, a binary classification for the Histopathology Margin of SCC was established. As per the data split ratio used, the amount of data for training the models was 1656 for Margin Negative (MN) and 2316 for Margin Positive classes (MP). Totally, 3972 images have taken as a training set and 490 for validation (204 for Margin Negative (MN) and 288 for Margin Positive (MP), and 84 for testing (34 images for Margin Negative (MN), 48 images for Margin Positive (MP)) were used.
During training, the performance of the validation group was calculated and monitored. The optimal operating threshold was calculated for the validation group for generalizable results, and it was used for generating performance evaluation metrics for the testing group. The early stop trigger would activate when validation loss did not improve for 10 consecutive epochs. In this case, the training phase would stop. Therefore, the best loss value saved and best validation loss would be achieved for the optimal operating threshold. Generally, the training process is monitored by ‘best loss ‘which quantized the error between algorithm output and a given target value, and the validation accuracy and training accuracy in this best loss would be gained. After the end of the training, the best model or best checkpoint is saved based on this the saved model is loaded and can be tested using a testing dataset that is independent of the training and validation data set. In this study, we used stratified cross-validation. So, a 10-fold cross-validation was performed, splitting all datasets into 80% for training, 10% for validation, and 10% for the testing group. To reduce bias in the experiment, the fully independent testing group was only classified a single time at the end of the experiment with 84 images, after all, network optimization had been determined using the validation set. Different models (as shown in Figure 7) were trained and tested. From those models, Four (4) models with higher accuracy and AUC were selected. VGG16, ResNet 50, Mobile Net v2, and Efficient Net B0 were the selected models. Finally, the learning and generalizability performance of the models was measured using a learning curve. Different models’ training accuracy on squamous cell carcinoma data set.
The experimental results demonstrate that the application of Efficient Net B0 to the dataset of SCC considerably improves the overall performance and thus achieves the best outcome compared to other convolutional neural networks.
The following Figure 8 shows the training and validation accuracy for the four (4) selected models (VGG16, ResNet 50, Mobile Net v2, and Efficient Net B0). Training and validation accuracy for (a) VGG16, (b) ResNet 50, (c) Mobile Net v2, (d) Efficient Net B0.
The Models Have Saved the Best Weight Values Acquired at the nth Epoch.

Testing Results
The performance of the models was tested on 84 images; with 35 margins negative and 49 margins positive, respectively, obtained from the originally collected data. The confusion matrix in Figure 9 shows the performance of each model on the test data. The normalized confusion matrix for the (a) VGG16, (b) ResNet 50, (c) Mobile Net v2, (d) Efficient Net B0 models.
Models |Testing Performance Results Summary.

As depicted in Table 4 above, among the four (4) models used, the EffecientNetB0 model achieved the best performance.
On the other hand, the performance of the model can be evaluated using receiver operator characteristic (ROC) Curves, which are a useful tool to predict the probability of binary outcomes and describe how well the model is at distinguishing the classes. The Area Under the Curve (AUC) is a measure of the ability of a classifier to distinguish between Margin Negative and Margin Positive and is used as a summary of the ROC curves. Figure 10 illustrates the ROC curve generated using SCC histopathology images for histopathology margin classification with average values of AUC, 90.5%,94%,95%,100% for VGG16, ResNet 50, Mobile Net v2, Efficient Net B0, respectively. Receiver operating characteristic curve and area under the curve value for (a) VGG16, (b) ResNet 50, (c) Mobile Net v2, (d) Efficient Net B0 models.
As indicated in Figure 10 above, for all models used in this research, EfficientNetB0 outperforms with the highest AUC and the best performance of the model in distinguishing the margin positive and margin negative classes with 100%.
Discussion
This work focuses on a deep learning-based SCC diagnosis system. The developed system shows the promising result of replacing the currently existing manual diagnosis methods with an automated system. Skin cancer SCC can be diagnosed by clinical examination, including visualization, 6 optical imaging technique, and histopathology (biopsy) tests. Among these, the histopathology test is the gold standard and the most common technique used to identify cancer types and classify the grade, and margin status of the tumor margin in low resource settings. 9 The most preferable treatment for SCC is the surgical removal of the entire tumor tissue, followed by margin assessments 10 which can help the surgeon repeatedly operate the margin removal process until margin free report is gained and proceed to the next step for reconstruction surgery, which is depending on pathologist margin status reports. Unfortunately, there is a shortage of pathologists in most developing countries and health care providers, including Ethiopia. The complexity of margin assessments and their subjective decision, which depends on the expert’s experience, leads to misdiagnosis and local recurrence of the cancer cells.
The major aim of this study was to classify SCC histopathological images as Margin Negative and Margin Positive to classify the histopathological surgical margin. To achieve this, four different models were developed. The best result was achieved by fine-tuning the pre-trained model of EfficientNetB0.
As shown in the testing result confusion matrix in Figure 9, ReseNet50 classifies the margin positive 98% with the best results, and Efficient Net B0 equally classifies the margin positive as that of ResNet50. VGG16 is about 92% for margin negative, ReseNet50 classified worthily, which is 76%. However, the margin negative data is 100% classified by both MobileNetV2 and Efficient Net B0 models. As shown in Table 4, the best overall training and validation accuracy achieved by Efficient Net B0 was 95.3% and 94.7% respectively, which is on averagely greater than the other models used in this work. Moreover, as depicted in Table 5 the overall testing performance of the system achieved by Efficient Net B0 were95% (at 22 epoch) accuracy, 95% precision, 96% recall, 95% F1 score, 96% specificity, and 100% AUC. This result shows the EfficientNetB0 model outperformed the other models in classifying the SCC.
In this work, a histopathological dataset of SCC and implement a state-of-the-art EffecientNetB0 CNN architecture for margin classification with the best results. To the best of the authors' knowledge, this is the first work to investigate SCC margin classification of skin cancer disease in digitized whole-slide histological images for seven different skin parts and on the three histologic grades of SCC and with such much-improved accuracy. This is the first attempt to design and develop a deep learning computer-aided diagnosis of SCC margin classification system using whole slide images using locally acquired data sets. We can conclude that the developed system can classify the whole slide of SCC histopathology images with good classification accuracy. Moreover, the developed model has overcome the gap in margin classification of histopathology images in margin-free results during skin cancer surgical treatment of SCC.
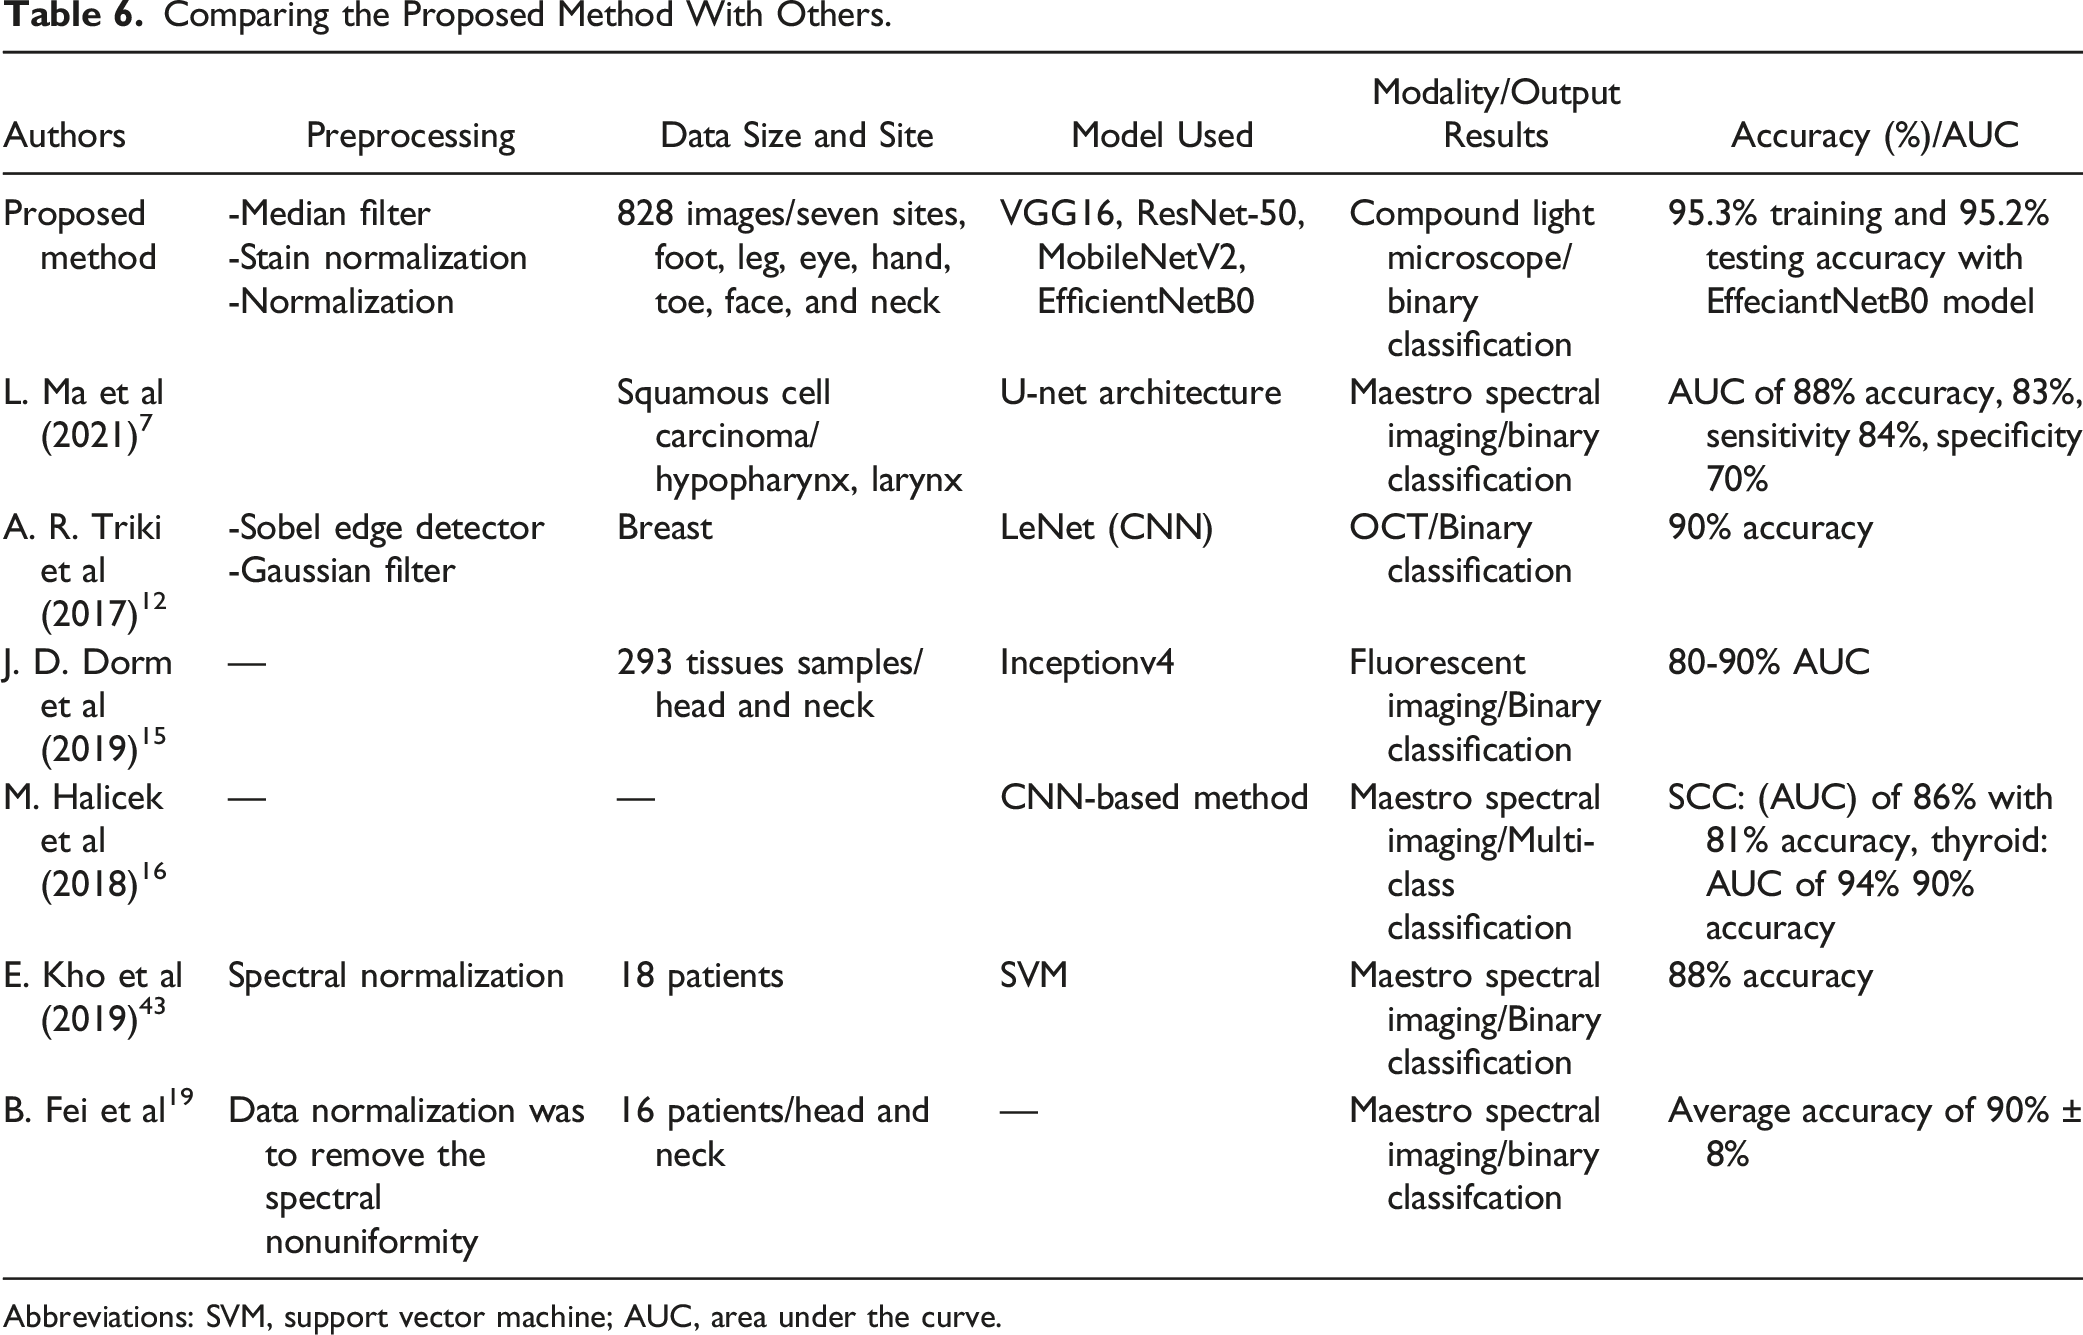
Comparing the Proposed Method With Others.
Abbreviations: SVM, support vector machine; AUC, area under the curve.
Nevertheless, this study focuses only on the SCC type of skin cancer margin classification and was limited due to financial and time constraints to acquire more datasets to study for other types of cancer cells. Moreover, the current module not able to grade the SCC levels other than classification of the tumor.
Algorithm Demonstration
The developed graphical user interface (GUI) using EffecientNetB0 (with the highest testing accuracy model ∼95.2%) was tested with respect to response time and ease of use. It is found to be easy to use and convenient for users. Once initialized, the result can be achieved within less than 10 seconds. As shown in Figure 11, the GUI has a button to load an image and preprocess it and display/classify the diagnosing result. Moreover, the result obtained can be saved using the “save” button, and possible to continue analyzing more images while the “clear” button is used. The developed graphical user interface.
Conclusions
The existing manual histopathology margin assessment for the SCC method requires experienced experts, and it is time-consuming, tedious, and depends on the knowledge and experience of the pathologist, which may sometimes require two or more experts to provide a reliable pathology report, which directly affects the treatment plan and cure rate. In this research, we used whole slide images of clinical data collected from Jimma University Medical Center, Pathology Department and trained, validate, and test different selected models by fine-tuning the hyperparameter of four different models, and got significant accuracy. The novel module of our dataset and the promising results of this work demonstrates the potential of such methods that could help to create a tool to increase the efficiency and accuracy of pathologists performing margin assessment on histological slides for the guidance of skin cancer resection operations, especially in low resource settings. The developed system provides the margin classification result within a minute, which shows much improvement from 20 to 30 minutes manual diagnosing methods. For the future, concatenating models of ResNet 50 which had more advantage on margin positive, which benefit the patients with reduction of recurrence rate of cancer cells, and Efficient Net B0 which had more advantage on margin negative guaranty organ preservation and increases the module performance.
Supplemental Material
Supplemental Material - Squamous Cell Carcinoma of Skin Cancer Margin Classification From Digital Histopathology Images Using Deep Learning
Supplementary Material for Squamous Cell Carcinoma of Skin Cancer Margin Classification From Digital Histopathology Images Using Deep Learning by Beshatu D. Wako, Kokeb Dese, Roba E. Ulfata, Tilahun A. Nigatu, Solomon K. Turunbedu, and Timothy Kwa in Cancer Control.
Footnotes
Acknowledgments
We would like to thank the Jimma Institute of Technology, School of Biomedical Engineering for the research funding support and all collaborators from Jimma University Medical Center.
Author Contributions
BDW, KD: Conceptualization, Methodology, Software, Formal analysis, Validation, Writing - original draft, and Data curation. KD, TK: Supervision, Methodology, Writing - original draft, Visualization, Software, Writing - review & editing. BDW, RE, TA, and SK: Data acquisition, data labeling, and analysis. All authors read and approved the final manuscript.
Declaration of Conflicting Interests
The author(s) declared no potential conflicts of interest with respect to the research, authorship, and/or publication of this article.
Funding
The author(s) disclosed receipt of the following financial support for the research, authorship, and/or publication of this article: This work was supported by Jimma University (JU/2011), Jimma Institute of Technology, School of Biomedical Engineering.
Ethical Approval
This research did not involve direct humans, animals, or other subjects. According to Jimma University’s institutional review board (IRB), we had checked that no formal ethical approval was required in this particular case.
Data Availability
The datasets used and/or analyzed during the current study are available from the corresponding authors on reasonable request.
Guarantor
Jimma University
Supplemental Material
Supplemental material for this article is available online.
Appendix
References
Supplementary Material
Please find the following supplemental material available below.
For Open Access articles published under a Creative Commons License, all supplemental material carries the same license as the article it is associated with.
For non-Open Access articles published, all supplemental material carries a non-exclusive license, and permission requests for re-use of supplemental material or any part of supplemental material shall be sent directly to the copyright owner as specified in the copyright notice associated with the article.