
Abstract
Purpose
We aimed to identify the differently expressed genes or related pathways associated with good responses to anti-HER2 therapy and to suggest a model for predicting drug response in neoadjuvant systemic therapy with trastuzumab in HER2-positive breast cancer patients.
Methods
This study was retrospectively analyzed from consecutively collected patient data. We recruited 64 women with breast cancer and categorized them into 3 groups: complete response (CR), partial response (PR), and drug resistance (DR). The final number of patients in the study was 20. RNA from 20 core needle biopsy paraffin-embedded tissues and 4 cultured cell lines (SKBR3 and BT474 breast cancer parent cells and cultured resistant cells) was extracted, reverse transcribed, and subjected to GeneChip array analysis. The obtained data were analyzed using Gene Ontology, Kyoto Gene and Genome Encyclopedia, Database for Annotation, Visualization and Integrated Discovery.
Results
In total, 6,656 genes differentially expressed between trastuzumab-susceptible and trastuzumab-resistant cell lines were identified. Among these, 3,224 were upregulated and 3,432 were downregulated. Expression changes in 34 genes in several pathways were found to be related to the response to trastuzumab-containing treatment in HER2-type breast cancer, interfering with adhesion to other cells or tissues (focal adhesion) and regulating extracellular matrix interactions and phagosome action. Thus, decreased tumor invasiveness and enhanced drug effects might be the mechanisms explaining the better drug response in the CR group.
Conclusions
This multigene assay-based study provides insights into breast cancer signaling and possible predictions of therapeutic response to targeted therapies such as trastuzumab.
Introduction
Breast cancer is one of the most common malignancies among women worldwide and is considered a heterogeneous disease. As determined by immunohistochemistry (IHC), it is categorized into several subtypes according to receptor status, and different treatments are administered for the different subtypes. Overexpression of human epithelial growth factor receptor 2 (HER2) occurs in 25-30% of all breast cancers and is associated with poor prognosis. 1 HER2 activation occurs by dimerization with other proteins in the family, and multiple downstream pathways are required for abnormal proliferation of cancer cells. 2
Trastuzumab is a recombinant humanized monoclonal antibody against the extracellular domain of the HER2 protein. 3 Trastuzumab binds to HER2 and decreases the activity of downstream signaling pathways, including the phosphatidylinositol 3-kinase (PI3K) and mitogen-activated protein kinase (MAPK) cascades, leading to increased p27Kip1 levels and promoting cell cycle arrest and apoptosis. 4 In patients with early stage operable and metastatic HER2-positive breast cancer, trastuzumab has well-established survival benefits when included in the chemotherapy regimen.
Pathologic complete response (pCR) is defined as the absence of residual invasive carcinoma in the breast and surrounding lymph nodes in surgical specimens after neoadjuvant therapy. In the neoadjuvant setting, compared without trastuzumab, chemotherapy with trastuzumab significantly improves pCR rates and reduces the risks of relapse, disease progression, and death.
5
pCR is considered an important prognostic factor and is related with long-term survival. Therefore, pCR was adopted as the primary end point for neoadjuvant trials, reaching up to 78% in patients treated with trastuzumab.6,7
The aim of this study was to identify differently expressed genes or related pathways associated with good responses to anti-HER2 therapy and to suggest a model for predicting drug response in neoadjuvant systemic therapy with trastuzumab in HER2-positive breast cancer patients.
Materials and Methods
Patients
This study was retrospectively analyzed from consecutively collected patient data. The written informed consents were obtained for the use of the tissue specimens for research purposes, as approved by the Institutional Review Board (IRB) of the National Cancer Center (Goyang, Gyeonggi-do, Korea) (NCC2015-0025). This study was conducted in one center. This study was a retrospective analysis based on patient information for which data were consecutively collected. Inclusion criteria were as follows: locally advanced breast cancer without distant metastasis, HER2-positive status on IHC or silver-enhanced in situ hybridization, or prior surgical resection with neoadjuvant anti-HER2 therapy with chemotherapy (regimen: adriamycin and cyclophosphamide for 4 cycles, followed by taxane and trastuzumab for 4 cycles). We excluded the patients who had undergone chemotherapy previously or had a history of radiotherapy, of previous malignancy of another organ, or of discontinuing treatment due to any reason. We identified 64 consecutive women satisfying the inclusion criteria at our institution between July 2005 and January 2014. All patient data were provided by the Biologics Bank, and the patient’s identity is securely anonymized, so researchers cannot identify individuals.
These patients were categorized into groups according to drug response as per the RECIST criteria (version 1.1): complete response (CR), partial response (PR), stable disease (SD), and progressive disease (PD). However, only 3 patients with SD and 1 with PD were detected; hence, owing to the small number, they were categorized into a drug resistance (DR) group. Finally, the patients were classified into 3 groups. The CR, PR, and DR groups included 25 (39.1%), 35 (54.6%), and 4 (6.3%) cases, respectively. Among these, 20 patients were finally enrolled (11 CR patients and 9 PR patients), from whom core needle biopsy (CNB) tissues obtained at the initial diagnosis were available as paraffin-embedded blocks. An outline of the patient selection process is given in Figure 1. Patients selection flow for study
We collected patients’ clinicopathological information, such as patient and tumor characteristics, surgical methods, adjuvant therapy, and response to treatment by reviewing our institution database.
Study Design
In the above patient pool, we performed experiments using pre-chemotherapy paraffin-embedded CNB specimens. Of the available 20 initial paraffin-embedded CNB specimens, 11 belonged to the CR group and 9 to the PR group. Unfortunately, the DR group could not be tested because not all the patients underwent biopsy at our institution. For validation, in vitro experiments were conducted similarly. Trastuzumab-susceptible cell lines and trastuzumab-resistant cell lines were used in the study.
Experimental Methods
Cell lines, Reagents, and Cell Culture
Parental and resistant cell lines of SKBR3 and BT474 from the American Type Culture Collection (ATCC, Manassas, VA, USA) and the German Collection of Microorganisms and Cell Cultures (DSMZ, Braunschweig, Germany) were donated by Dr Park, Professor of the Department of Medical Oncology, Korea University.
SKBR3 and BT474 epithelial breast cancer cells were cultured in the presence of 50 μg trastuzumab (Roche, Basel, Switzerland) for approximately 3 years to develop resistant cells. Parental cells were cultured in parallel with resistant cells without the addition of trastuzumab. Resistance was confirmed by cell viability assay. Trastuzumab significantly reduced the growth of wild-type parental cells compared to trastuzumab-resistant cells. 9 SKBR3 cells were grown in Roswell Park Memorial Institute medium 1640 medium (Sigma-Aldrich, St. Louis, MO, USA), and BT474 cells were grown in Dulbecco’s modified Eagle’s medium (Hyclone, Logan, UT, USA) with 10% fetal bovine serum (Hyclone) at 37°C in 5% CO2. 10
RNA Extraction and cDNA Synthesis
RNA extraction was performed using the mirVanaTM isolation kit (Ambion®, Thermo Fisher Scientific, Massachusetts, USA) on each sample (20 CNB paraffin-embedded tissues and 4 cultured cell lines). cDNA synthesis was performed by reverse transcription from extracted RNA as follows. First, 2 μL random primer or oligo dT was added to 10 μL extracted RNA, heated at 70°C for 10 min, and cooled for 5 min at 45°C. Then, 8 μL of the mix solution (4 μL 5× buffer, 1 μL
GeneChip Microarray
The DNA microarray approach, in which specific gene sequences are spotted on a glass plate, is a useful approach for large-scale expression analyses. Briefly, extracted RNA is reverse transcribed to obtain cDNA, labeled with different fluorescent materials for each sample, and spotted. It is a technique used to determine the degree of expression of each gene by measuring the intensity of emitted light by analyzing the amount of cDNA bound to each spot by injecting a laser with an optical scanner.
The Affymetrix (Santa Clara, CA, USA) whole-transcript (WT) expression array process was executed according to the manufacturer’s protocol (GeneChip Whole Transcript PLUS reagent kit). cDNA was synthesized using the GeneChip WT amplification kit as described by the manufacturer. The sense cDNA was then fragmented and biotin-labeled with terminal deoxynucleotidyl transferase using the GeneChip WT terminal labeling kit. Approximately 5.5 μg labeled DNA target was hybridized to the Affymetrix GeneChip® Human 2.0 ST array at 45°C for 16 h. Hybridized arrays were washed and stained on a GeneChip Fluidics Station 450 and scanned on a GCS3000 Scanner (Affymetrix). The results of the microarray analysis was confirmed by using RT-qPCR for a few differentially expressed genes used afterwards for the informatic analyses.
Data Analysis
Various analysis tools were used owing to the extensive amount of GeneChip data. Analyses of biological networks are essential to study functional genomic data. Raw data were extracted using the software provided by Agilent Feature Extraction Software(v11.0.1.1). The raw data for same gene was then summarized automatically in Agilent feature extraction protocol to generate raw data text file, providing expression data for each gene probed on the array. Statistical significance of the expression data was determined using fold change and independent T-test in which the null hypothesis was that no difference exists among 2 groups.
A series of analysis steps were repeated with and without differentially expressed genes (DEGs) to determine the false positive rate. Gene enrichment and functional annotation analysis for a significant probe list was performed using Gene Ontology (GO) and the Kyoto encyclopedia of genes and genomes (KEGG). All data analysis and visualization in DEGs was performed using the R project for statistical computing (version 3.1.2). Functional annotation tool (the database for annotation, visualization, and integrated discovery (DAVID)) can organize and condense large gene lists into biologically meaningful modules. It changes functional annotation analysis from term- or gene-centric to biological module-centric 11 It was used to confirm the expression level, fold change, and P-value of each gene. Significant genes identified in the microarray were also analyzed by DAVID for functional annotation, and results were visualized by constructing a Venn diagram. The differences were considered significant when the P-value was less than .05.
Results
Patient Demographics
Clinicopathological Status of the Enrolled Patients.

CR: complete response; PR: partial response, IHC: immunohistochemistry; SISH: silver in situ hybridization for HER2 gene expression, AC: adriamycin + cyclophosphamide; TH: taxane + Herceptin (trastuzumab), BCS: breast-conserving surgery; TM: total mastectomy DCIS: ductal carcinoma in situ.
GeneChip Microarray Quality Control and Analysis Results
For comparison of the two groups with different responses to the same therapy, the first experiment was performed with the tumor tissue of patients, and the second experiment was performed using cell lines with different treatment responses to trastuzumab for validation.
In our first experiment, the hierarchical clustering, heatmap, and data control were well-distributed. Both the multidimensional scaling plots were well implemented, and correlation was normal (Supplementary Figure 1) To determine differences in gene expression in the CR and PR groups in more detail, we performed additional analyses, dividing the CR group into 2 subgroups—no residual tumor and remnant ductal carcinoma in situ (DCIS)—according to the final pathological report.
Identification of DEGs
With a fold change of 1.5, 1,473 genes that were differentially expressed between the CR and PR groups were identified. Among these, 481 were upregulated and 992 were downregulated. In addition, 171 DEGs were identified between the CR and PR groups with a fold change of 2.0. Among them, commonly upregulated or down regulated DEGs were selected, 38 were upregulated and 133 were downregulated. More genes were identified upon comparing the PR group and CR subgroups (no residual tumor and remnant DCIS subgroups). A total of 915 significant probes were noted after comparing CR and PR groups, 2,175 after comparing the PR group and the no residual tumor subgroup, and 278 after comparing the PR group and the remnant DCIS subgroup. These data are presented in Figure 2(A). Differentially expressed genes (DEGs) in comparison of different treatment response groups (a) and comparison of different cell line experiments (b)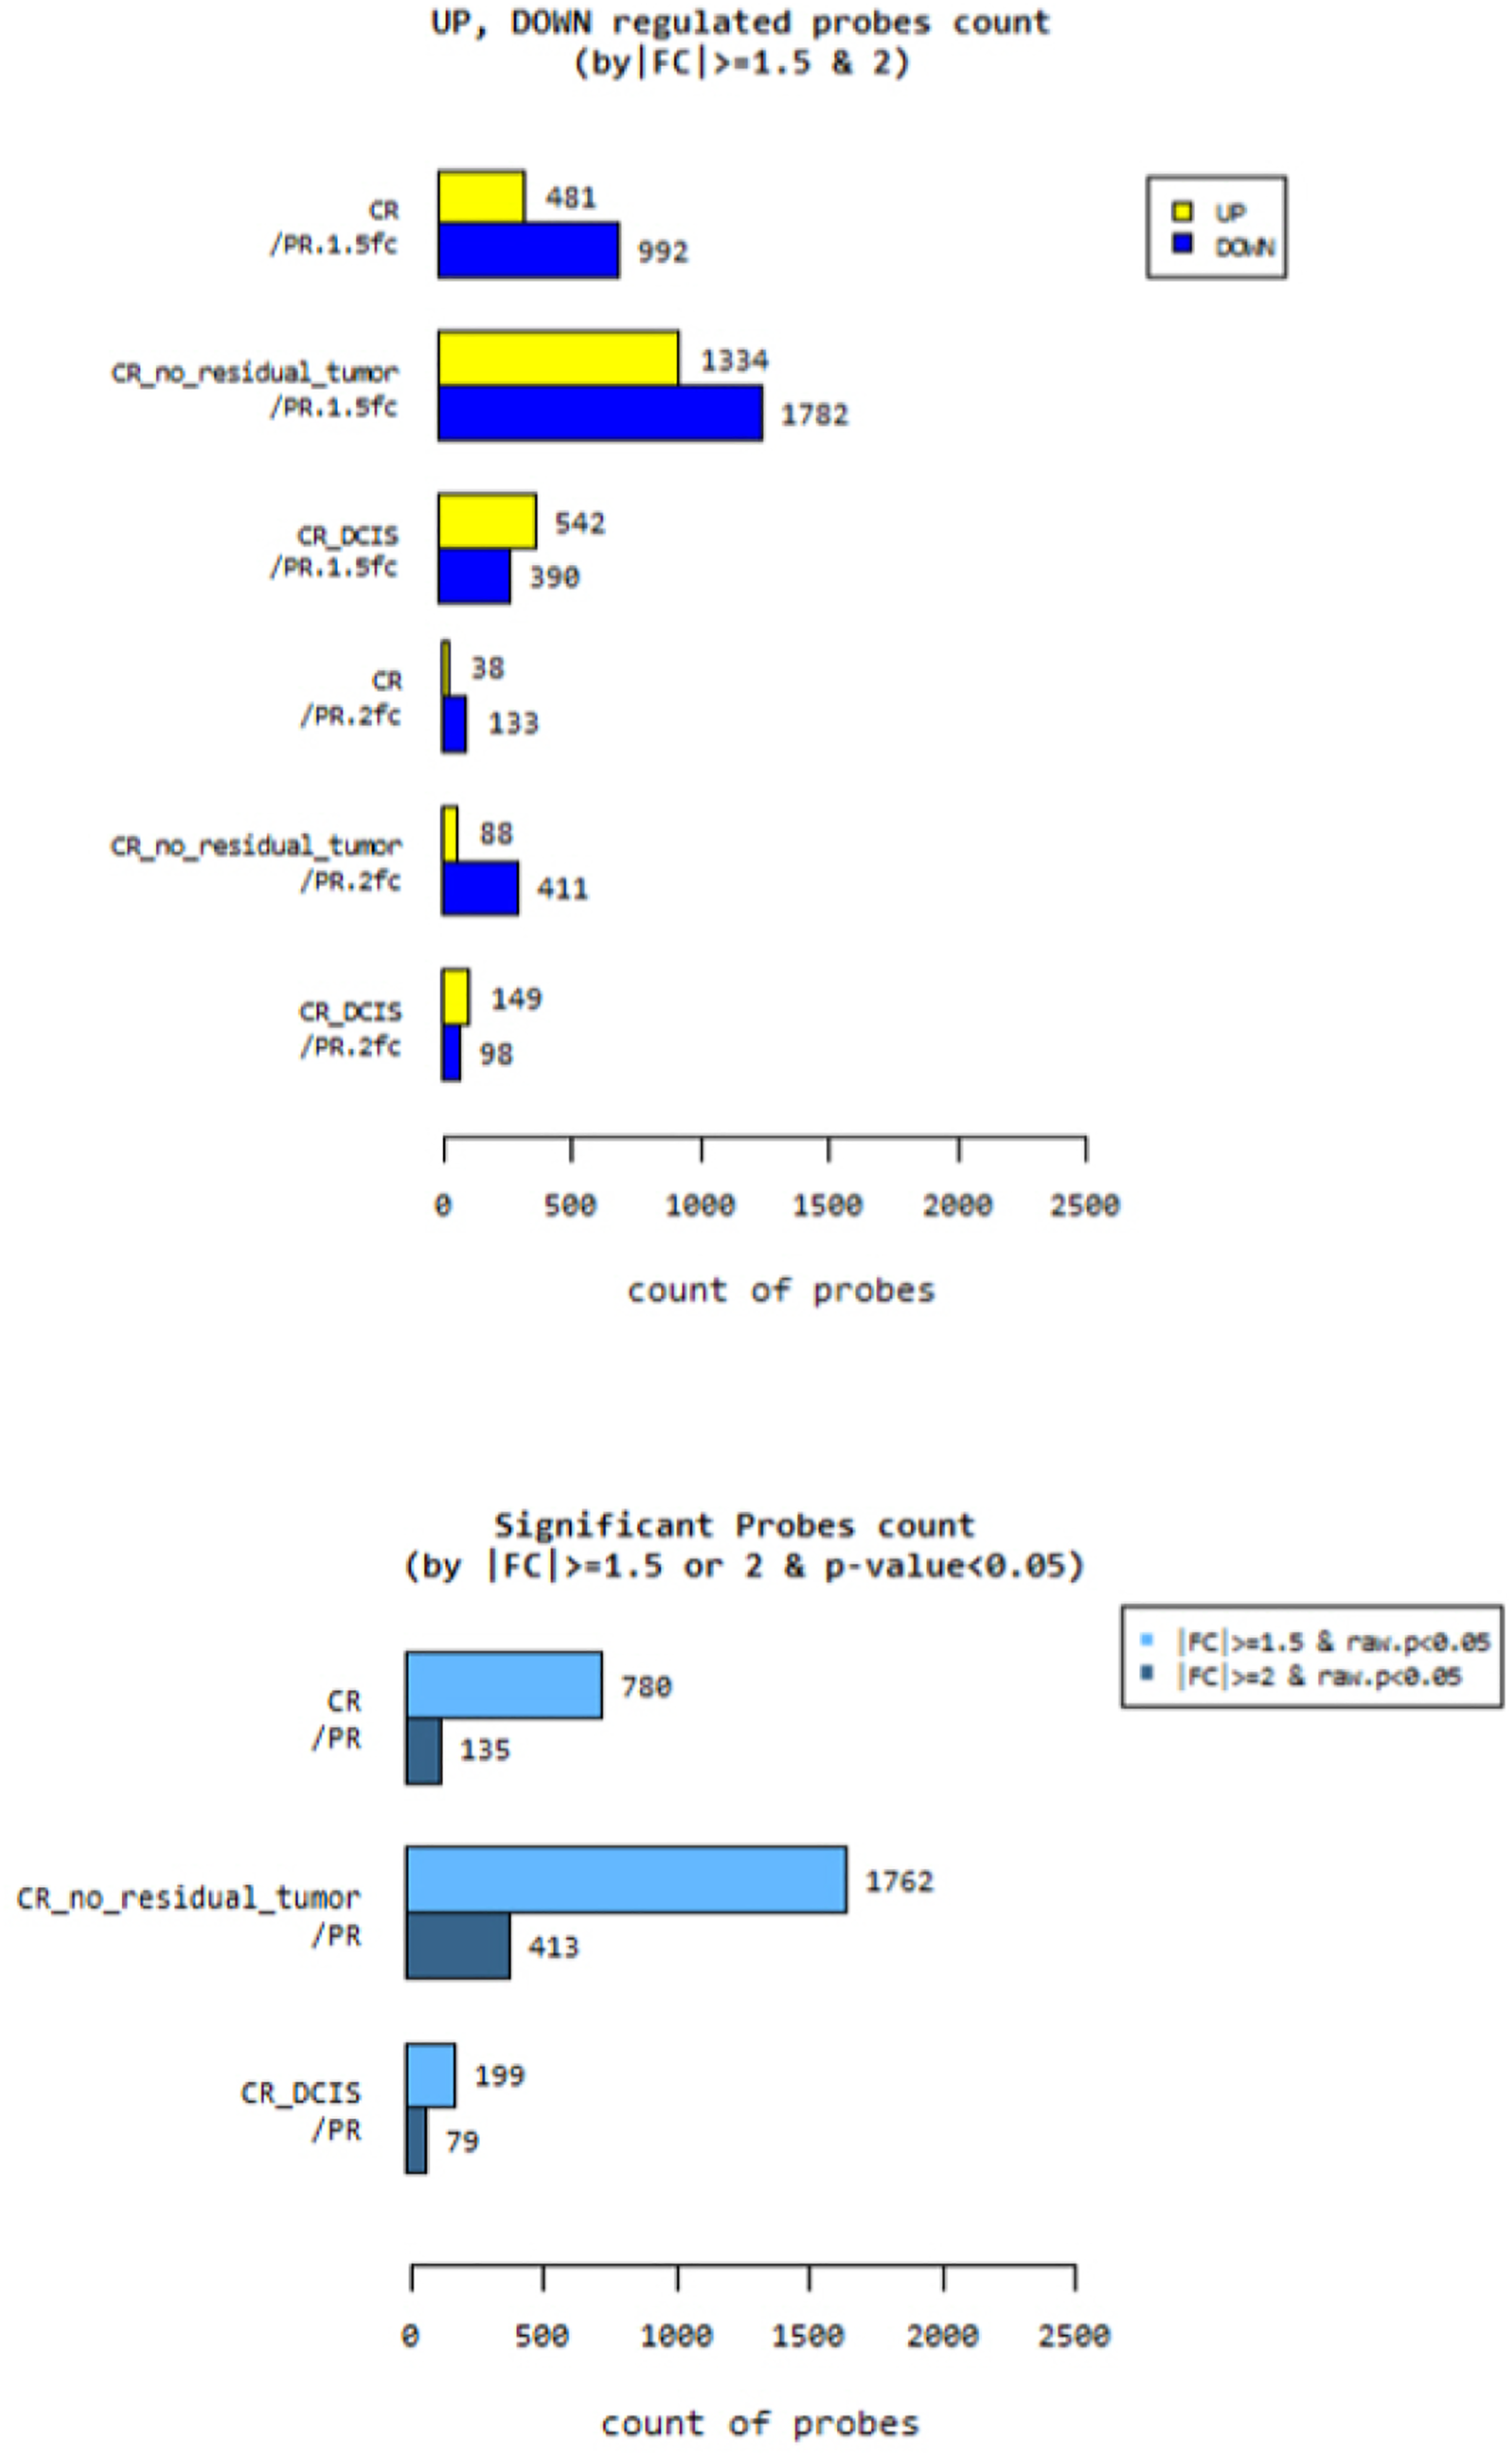
Functional GO Analysis of DEGs
To understand the relevance of these genes, programs based on GO categories of biological processes, cellular components, and molecular functions were used. Figure 3(A) and (B) shows the main functional GO categories of transcripts differentially expressed between the CR and PR groups (adjusted P < .05; gene count >2 of the up- or downregulated genes). In the “biological process” category, altered transcription of gene includes a multitude of genes that act as signaling molecules or receptors. In the “cellular component” category, genes included all parts of cell structures, and in the “molecular function” category, it included genes mainly related to binding to various molecules. Gene ontology (GO) categories in differentially expressed genes of treatment response groups(a&b) and comparison of different cell line experiments (c&d)
In Vitro Validation Experiments
A total of 6,656 genes differentially expressed between trastuzumab-susceptible and trastuzumab-resistant cell lines were identified. Among these, 3,224 were upregulated and 3,432 were downregulated. A total of 4,281 significant probes were noted between trastuzumab-susceptible and trastuzumab-resistant groups with a fold change of 1.5, and 2,707 probes with a fold change of 2.0 (Figure 2(B)).
GO categories in the DEGs of the second experiment showed a trend similar to that in the first experiment. In the “biological process” category, genes were mainly related to the regulation of cellular processes. Altered transcription of genes in the “cellular component” category included a multitude of genes serving as cell structures. In the “molecular function” category, observed results most similar to those of the tumor experiment,For example, the genes were mainly related to binding and catalytic activity (Figure 3(C) and 3(D)).
Comparison With Cell Lines for Validation
The genes related to functional annotation were analyzed using DAVID and visualized by a Venn diagram. A total of 34 genes were selected as the trastuzumab treatment response-related genes from the common up- and downregulated ones with various comparisons in the analysis (Figure 4). Venn diagram for up and down regulated genes in comparisons of treatment response group and cell lines (Genes are listed in Table 2.)
List of Upregulated and Downregulated Genes by Comparing Treatment Response Groups and Cell Lines.

Pathway analysis was performed on the 34 genes that showed different responses to trastuzumab treatment. Most of the genes were strongly correlated with 3 pathways: related to focal adhesion, extracellular matrix (ECM)–receptor interaction, and the phagosome. These pathways are linked to the PI3k pathway or MAP kinase pathway in that they have been proved to be associated with HER family pathways. Supplementary figure 2 shows these pathways in a pattern diagram. Each related gene is marked with red stars.
Discussion
We found that expression changes in 34 genes in several pathways were related to the response to trastuzumab-containing treatment in HER2-type breast cancer, interfered with adhesion to other cells or tissues (focal adhesion), and regulated ECM–receptor interactions and phagosome action. As a result, the decreased tumor invasiveness and enhanced drug effects might be considered as a potential mechanism for better drug response in the CR group. Of note, functional pathway analysis showed that these pathways affect the HER2 response by interacting with the PI3K pathway and the MAP kinase pathway. As previously reported by Toomey et al and other investigators, high activation of the PI3K pathway is associated with poor response to anti-HER2 therapy in HER2-positive breast cancer patients. 12
Neoadjuvant chemotherapy (NAC) is used in the context of locally advanced breast cancer to lower the staging of the tumor, improve operability, and increase the chances of breast-conserving surgery.13,14 Patients receiving NAC share equivalent disease progression and overall survival as patients receiving postoperative chemotherapy alone. 15 Currently, Trastuzumab is a HER2-targeted therapy approved by the United States Food and Drug Administration for HER2-positive breast cancer in neoadjuvant, adjuvant, and metastatic settings. Since 2013, Korean health insurance coverage for trastuzumab has expanded to the neoadjuvant setting; hence, the number of patients who can undergo this treatment has increased. Neoadjuvant therapy is administered before surgery, and it is important to predict the treatment response.
Achieving pCR with neoadjuvant anti-HER2 targeted chemotherapy is a crude surrogate for long-term survival of patients with HER2-positive breast cancer. Hou et al demonstrated that HER2 intratumoral heterogeneity is associated with an incomplete response to anti-HER2 neoadjuvant chemotherapy.
16
Our study suggested that genes that are unique to HER2 and related to this HER2 intratumoral heterogeneity are associated with the functional pathways for cell signaling, such as the cell cycle and cell structure. Nahta et al reported that cell signaling pathways were related to a mechanism underlying resistance to HER2-targeted therapy in human breast cancer.
4
This can be inferred from the fact that tumor cells continue to undergo mitosis, and that there is a greater chance of resistance to trastuzumab during this process. With this strategy, our sub-pathway identification approach is highly effective for discovering accurate pathological biomarkers and pathways. The pathways related to the cell cycle or cell activity are strongly associated with drug response. Rios-Luci et al performed mRNA microarrays using HER2-resistant cell lines and conducted differential gene expression and pathway analysis to identify mechanisms underlying intrinsic and acquired resistance to T-DM1.
17
The lack of the DR group in this experiment could be considered a limitation of the present study. Tissues from SD or PD groups could have helped predict more diverse responses. Furthermore, the inability to control the hormone receptor status in the tumor tissue could be a confounding factor. However, the treatment response was judged immediately after NAC of the surgical tissue with trastuzumab, which was applied to all patients with the same chemotherapy regimen; hence, this was not a drawback of the study.
The second limitation was the relatively low number of enrolled subjects, although the patients had been treated for 10 years. Of all the patients with HER2-positive breast cancer, only 25-30% underwent neoadjuvant systemic therapy with trastuzumab before surgery. 18 Some patients refused to give their tumor tissue samples for research purposes. Some patients were referred to our institution with preoperative biopsy results from other hospitals and received cancer treatment without re-biopsy. Therefore, it was difficult to obtain a sufficient number of fresh frozen surgical tissues and paraffin-embedded preoperative biopsy tissues, and the final number of tissues that could be used in the experiments was small.
To overcome these drawbacks, we designed additional experiments for validation using trastuzumab-susceptible and trastuzumab-resistant cell lines. We have already used a similar validation method in the analysis of metastatic HER2-positive breast cancers in an earlier study, 19 which successfully proved its validity. Therefore, it could be effective in yielding favorable results in this experiment.
At the beginning of this study, we chose to use the GeneChip microarray and big data analysis as the study method, expecting to obtain accurate results by these popular research tools. This technology is effective for identifying global changes in cancer incidence and development. The application of gene expression profiling is an excellent approach to integrate multiple molecular phenomena and mechanisms underlying cancer development. Tumorigenesis is accompanied by the destruction of various cell pathways, including the cell cycle and cell growth, survival, and apoptosis. Gene expression microarrays provide detailed explanations of molecular fingerprinting of tumors by simultaneously analyzing thousands of genes in specific tumors. While several studies using these methods have been published,20–22 more rapid technological progress has continued.
And finally, a major weakness of our study is that the standard of care in the neoadjuvant setting for HER2-positive patients today includes Trastuzumab and Pertuzumab. Since the use of pertuzumab has not been universalized at the stage of starting the experiment, we will plan additional experiments on it and reflect it in future research and report it.
Although our study did not suggest a specific gene as a biomarker immediately applicable to clinical practice, we could reveal some potential genes and pathways that should be studied more extensively. Studies to identify practical prognostic markers for trastuzumab treatment response are essential.
In future studies, quantitative RNAseq experiments might assess the difference in gene expression among different samples more accurately. Ultimately, by balancing the estimated risks and benefits, a personalized approach can be achieved on the basis of an algorithmic approach.
Conclusion
In our study, 34 genes that are mainly expressed in the several cell signaling pathways closely linked to the HER2 expression pathway were found to be related to the drug response to anti-HER2 therapy by regulating the cell cycle. This multigene assay-based study of relevant pathways and identified genes might serve as a cornerstone for greater insight into breast cancer signaling and the possible prediction of therapeutic response to targeted therapies such as trastuzumab.
Supplemental Material
Supplemental Material - Determining the Factors Predicting the Response to Anti-HER2 Therapy in HER2-Positive Breast Cancer Patients
Supplemental Material for Determining the Factors Predicting the Response to Anti-HER2 Therapy in HER2-Positive Breast Cancer Patients by Ji Young You MD, Kyoung Hwa Park MD, Eun Sook Lee MD, Youngmee Kwon MD, Kyoung Tae Kim PhD, Seungyoon Nam PhD, Dong Hee Kim MD, Jeoung Won Bae MD in Cancer Control
Footnotes
Author Contributions
You, Lee, DH Kim and Bae conceived and designed the study. You, Park and KT Kim wrote the paper; Nam and You designed the figures; Nam, Kwon and You summarised the data, analysed the data and created the tables; Lee, KT Kim and Bae reviewed and edited the manuscript. All authors read, critically reviewed and approved the final manuscript.
Declaration of Conflicting Interests
The author(s) declared no potential conflicts of interest with respect to the research, authorship, and/or publication of this article.
Funding
This research was supported by the Eulji Medi-Bio Research Institute Grant 2016-SN0002.
Institutional Review Board Statement
The study was conducted according to the guidelines of the Declaration of Helsinki, and approved by the Institutional Review Board of National Cancer Center (2015-0258-0001, 2016-03-18). The applicant for the ethics approval document is Ji Young You, the first author. In 2015, he obtained the ethical approval for the study from the National Cancer Center. He moved to Korea University (current affiliation) in 2017.
Informed Consent Statement
Informed consent was obtained from all subjects involved in the study.
Data Availability Statement
The data presented in this study are available on request from the corresponding author.
Supplemental Material
Supplemental material for this article is available online.
References
Supplementary Material
Please find the following supplemental material available below.
For Open Access articles published under a Creative Commons License, all supplemental material carries the same license as the article it is associated with.
For non-Open Access articles published, all supplemental material carries a non-exclusive license, and permission requests for re-use of supplemental material or any part of supplemental material shall be sent directly to the copyright owner as specified in the copyright notice associated with the article.