
Abstract
Background
The rapid increase in the detection rate of thyroid cancer over the past few decades has caused some unexpected economic burdens. However, that of papillary thyroid carcinoma (PTC) seems to have had the opposite trend, which is worthy of further comprehensive exploration.
Methods
The Surveillance, Epidemiology, and End Results 18 database was used to identify patients with PTC diagnosed during 2003-2017. The incidence trends were analyzed using joinpoint analysis and an age-period-cohort model.
Results
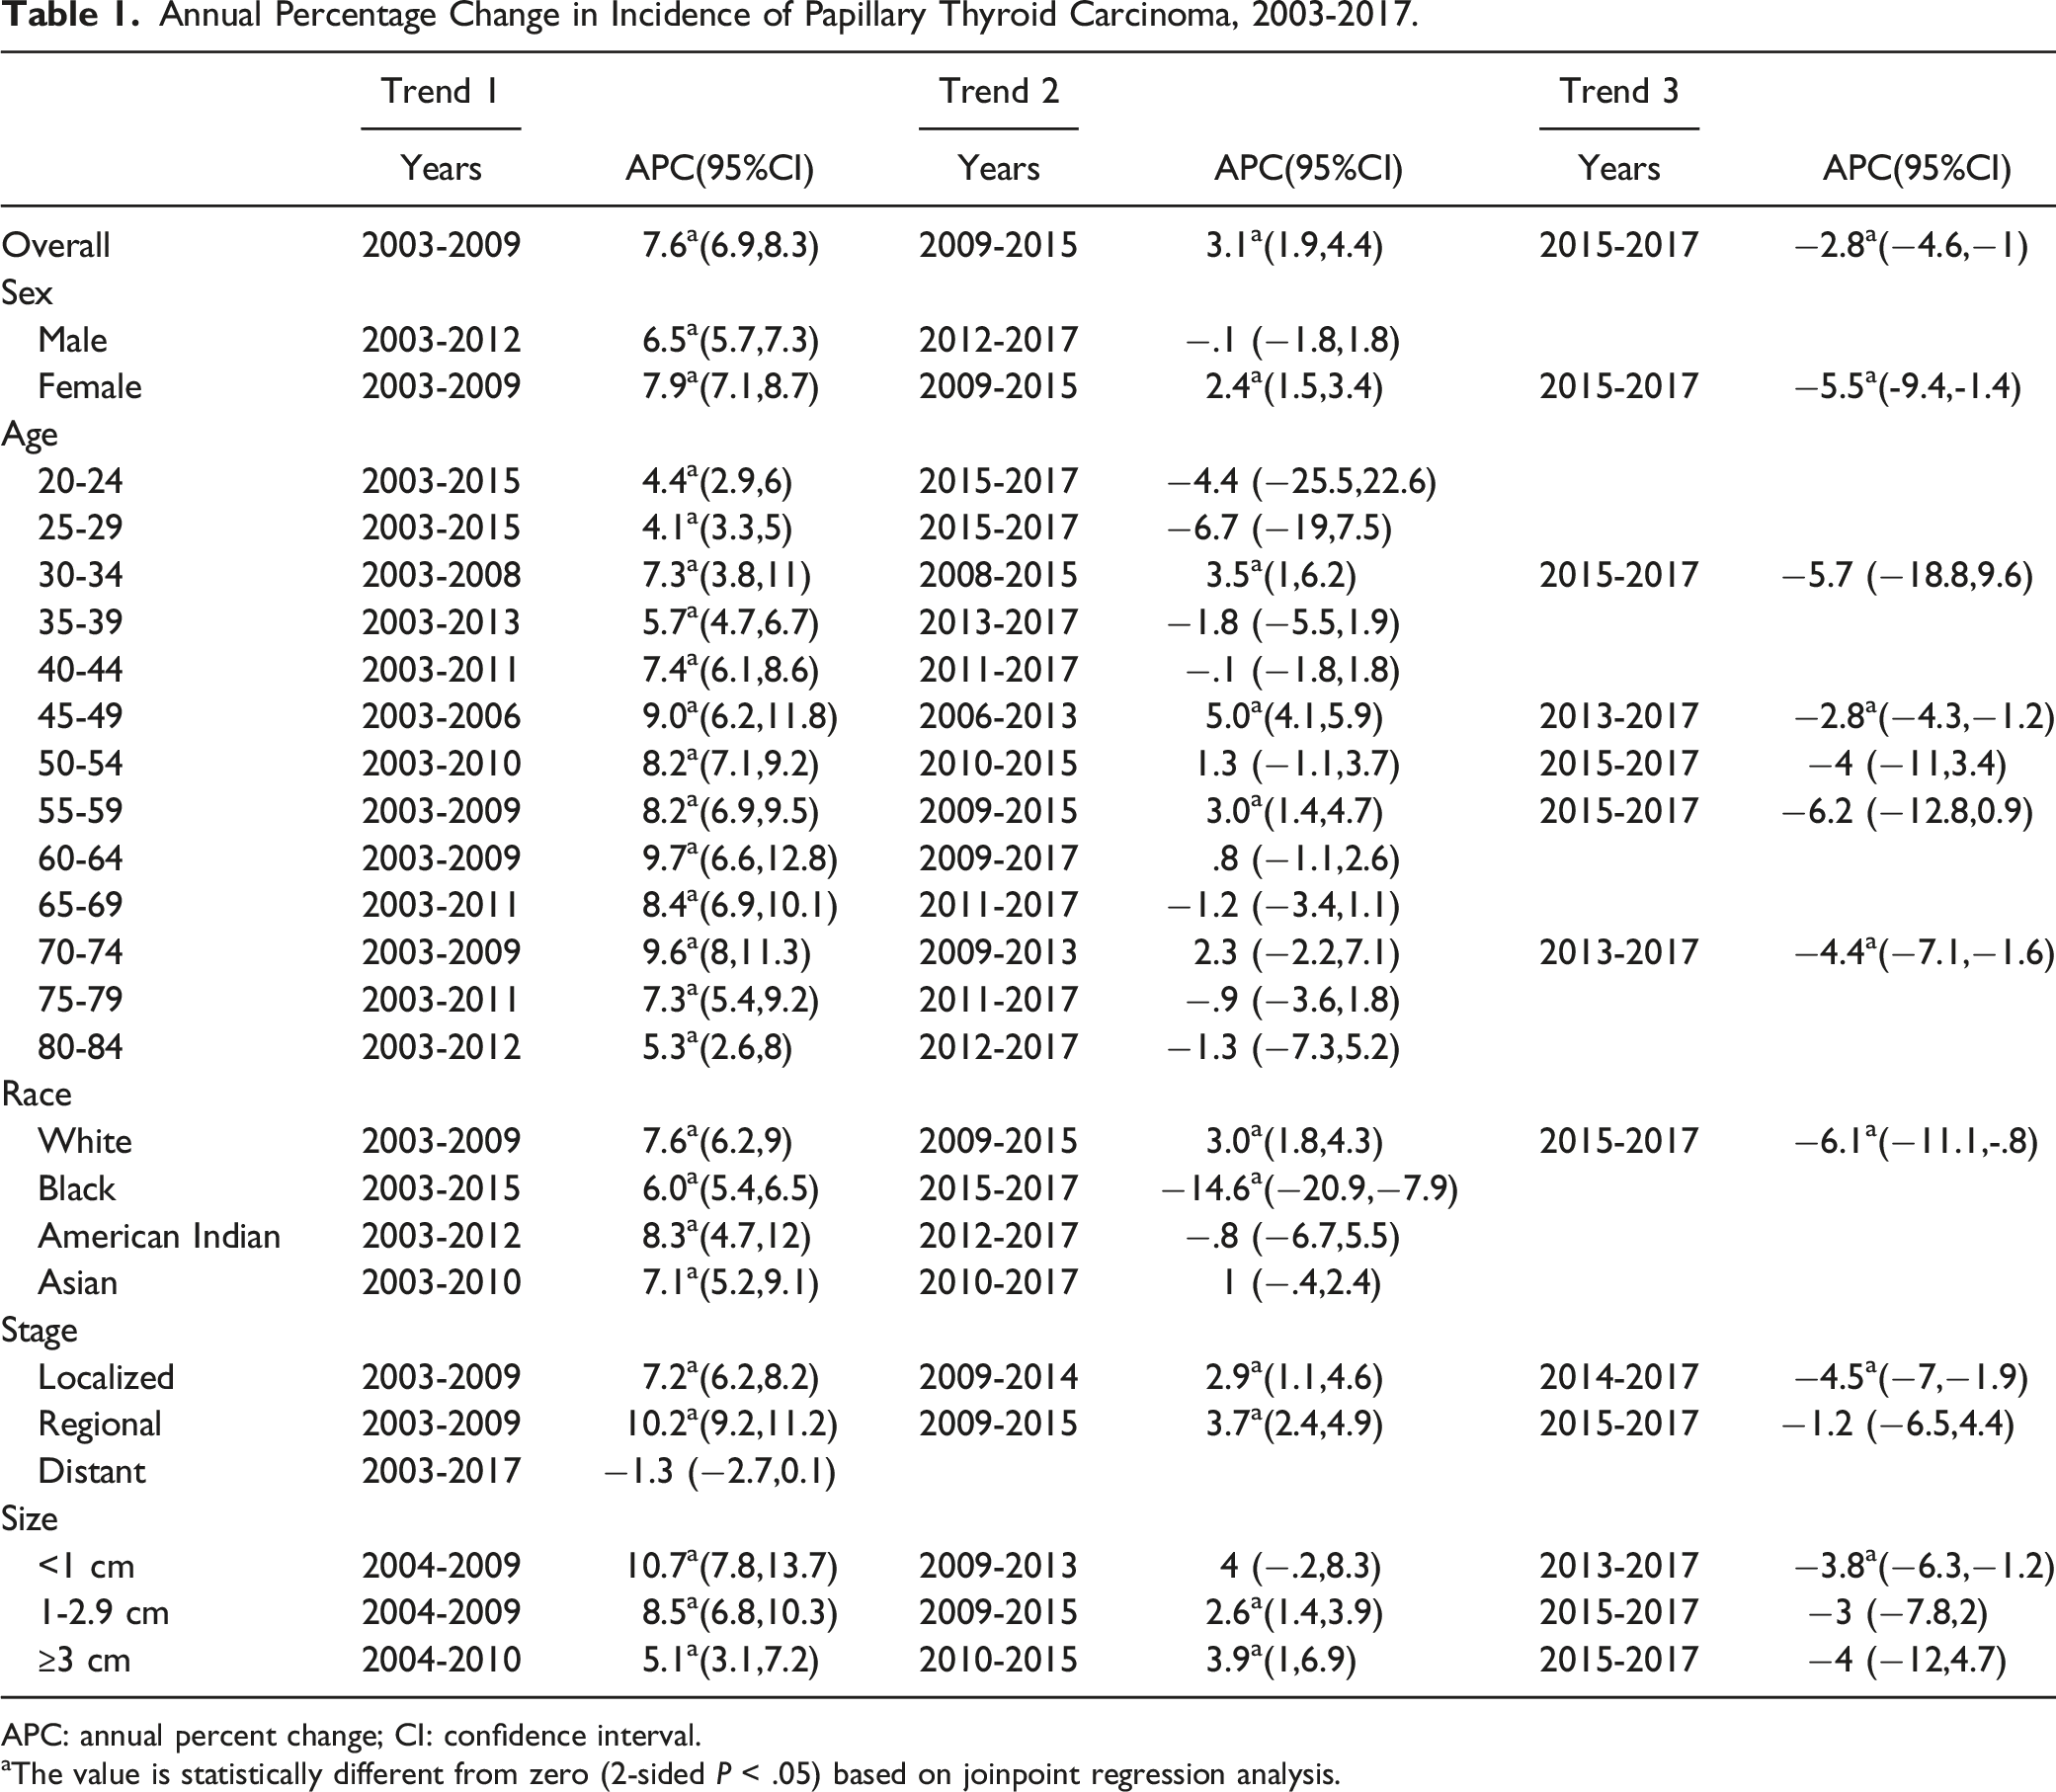
The overall PTC incidence rate increased from 9.9 to 16.1 per 100 000 between 2003 and 2017. The joinpoint analysis indicated that the incidence growth rate began to slow down in 2009 (annual percentage change [APC] = 3.1%, 95% confidence interval [CI] = 1.9%–4.4%). After reaching its peak in 2015, it began to decrease by 2.8% (95% CI = −4.6% to −1.0%) per year. The stratified analysis indicated that the incidence patterns of different sexes, age groups, races, and tumor stages and sizes had similar downward trends, including for the localized (APC = −4.5%, 95% CI = −7% to −1.9%) and distant (APC = −1.3%, 95% CI = −2.7% to −.1%) stages, and larger tumors (APC = −4%, 95% CI = −12% to 4.7%). The age-period-cohort model indicated a significant period effect on PTC, which gradually weakened after 2008-2012. The cohort effect indicates that the risk of late birth cohorts is gradually stabilizing and lower than that of early birth cohorts.
Conclusion
The analysis results of the recent downward trend and period effect for the incidence of each subgroup further support the important role of correcting overdiagnosis in reducing the prevalence of PTC. Future research needs to analyze more-recent data to verify these downward trends.
Keywords
Introduction
The incidence of thyroid cancer (TC) has been increasing in recent decades, especially among females.1,2 Papillary thyroid carcinoma (PTC) is the most common thyroid cancer, accounting for more than 90% of cases.3,4 Previous studies have found that almost all worsened diagnoses are attributable to increases in PTC. 5 The global incidence of TC is increasing much faster than other malignancies due to the widespread use of well-diagnosed thyroid ultrasonography and needle biopsy.4,6 This trend is particularly striking in the United States, where the PTC incidence in females increased from 4.6 to 17.9 per 100 000 between 1975 and 2017. 3
Many researchers believe that the significant increase in TC incidence is due to overdiagnosis.6,7 Others believe that the important underlying factors include obesity and increased exposure to ionizing radiation.8,9 The sharp increase in TC incidence was recently observed to have slowed down and even reversed, especially in small TC tumors. 10 Whether this transition is common and its reason are worthy of further investigation.
Therefore, in order to systematically and comprehensively understand the latest evolutions in PTC, this study examined the period trend of PTC incidence according to age, sex, race, tumor size, and tumor stage. Based on the age-period-cohort model, we evaluated the effects of age, period, and birth cohort on time trends, which can provide clues for understanding the role of risk and protective factors in the etiology of PTC.
Materials and Methods
Data Source
First PTC diagnoses during 2003-2017 were selected from the Surveillance, Epidemiology, and End Results (SEER) 18 database, which contains data from 18 cancer registries covering approximately 35% of the United States population. Multicenter, high-quality, public data provide reliable evidence support and first-hand information for evidence-based practice by clinicians and cancer researchers.11,12 PTC cases were defined using International Classification of Diseases for Oncology (third edition) histological codes 8050, 8052, 8130, 8260, 8340-8344, 8450, and 8452, and primary site code C73.9. Age at diagnosis (20-84 years), race (white, black, American Indian/Alaska Native, Asian Americans, or Pacific Islander), sex (male, female), tumor size (<1 cm, 1-2.9 cm, ≥3 cm) and SEER summary stage (localized, regional, and distant) were included in this study.
All the steps in this study follow the principles outlined in the 1964 Helsinki Declaration and its subsequent amendments. This study was exempted the informed consent and review approval by the Institutional Research Committee of School of Basic Medicine and Public Health of Jinan University, because the SEER data were public and all patient information was de-identified.
Statistical Analysis
The SEER*Stat program of the National Cancer Institute was used to calculate age-standardized incidence rates (ASIR; standardized to the United States population in 2000) and 95% confidence intervals (CIs). ASIR was stratified by sex, age, race, and tumor stage and size.
Joinpoint regression software was developed by the National Cancer Institute (NCI) and is used to capture changes in cancer trends. 13 The Joinpoint regression software also allows to find statistically best fits the trend data, utilizing with the minimum number of joinpoints to the model with maximum number of joinpoints. Joinpoint regression analysis was used to describe the continuous incidence trend. 14 At each optimal fitting point, the direction of the ASIR trend was observed. The annual percentage change (APC) was the change rate at each interval. A two-sided probability value of P < .05 was considered statistically significant. Joinpoint regression software version 4.9.1.0 was used in this study.
The age-period-cohort model was fitted to 5-year bands according to ages (20-24, 25-29, …, 75-79, 80-84 years), periods (2003-2007, 2008-2012, 2013-2017), and birth cohorts (1923-1927, 1928-1932, …, 1988-1992, 1993-1997). In this study, the intrinsic estimator algorithm is used to solve the unrecognizable problem of age, period and cohort collinearity. The algorithm has been confirmed to be estimable, unbiased, and asymptotic. 15 The Akaike information criterion and Bayesian information criterion were used to test the goodness of fit of the model. These statistical analyses were performed using Stata software.
Results
The ASIRs of PTC overall and by sex during 2003-2017 are shown in Figure 1. The overall PTC incidence increased from 9.9 to 16.1 per 100 000 between 2003 and 2017. The joinpoint analysis indicated that the growth rate was the fastest before 2009, when it increased by 7.6% (95% CI = 6.9%–8.3%) per year, and then decreased by 3.1%. After reaching its peak in 2015, it began to decrease by 2.8% per year (Table 1). The incidence for female patients continued to increase from 2003 to 2015, with the fastest increase rate of 7.9% (95% CI = 7.1%–8.7%) per year from 2003 to 2009, which then slowed to 2.4% (95% CI = 1.5%–3.4%) during 2009-2015. Similarly, the incidence began to decline at a rate of 5.5% (95% CI = −9.4% to −1.4%) after 2015. Among male patients, the increase during 2003-2012 was comparable to that in female patients (APC = 6.5%, 95% CI = 5.7%–7.3%) (Table 1), with a stable and declining trend in subsequent years (Figure 1). Trends in the incidence rate of PTC by tumor sex. Rates are age adjusted to the 2000 US standard population. Annual Percentage Change in Incidence of Papillary Thyroid Carcinoma, 2003-2017. APC: annual percent change; CI: confidence interval. aThe value is statistically different from zero (2‐sided P < .05) based on joinpoint regression analysis.
The age-specific incidence curve is shown in Figure 2. During the study period, the incidence rates were lower for those aged <30 and 80-84 years than in the other age groups. Overall, before about 2009, those aged 30-34 and 40-79 years had the fastest growth rates, with an annual growth rate of more than 7%, of which those aged 60-64 and 70-74 years had a rate of nearly 10%. Each age group had a varying degree of decline after 2013 or 2015, although some APCs were not statistically significant (Table 1). Age-specific incidence trends of PTC.
Incidence trends were similar for whites and Asian Americans, who had consistently higher rates than blacks and American Indians (Figure 3). The incidence for whites increased by 7.6% (95% CI = 6.2-9.0%) per year during 2003-2009. The rate of increase slowed slightly during 2009-2015 (APC = 3.0%, 95% CI = 1.8%–4.3%) (Figure 3 and Table 1). Likewise, the incidence among whites declined at a rate of 6.1% (95% CI = −11.1% to −.8%) between 2015 and 2017. Asian Americans also had a fluctuating slight decline of 1% (95% CI = −.4% to −2.4%) during the most-recent period. The incidence for blacks declined significantly by 14.6% (95% CI = −20.9% to −7.9%) per year after 2015. Trends in the incidence rate of PTC by race. Rates are age adjusted to the 2000 US standard population.
PTC incidence curves and APCs by stage are presented in Figure 4 and Table 1. There was a significant difference in incidence among the three stages, with the highest and lowest in the localized and distant stages, respectively. The incidence rates for patients in the localized and regional stages increased rapidly at rates of 7.2% and 10.2% before 2009, respectively, and by 2.9% and 3.7% each year during 2009-2015. The incidence rates for patients in both stages decreased after 2015, with those in the localized stage having the greatest decrease (APC = −4.5%, 95% CI = −7% to −1.9%). The incidence for distant-stage patients has been stable for the past 15 years, and a slight downward trend was also recently observed (APC = −1.3% to 95% CI = −2.7% to .1%). Trends in the incidence rate of PTC by tumor size. Rates are age adjusted to the 2000 US standard population.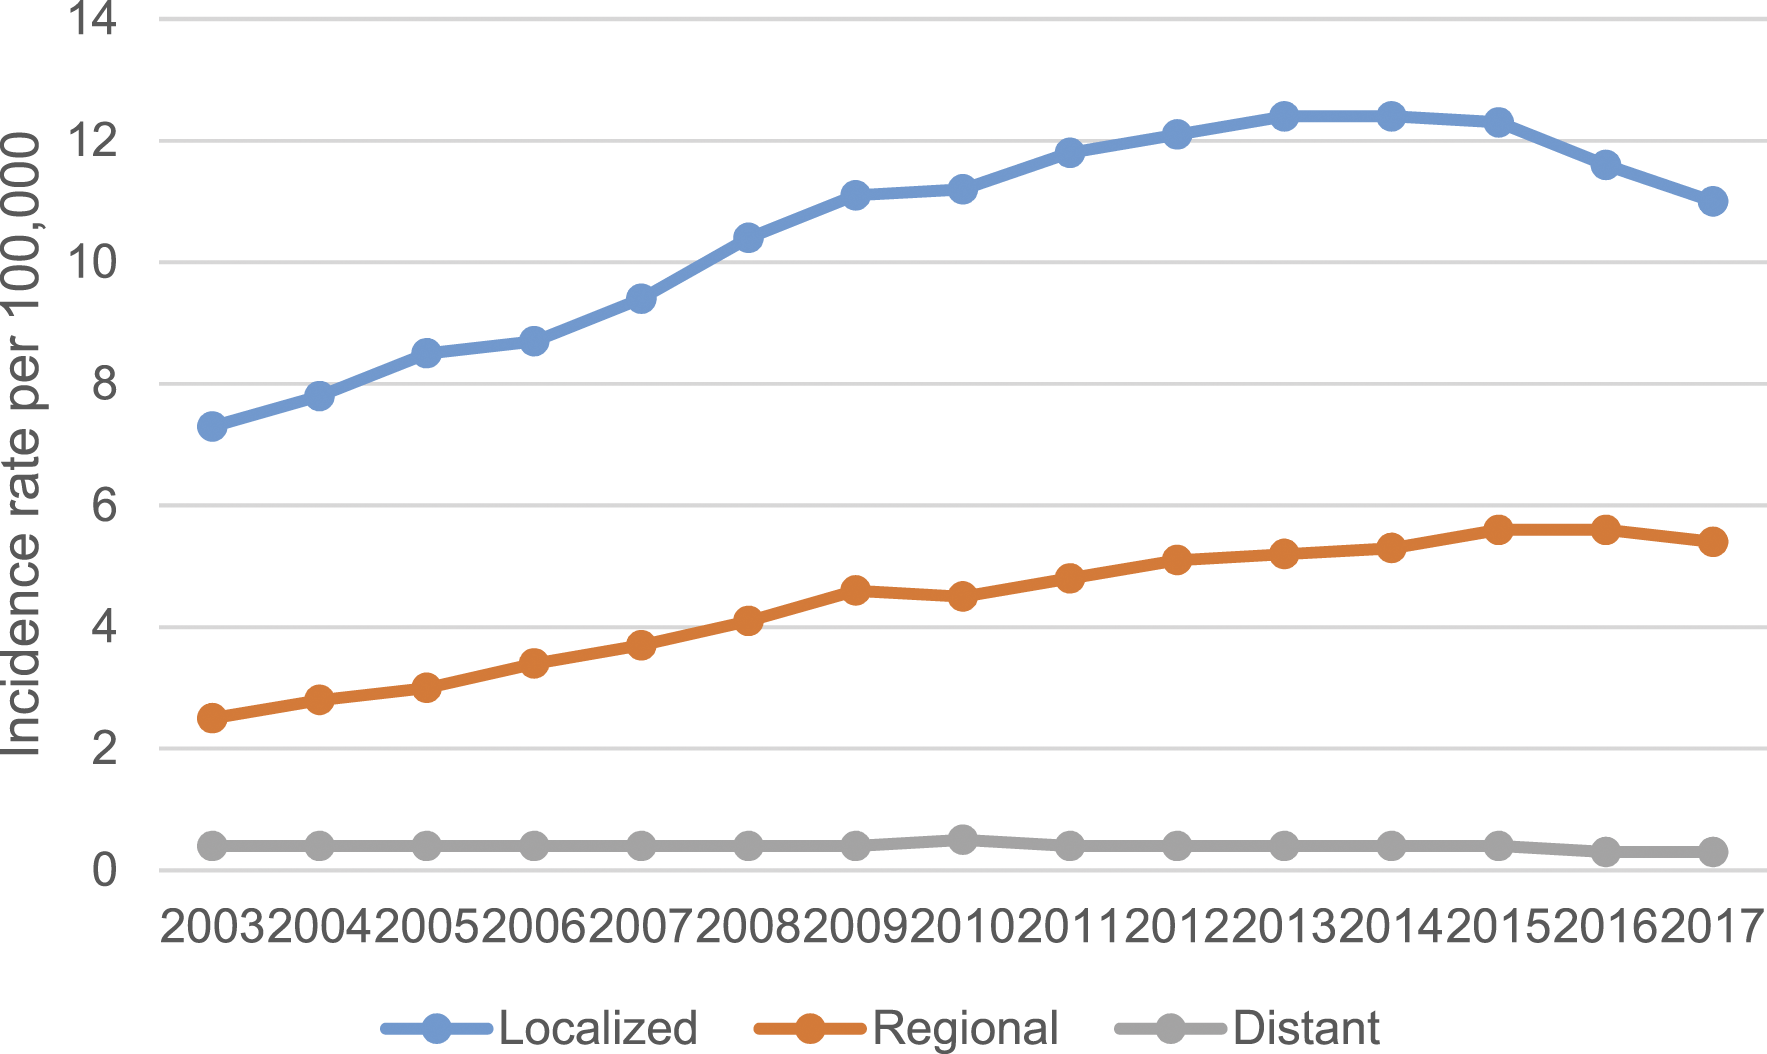
We also examined the trend of PTC incidence according to tumor size (Figure 5). The incidence of cancers of all sizes had the fastest growth rate during 2004-2009, with smaller tumors having faster rates (Table 1). After 2009-2010, the incidence growth rate of three sizes of PTC slowed. We found that the incidence of tumors smaller than 1 cm was reversed from 2013, decreasing by 3.8% per year. Similarly, tumor of 1-2.9 cm and larger had downward trends after 2015 (3% [95% CI = −7.8% to 2%] and 4% [95% CI = −12% to 4.7%]). Trends in the incidence rate of PTC by stage. Rates are age adjusted to the 2000 US standard population.
The age-period-cohort analysis revealed period and cohort effects on PTC incidence trends (Figure 6). There was a significant period effect during the study period. The effect size increased rapidly before 2008-2012, after which it slowed. This indicates that the rate of increase in risk has slowed down after 2008-2012, which was consistent with the results of the joinpoint analysis. Cohort effects and period effects had opposite trends. The cohort curve had a slight downward trend. Taking the 1960 birth cohort as a reference, the risk of patients born before was slightly higher, and the risk of the subsequent birth cohort gradually decreased and leveled off. Period and cohort effects in the incidence of papillary thyroid carcinoma.
Discussion
Our joinpoint analysis of PTC incidence during 2003-2017 found that the overall incidence in the United States did actually increase rapidly during 2003-2009 (APC = 7.6%, 95% CI = 6.9-8.3%), and then decreased from 2009 to 2015 at a rate of 3.1% per year. Notably, the trend of the overall PTC incidence began to reverse after 2015, showing a decrease of 2.8% per year. Similar downward trends were found when the data were stratified by sex, age, race, and tumor stage and size. The significant period effect indicated that PTC risk increased slowly after 2008-2012, while the cohort effect showed an opposite trend. After the 1960s, PTC risk decreased slightly and leveled off, indicating that later birth cohorts have lower risks than earlier birth cohorts.
The decrease in the detection rate of PTC and the downward trend may be caused by various factors. Since the late 1970s, when high-resolution imaging techniques were first used to assess thyroid nodules leading to an increased likelihood of detecting localized TC and low-risk small nodules early, the widespread use of ultrasonography and needle biopsy led to an increased detection rate of small tumors.16-18 There are multiple reports of the detection rate of PTC increasing, but this was not associated with any benefit of a reduced mortality risk.19,20 The American Thyroid Association (ATA) therefore guidelines should not recommend biopsy of nodules of 5 mm or less from 2009. 21 The 2015 ATA guidelines pointed out that the maximum threshold for needle aspiration biopsy was increased to 1 cm. 22 For nodules less than 1 cm suspicious ultrasound, if there is no thyroid invasion or ultrasound suspicious lymph nodes can be closely followed up. The present study indicated that the incidence of tumors <1 cm decreased to 4% from an annual increase of 10.7% prior to 2009. At the same time, a decreasing trend was also observed for tumors sized 1-2.9 cm and larger than 3 cm. Compared with before the revision, the increasing trend in the PTC incidence subsequently slowed, indicating that it played a role in reducing the detection rate of PTC. 23
The PTC incidence peaked in 2015, followed by a downward trend. In addition to changes in screening and thyroid nodule and biopsy criteria, another important factor contributing to the increased PTC incidence in the past 2 decades is the increase in the diagnosis of the follicular variant of PTC.24-26 Previous research demonstrated that patients with noninvasive encapsulated follicular variant of papillary thyroid carcinoma (EFVPTC) have a very low risk of adverse outcomes and should be recoded to classify noninvasive EFVPTC from malignant to tumor in situ. 27 This reclassification can significantly reduce the clinical consequences associated with diagnosis and helps to reduce the fear experienced by patients. A recent stratification of the histological subtypes of PTC also indicated that the decline in the overall PTC incidence during 2015-2017 coincided with a decline in the noninvasive EFVPTC incidence, which was an important reason for the recent decline in the PTC incidence. 24
Other possible risk factors for PTC include ionizing radiation, genetic changes, obesity, lifestyle changes, etc.28,29 Some studies have linked obesity and overweight to an increased risk of thyroid cancer29,30 but some have had the opposite result. 31 Exposure of human thyroid cells to ionizing radiation can induce chromosomal rearrangements that lead to carcinogenesis and are therefore thought to be closely associated with an increased risk of PTC. 32 However, the effects of these lifestyle and environmental changes on reducing the incidence of PTC are still unclear.
Period effects generally reflect changes in risk affecting all age groups over a time period due to changes in environmental factors, diagnostic criteria, disease classification, and screening programs. The results for the period effects in this study also reflect recent trends in the PTC incidence associated with revisions of the ATA guidelines and changes in disease classification, which was consistent with the above analysis. An epidemiological study using data from the national cancer registry of South Korea during 1999-2016 determined that after nationwide screening for TC was introduced in 1999, the ASIR of TC increased 10-fold in just over a decade (from 6.3 per 100 000 in 1999 to 63.4 per 100 000 in 2012). 33 However, the TC incidence in South Korean females decreased by nearly 20-fold in just 4 years, due to changes in thyroid nodule screening guidelines and debate among the South Korean public, epidemiologists, and TC doctors about TC overdiagnosis since 2014. 33 These observations demonstrate the importance of the period effect on changes in TC incidence. The dramatic increase in incidence has been reversed by the emphasis on overdiagnosis and overtreatment of indolent diseases in the United States and the implementation of changes in clinical practice guidelines related to biopsy risk criteria. This decreasing trend was observed in all subgroups, with significant decreases not only in those with small tumors at the distant stage, but also for >1 cm tumors at the distant stage, which was not statistically significant. This suggests that the measures taken contributed significantly to reducing the PTC prevalence; however, due to delays in data registration, more data are needed to characterize recent trends.
The cohort effect showed that the risk of morbidity in late birth cohorts decreased and stabilized compared with early birth cohorts. This may be due to changes in lifestyle and disease awareness. The most-recent birth cohort was better educated and had a better understanding of cancer knowledge and disease prevention. 34 In addition, based on research into the long-term downward trend of global TC mortality and the downward trend of period and cohort effects, it has been argued that there is a lack of evidence for “true” risk factors (ie, those other than overdiagnosis) that may significantly contribute to TC mortality and indirectly confirm a major role of overdiagnosis in TC morbidity. 35
The study had some limitations. Firstly, due to delays in data registration, only 2 years of decline were observed, and more up-to-date data are therefore needed to confirm whether this trend can be maintained. Secondly, although the age-period-cohort model can provide clues to the etiology of emerging trends, it does not produce direct evidence. At the same time, due to the inherent limitations of collinearity in the age-period-cohort model, the corresponding results should be cautiously interpreted. Due to the lack of relevant data on some important influencing factors such as personal lifestyle and environmental exposures in the SEER database, it is difficult to assess their impact on changes in PTC risk.
Conclusions
In conclusion, the present analysis has revealed that the PTC incidence, which has been increasing rapidly, has recently slowed down and even decreased, including for tumors that are larger and of distant stage. This further supports the importance of overdiagnosis regarding health policymakers, physicians, and patients, the revision of thyroid management guidelines, and the reclassification of low-risk indolent TC as significant contributors to the decreased PTC detection rate. The results for the period effect also suggest that changes in PCT incidence are closely related to overdiagnosis. Future studies will need to analyze more-recent data to confirm these trends.
Footnotes
Author Contributions
Jun Lyu, Yunmei Li and Wenqiang Che designed the study; Material preparation, data collection and analysis were performed by Zhong Yu, Shuai Zheng, Shuping Xie, Chong Chen, Mengmeng Qiao. The first draft of the manuscript was written by Yunmei Li and all authors commented on previous versions of the manuscript. All authors read and approved the final manuscript.
Declaration of Conflicting Interests
The author(s) declared no potential conflicts of interest with respect to the research, authorship, and/or publication of this article.
Funding
The author(s) disclosed receipt of the following financial support for the research, authorship, and/or publication of this article: This work was supported by the Guangdong Provincial Key Laboratory of Traditional Chinese Medicine Informatization (2021B1212040007).
Ethics Statement
All procedures performed in the present study were in accordance with the principles outlined in the 1964 Helsinki Declaration and its later amendments. This study was exempted from obtaining informed consents and review and approval by the institutional research committee of the School of Basic Medicine and Public Health, Jinan University because SEER research data is publicly available and all patient data are de-identified.