
Abstract
Background
Breast cancer (
Methods
Univariate Cox regression analysis and LASSO regression analysis were performed to identify prognostic factors and build prognostic models. We distributed the patients into 2 groups based on the median risk score, analyzed prognosis by Kaplan–Meier curve, and screened independent prognostic factors by multivariate Cox regression analysis.
Result
We identified 4 indicators-LDH, CRP, CA 15-3, and CA 125—related to the prognosis in
Conclusion
We successfully established an optimization model by combining 4 prognosis-related indicators to assess the prognosis in patients with metastatic
Introduction
Breast cancer (
TNBC is a poor prognosis factor, the prognosis of patients is very poor, and the number of patients with TNBC is small. As we could not measure its weight in the model, we excluded patients with TNBC. Additionally, it is difficult to follow up the overall survival (OS) of patients with HER2-positive and early ER- and PR-positive tumors because of their long survival time. Therefore, we selected patients with stage IV tumors with ER-positive, PR-positive, and HER-2 negative status.
Some serum tumor indicators are correlated with prognosis in patients with
As all the indicators have false positives and false negatives, we attempted to combine multiple indicators to analyze prognosis in each patient. In the present study, we combined 4 indicators to predict prognosis in patients with metastatic
Material and Methods
Patients
The inclusion and exclusion criteria were shown in Supplementary Figure S1.
This retrospective study included 130 patients with metastatic
Inclusion and Exclusion Criteria
The inclusion and exclusion criteria are shown in Supplementary Figure S1.
The inclusion criteria for patients were as follows: (a) Aged 18-75 years; (b) Eastern Cooperative Oncology Group (ECOG) score of 0-1; (c) tumor molecular subtypes ER-positive, PR-positive, and HER-2–negative; (d) stage IV disease. The exclusion criteria for patients were as follows: (a) HER-2 positive and TNBC; (b) men with
Examination of Serum Indicators
Patients underwent fasting for 8 h at night before the blood test, and elbow venous blood was collected between 7
Evaluation and Follow-Up of Patients
Computed tomography (CT) was performed every 3 months to evaluate the response and patients were assessed according to the Response Evaluation Criteria in Solid Tumors (RECIST) 1.1. 13 The survival duration was calculated from the time of diagnosis to death or the last follow-up. Patients were followed up for 13-48 months (median, 23 months). The first follow-up was 1 month after radiotherapy and continued until the patient died or the end of the study in August 2019. The first follow-up for patients who received first-line endocrine therapy was 3 months after treatment and for those who received first-line chemotherapy was 2-3 cycles after chemotherapy.
Construction of Prognostic and Validation Models
Prognostic risk scores were obtained for all patients by univariate Cox regression analysis and LASSO-penalized Cox regression.
14
To further verify the feasibility of the prognostic model, we randomly distributed the patients into 2 groups-test and training-using the edgeR package (v3.52). The survival of patients in the 2 groups was analyzed using the Kaplan–Meier (KM) analysis. The risk score calculation formula is as follows

Statistical Analysis
All statistical analyses were performed using GraphPad Prism version 8.0 (GraphPad Software, La Jolla, CA, USA). For analysis of survival data, KM curves were constructed, and statistical analysis was performed using log-rank test. Univariate and multivariate Cox regression analyses were used to identify the independent risk factors associated with
Results
Clinical Features of Patients With BC
Clinicopathological Features of

Abbreviation: BC, breast cancer; PD, progressive disease, PR, partial response; SD, stable disease
Prognostic Significance of Pretreatment Parameters in Patients With Metastatic BC
The patients were distributed into 2 groups according to median parameter levels. With univariate Cox regression analysis, prognostic factors are screened for Univariate Cox regression analysis of clinical indicators.
The high LDH group showed worse OS than low LDH group (Figure 2A; P = .017; hazard ratio, (HR) 1.528; 95% confidence interval (CI), 1.055-2.215). The high CRP group showed worse OS than low CRP group (Figure 2B; P = .004; HR, 1.666; 95% CI, 1.143-2.429). The high CA 15-3 group showed worse OS than low CA 15-3 group (Figure 2C; P = .011; HR, 1.563; 95% CI, 1.075-2.274). The high CA 125 group had worse OS than low CA 125 group (Figure 2D; P = .021; HR, 1.499; 95% CI, 1.031-2.181). The Kaplan–Meier (KM) curve for clinical indicators related to prognosis: A, LDH; B, CRP; C, CA 15-3; and D, CA 125.
Development of Prognostic and Validation Models
We used univariate Cox regression and LASSO regression analyses to build an optimization model (Figure 3A and 3B). The prognostic parameter signature was derived as a risk score using the following formula: Construction of the prognostic and validation models. A, risk score and distribution of groups in all patients with breast cancer (
Risk score = (CA 15-3 value × .02248) + (CA 125 value × .01143) + (LDH value × .00025) + (CRP value × .07668).
We classified patients into high- and low-risk score groups based on the median risk score as the cutoff and analyzed the survival by KM curve. The high-risk score group showed worse OS than low-risk score group (Figure 4A; P = .001; HR, 1.835; 95% CI, 1.257-2.678). Prediction of prognosis using prognostic and validation models. A, Kaplan–Meier (KM) curves for all patients with 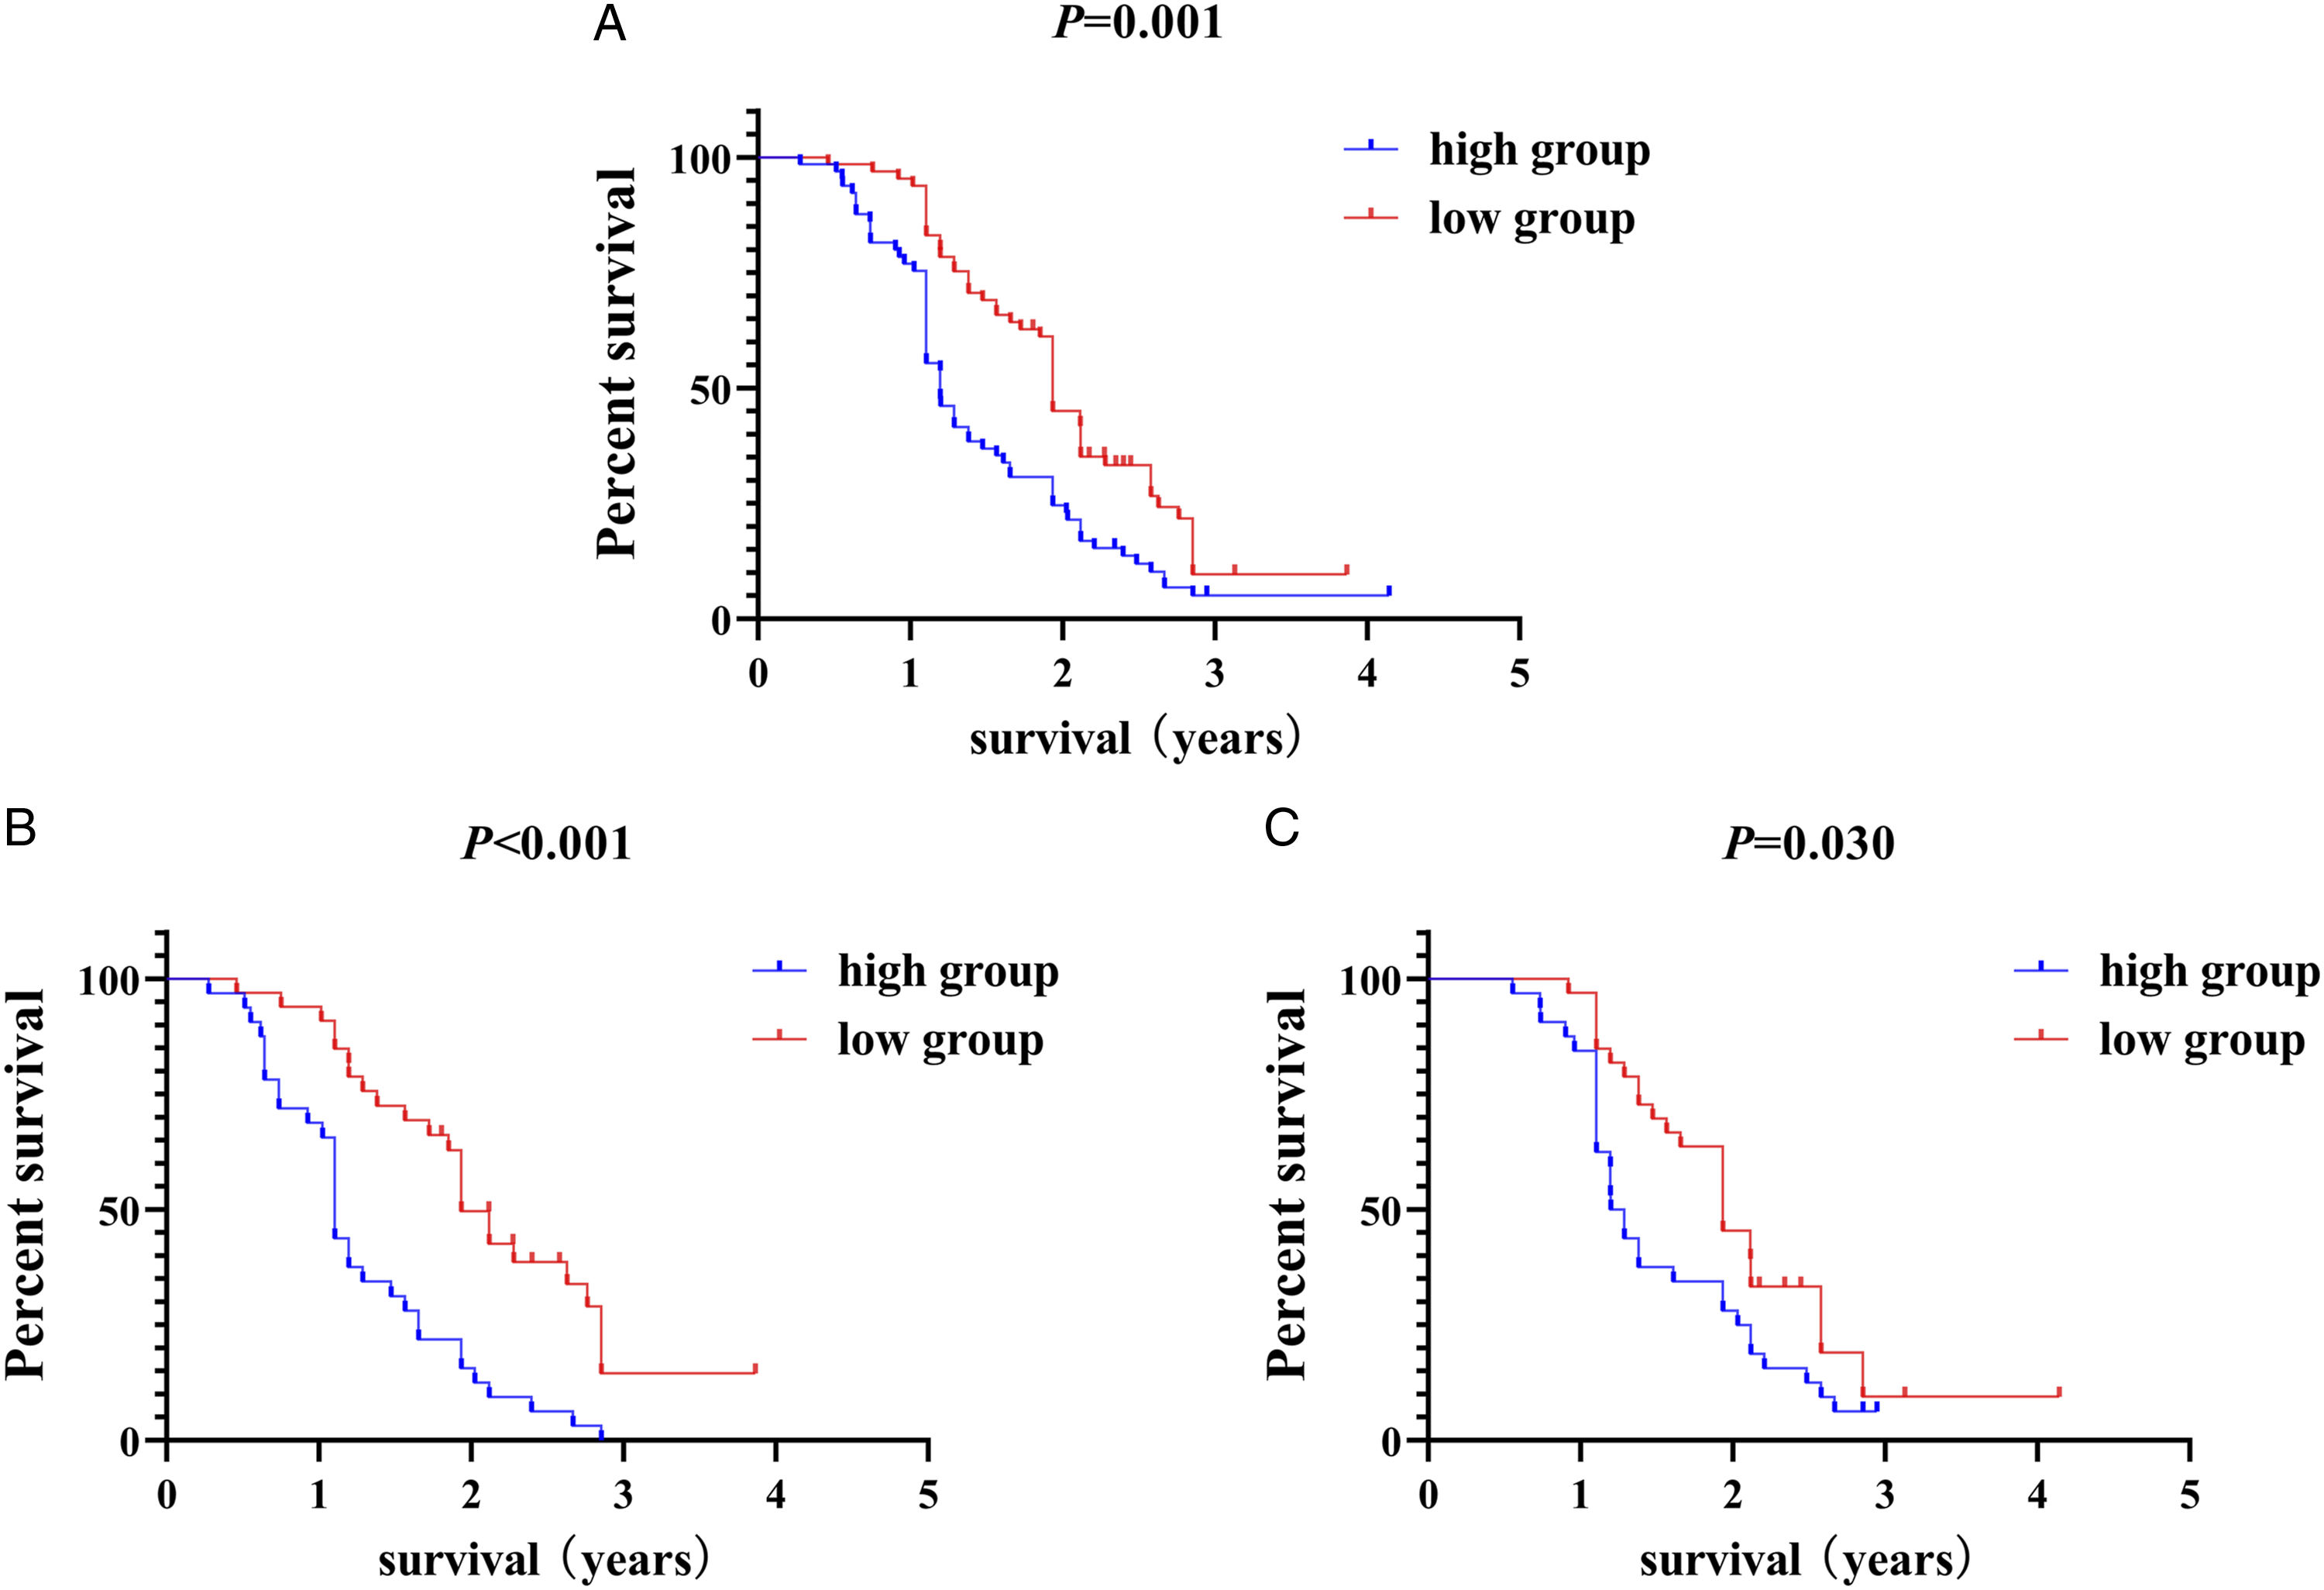
To further verify the feasibility of the model, we used the edgeR package, which randomly distributed all patients into 2 groups—test and training to construct validation models (Figure 3C-F). Regardless of the test or training groups, the prognosis of the high-risk score group is shown in Figure 4B (test: P<.001; HR, 2.698; 95% CI, 1.546-4.708) and Figure 4C (training: P = .030; HR, 1.705; 95% CI, 1.002-2.900).
Clinical Outcome of Prognostic Models
The univariate analyses showed that high Ki-67 (HR, 1.508; 95% CI, 1.037-2.193; P = .031) and high-risk score (HR, 1.863; 95% CI, 1.283-2.704; P = .001) were significant risk factors for worse prognosis (Figure 5A). In the multivariate analysis, high-risk score (HR, 1.800; 95% CI, 1.236-2.621; P = .002) was found to be independently associated with worse survival (Figure 5B). The outcomes of the multivariate analyses for OS are shown in Table 2. Cox regression analysis of prognostic model. A, univariate analyses; B, multivariate analyses. Univariate and multivariate logistic regression analysis of Breast cancer patients risk factors.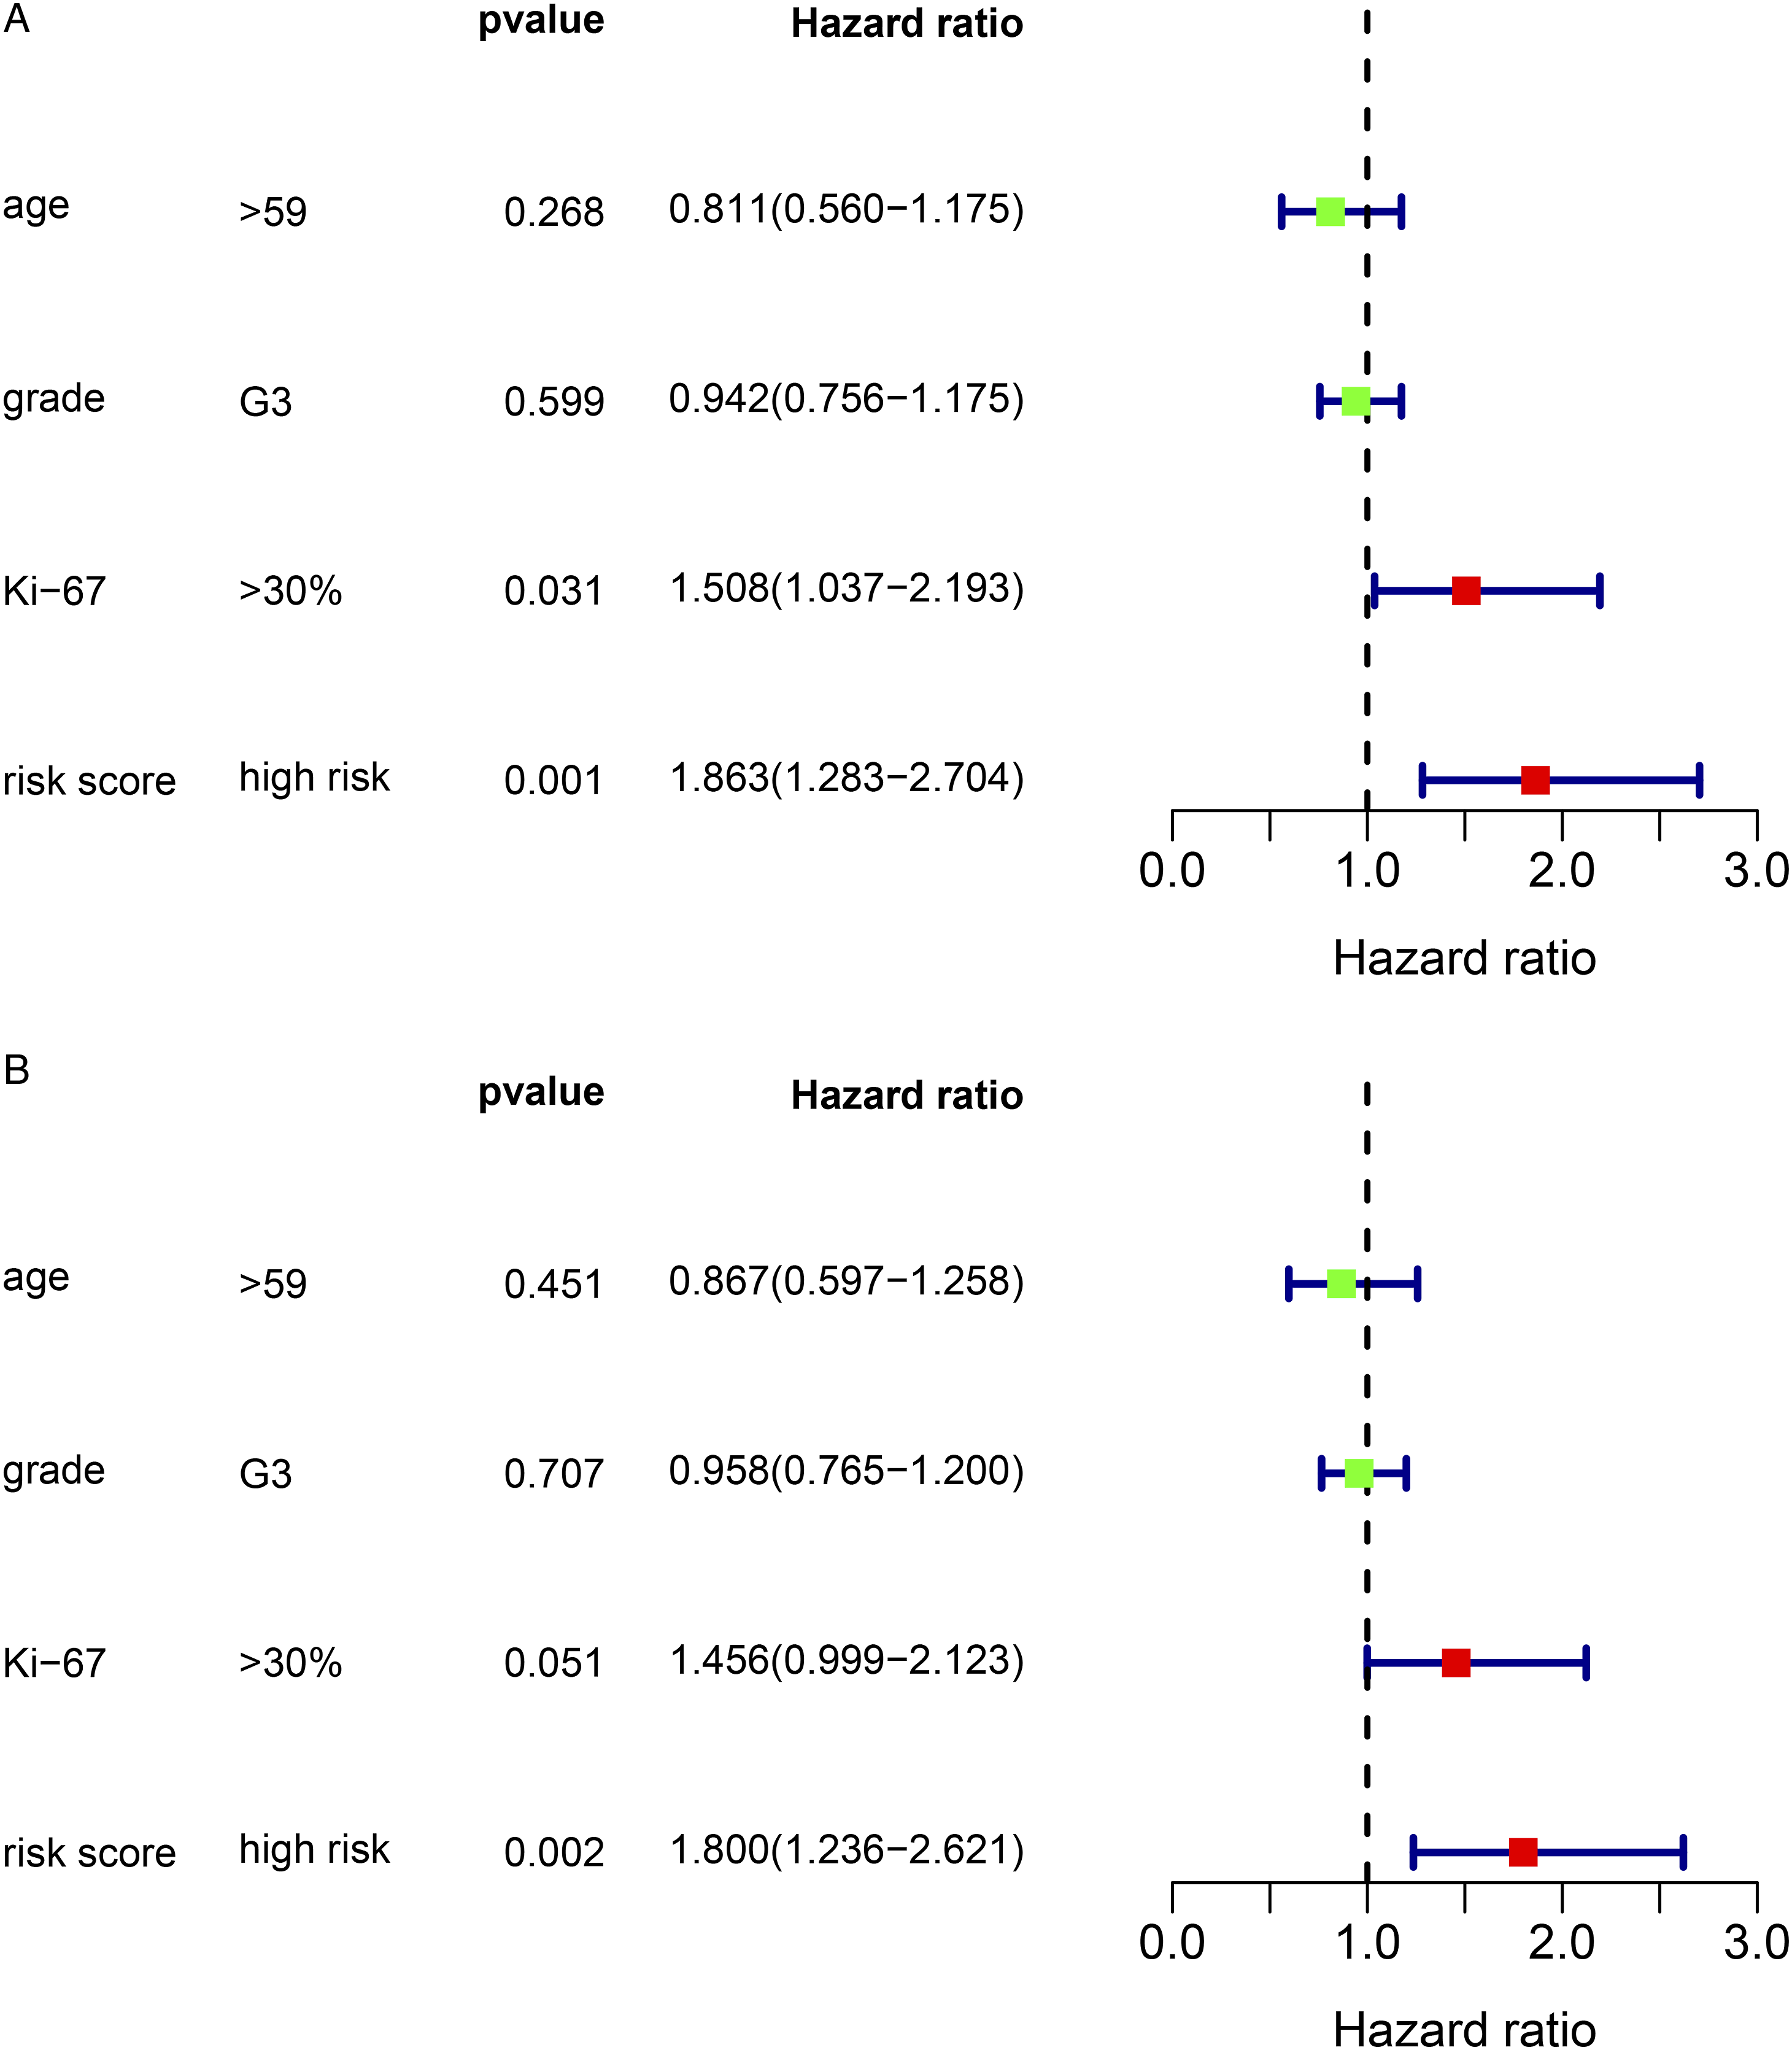

The risk scores varied significantly between the different Ki-67 groups (Figure 6A) and different first-line treatment effect groups (Figure 6D). The risk scores were not significantly different between the different age groups (Figure 6B) and different grade groups (Figure 6C). Relationship between risk score and clinicopathological features in prognostic model. A, Ki-67; B, age; C, grade; and D, first-line treatment effect.
Verification of the Accuracy of the Prognostic Model
To further verify the accuracy of the prognostic model, we constructed an ROC curve, as shown in Figure 7. The area under the curve for risk score was .824, for Ki-67 was .628, for age was .511, and for grade was .545. Receiver operating characteristic (ROC) curve for prognostic model and clinicopathological features.
Discussion
Breast cancer is the most common malignancy, and despite recent advances in diagnosis and treatment, it remains the second leading cause of death in women. Highly aggressive subtypes of TNBC and chemoresistance are 2 challenging areas of current research. However, tumor biomarkers have been found to assist in breast cancer diagnosis, prognosis, prediction of treatment response, and disease monitoring during and after treatment. 15
In the present study, 4 indicators related to prognosis-LDH, CRP, CA 15-3, and CA 125-were identified to construct an optimization model with univariate Cox and LASSO Cox regression analyses. In the model, we distributed patients into 2 groups based on the median risk score, and patients with high-risk scores showed worse prognosis than those with low-risk scores. To further verify the model, the R language was used to randomly distribute the patients into 2 groups. We found that regardless of the group, the prognosis of patients with high-risk score had worse OS than those with low-risk score.
A few serum indicators are currently being used to predict prognosis in breast cancer. Studies have shown that CA 15-3 and CA 125 can assess the prognosis in patients with breast cancer. A study by Li et al. found that high levels of CA 15-3 (>13U/mL) are related to metastasis-free survival and recurrence-free survival in patients with luminal-A
LDH is a key enzyme in the lactic acid metabolism pathway, and its activity is closely related to injury, inflammation, and tumor growth.
4
Previous studies have identified LDH as a prognostic factor for metastatic
There are a few limitations in the present study. First, it was a single-center retrospective study, and second, some other clinical features of
Conclusion
In summary, single tumor indicators have limitations as assessment methods for prognosis in
Supplemental Material
sj-pdf-1-ccx-10.1177_10732748211053150 – Supplemental Material for Prognostic Value of Combined Lactate Dehydrogenase, C-Reactive Protein, Cancer Antigen 153 and Cancer Antigen 125 in Metastatic Breast Cancer
Supplemental Material, sj-pdf-1-ccx-10.1177_10732748211053150 for Prognostic Value of Combined Lactate Dehydrogenase, C-Reactive Protein, Cancer Antigen 153 and Cancer Antigen 125 in Metastatic Breast Cancer by Yu-yuan Ma, Han Wang, Wei-dong Zhao, Yi-Fan Li, Jing-jing Wang, Xing-yu Chen, Yue-qing Huang, Wen-jie Wang, Ying Wang and Shi-Chang Sun in Cancer Control
Supplemental Material
sj-pdf-2-ccx-10.1177_10732748211053150 – Supplemental Material for Prognostic Value of Combined Lactate Dehydrogenase, C-Reactive Protein, Cancer Antigen 153 and Cancer Antigen 125 in Metastatic Breast Cancer
Supplemental Material, sj-pdf-2-ccx-10.1177_10732748211053150 for Prognostic Value of Combined Lactate Dehydrogenase, C-Reactive Protein, Cancer Antigen 153 and Cancer Antigen 125 in Metastatic Breast Cancer by Yu-yuan Ma, Han Wang, Wei-dong Zhao, Yi-Fan Li, Jing-jing Wang, Xing-yu Chen, Yue-qing Huang, Wen-jie Wang, Ying Wang and Shi-Chang Sun in Cancer Control
Footnotes
Acknowledgments
The authors express sincere gratitude to the support of the Science and Education for Health Foundation of Suzhou for Youth and Suzhou Oncology Clinical Center.
Author Contributions
YW and SCS contributed conception and design of the study; YFL, JJW, and YQH collect the data; XYC, WDZ, and WJW performed the statistical analysis; YYM and HW wrote the first draft of the article. All authors contributed to article revision, read, and approved the submitted version.
Declaration of Conflicting Interests
The author(s) declared no potential conflicts of interest with respect to the research, authorship, and/or publication of this article.
Funding
The author(s) disclosed receipt of the following financial support for the research, authorship, and/or publication of this article: This work was supported by the Science and Education for Health Foundation of Suzhou for Youth (grant no. kjxw2018032), Suzhou Oncology Clinical Center (Grant Numbers Szzx201506).
Ethics Statement
This work was approved by the Medical Ethics Committees of the Suzhou Municipal Hospital, Jining Cancer Hospital, and Yijishan Hospital of Wannan Medical College, and all patients or their relatives provided verbal informed consent after being told the significance of this study. The approval number of this study was KL901196, and the study was conducted in accordance with the Declaration of Helsinki.
Informed Consent
Verbal consent for publication was obtained from all participants.
Supplemental material
Supplemental material for this article is available online.
References
Supplementary Material
Please find the following supplemental material available below.
For Open Access articles published under a Creative Commons License, all supplemental material carries the same license as the article it is associated with.
For non-Open Access articles published, all supplemental material carries a non-exclusive license, and permission requests for re-use of supplemental material or any part of supplemental material shall be sent directly to the copyright owner as specified in the copyright notice associated with the article.