
Abstract
Background:
Increasing evidence indicated that the tumor microenvironment (TME) plays a critical role in tumor progression. This study aimed to identify and evaluate mRNA signature involved in lymph node metastasis (LNM) in TME for gastric cancer (GC).
Methods:
Gene expression and clinical data were downloaded from The Cancer Genome Atlas (TCGA). The ESTIMATE algorithm was used to evaluate the TME of GC. The heatmap and Venn plots were applied for visualizing and screening out intersect differentially expressed genes (DEGs) involved in LNM in TME. Functional enrichment analysis, gene set enrichment analysis (GSEA) and protein-protein interaction (PPI) network were also conducted. Furthermore, binary logistic regression analysis were employed to develop a 4-mRNAs signature for the LNM prediction. ROC curves were applied to validate the LNM predictive ability of the riskscore. Nomogram was constructed and calibration curve was plotted to verify the predictive power of nomogram.
Results:
A total of 88 LNM related DEGs were identified. Functional enrichment analysis and GSEA implied that those genes were associated with some biological processes, such as ion transportation, lipid metabolism and thiolester hydrolase activity. After univariate and multivariate logistic regression analysis, 4 mRNAs (RASSF2, MS4A2, ANKRD33B and ADH1B) were eventually screened out to develop a predictive model. ROC curves manifested the good performance of the 4-mRNAs signature. The proportion of patients with LNM in high-risk group was significantly higher than that in low-risk group. The C-index of nomogram from training and test cohorts were 0.865 and 0.765, and the nomogram was well calibrated.
Conclusions:
In general, we identified a 4-mRNAs signature that effectively predicted LNM in GC patients. Moreover, the 4-mRNAs signature and nomogram provide a guidance for the preoperative evaluation and postoperative treatment of GC patients.
Introduction
Gastric cancer (GC) is a common cancer with high morbidity and mortality, both worldwide and in China. 1,2 The time of diagnosis of GC is also getting earlier and earlier with the attention to health and the improvement of diagnostic techniques and levels. And lymph node metastasis (LNM), which occurs in about 60%-80% of GC patients, 3,4 is the key to diagnosis and staging of GC and plays an indicator role in the survival and prognosis of patients.
Preoperative evaluation of LNM by endoscopic ultrasound (EUS), CT, PET/CT and multi-detector row CT (MDCT) can effectively improve clinical staging. 5 -9 However, the diagnostic accuracy of EUS varies from operator to operator, ranging from 30% to 90% for N staging. In addition, sensitivity and specificity of EUS diagnosis for N staging range from 16.6% to 96.8% and 57.1% to 100%, respectively. 10 Besides, CT is a routine examination for preoperative evaluation of staging. The sensitivity and specificity of CT in the detection of LNM are 78% and 62%, respectively. However, PET/CT is also a detection measure. Comparing with CT, PET/CT has a relatively low detection rate with lower sensitivity (56%), but higher specificity (92%) in the detection of LNM. 11 Recently, MDCT is becoming a standard imaging modality for the staging of GC due to its superior spatial resolution. 8 In addition, although MDCT has sufficient predictive power to assess the status of lymph node involvement in serosa-invasive GC, its predictive power is very limited in non-serosa-invasive GC. 9 These detection methods are limited due to their sensitivity, specificity and unstable predictive accuracy. Although there are many ways to diagnose LNM, it is still difficult to accurately determine the status of lymph node involvement before surgery. Therefore, it is important to find a more objective and stable method to identify the status of LNM.
TME is a complex environmental conditions around the tumor, consisting of endothelial cells, cancer associated fibroblasts (CAFs), immune and inflammatory cells, mesenchymal cells, as well as the extracellular matrix (ECM). 12 The interaction between cells and microenvironment plays an important role in maintaining normal tissue homeostasis and tumor progression. 13 And various kinds of stromal cells were nested around the tumors, which promoted the growth and metastatic dissemination of tumors. However, tumor cells often disseminate to other microenvironments, such as lymph nodes and bone marrow, before metastasizing to future sites of metastasis. 14 Therefore, LNM is more likely to be a precursor of distant metastasis and an important indicator of tumor progression. However, the understanding of mechanism of the TME involved in LNM is far from enough. More recently, ESTIMATE algorithm is applied for the evaluation of TME in various tumors, such as acute myeloid leukemia (AML), 15 clear cell renal cell carcinoma (ccRCC) 16 and glioma. 17 Hence, we intend to apply this algorithm to evaluate and explore the connection between TME and LNM in GC.
In this article, the potential mechanisms involved in LNM in GC were revealed. More importantly, we identify a novel mRNAs signature associated with TME for LNM prediction and construct nomogram to predict the incidence of LNM before surgery in GC.
Material and Methods
The GC Patients Dataset and TME Scores Calculation
The gene transcriptome and clinical profiles of 343 stomach adenocarcinoma (STAD) patients from The Cancer Genome Atlas (TCGA) database were downloaded using GDC tool. And we processed the gene expression data and extracted corresponding clinical information, such as age, tumor grade, AJCC stage, TNM staging and AJCC stage. Only those patients with N staging and mRNA expression data were enrolled in the study. After excluding 16 patients with N staging deletion, the remaining GC patients were included (n = 327). Scores of immune, stromal and Estimate were calculated by ESTIMATE algorithm according to those patients mRNA expression.
Acquisition of Differentially Expressed Genes (DEGs), Heatmaps and Clustering Analysis
Those enrolled patients were divided into N− (without LNM, n = 102) and N+ (with LNM, n = 225) group based on N staging. Meanwhile, the GC patients were also divided into high- and low-score groups according to the median immune and stromal scores, respectively. The “limma” package was used for the standardization of transcriptome data. Then genes that differed between the N− and N+ groups and between the low- and high-score groups were also screened. In addition, the clustering analysis was applied to identify significant up and down gene sets between the subgroups of N staging. And heatmaps were plotted to illustrate the DEGs using “pheatmap” package.
Functional Enrichment Analysis and Protein-Protein Interaction (PPI) Network Construction
DEGs acquired from N staging were applied for functional enrichment analysis to explore potential LNM mechanism. And cellular components (CC), and molecular functions (MF) of Gene Ontology (GO) analysis were performed using “clusterProfiler,” “org.Hs.eg.db,” “enrichplot,” and “ggplot2” R packages. Besides, Kyoto Encyclopedia of Genes and Genomes (KEGG) pathway analysis was conducted based on the same packages as GO analysis. At the same time, the STRING database were used to construct the PPI network based on DEGs with medium confidence (0.400).
Gene Set Enrichment Analysis (GSEA)
To further explore the underlying mechanisms involved in LNM, GSEA was employed to assess the related pathways and molecular mechanisms in GC. The gene sets with |NES| >1.5, P-value <0.05 and false discovery rate (FDR) <0.35 were considered statistically significant.
Acquisition of Intersect Genes, Logistic Regression Analysis and ROC Curves
The intersect genes between DEGs based on N staging, stromal and immune scores were identified and visualized using “VennDiagram” package. The relationship between intersect genes and LNM was determined by univariate logistic regression analysis and those mRNAs with P < 0.05 were considered as closely related to LNM and applied for further multivariate logistic regression analysis. Subsequently, a formula was built to calculate the riskscore for each patient based on the expression level of mRNAs (Expi) and the coefficients (Coei). The ROC analysis was used to compare the predictive ability of riskscore and those mRNAs with P < 0.05 in multivariate logistic regression.

Nomogram Model Construction
The RASSF2, MS4A2, ANKRD33B and ADH1B were used to construct a nomogram model using “rms” R package based on training cohort. Calibration curves were applied to evaluate the consistency of the status of LNM between the prediction model and actual status for training and test cohorts. And C index was also calculated to assess the predictive power for both training and test cohorts.
Statistical Analysis
IBM SPSS Statistics software (version 23.0) was applied for statistical analysis. Chi-square test and Fisher’s exact test was applied for categorical variables, and Student’s t-test was applied for continuous variables. R software (version 4.0.2) was used to construct nomogram. And P < 0.05 represented as statistically significant.
Results
Baseline Characteristics of Training and Test Cohorts of TCGA STAD Patients
The flowchart describing the entire process of this study was shown in Figure 1. We downloaded clinical information of 343 STAD patients from TCGA. Then 327 STAD patients with N staging information were included (16 were excluded, including 2 with N staging missing, 14 with Nx) and grouped into training (n = 163) and test (n = 164) cohort randomly. Eventually, after excluding those patients with missing clinical information, baseline characteristics were summarized for patients in training (n = 144) and test (n = 151) cohorts (Table 1). There were no significant differences in age, gender, grade, AJCC stage and TNM staging.

The flowchart of identifying the 4-mRNAs signature and construction and validation of the nomogram for lymph node metastasis.
The Baseline Characteristics of Training and Test Cohorts.

Subsequently, each cohort was divided into N− and N+ groups according to the status of LNM. As shown in Table 2, in the training cohort, there were no significant differences in age, gender and grade between N− (n = 52) and N+ (n = 92) groups. However, LNM is closely related to AJCC staging (P < 0.001), depth of tumor invasion (P = 0.001), and distant metastasis (P = 0.049). The proportion of stage I/II GC patients in the N− group (98.1%) was significantly higher than that in the N+ group (23.9%), and the proportion of stage III/IV GC patients in the N− group (1.9%) was significantly lower than that in the N+ group (76.1%). Moreover, the proportion of T1 GC patients in the N− group (9.6%) was significantly higher than that in the N+ group (1.1%), while the proportion of T2-4 GC patients in the N− group (90.4%) was significantly lower than that in the N+ group (98.9%). Besides, comparing with N− group, patients in N+ group were more likely to develop distant metastasis (7.6% vs. 0.0%). And similar results were observed in the test cohort. There were no significant differences in age, gender and grade between the N− (n = 42) and N+ (n = 109) groups. Comparing with N− group, the proportion of stage I/II GC patients in the N+ group was significantly lower (23.9% vs. 90.5%), while the proportion of stage III/IV GC patients in the N+ group was significantly higher (76.1% vs. 9.5%). And the proportion of T1 GC patients in the N− group (19.0%) was significantly higher than that in the N+ group (1.8%), while the proportion of T2-4 GC patients in the N− group (81.0%) was significantly lower than that in the N+ group (98.2%). Although, there was no statistical difference in M stage between the N− and N+ groups (P = 0.113). However, the proportion of M1 patients in N+ group (11.0%) was still higher than that in N− group (2.4%).
The Baseline Characteristics of N− and N+ Groups From Training and Test Cohorts.

DEGs Between N− and N+ Groups, Functional Enrichment Analysis and PPI Network
Those patients were grouped into N− and N+ groups according to the status of LNM. The heatmap were shown in Figure 2. A total of 88 DEGs were identified with log2|Fold Change| >0.5 and P-value <0.05 and applied for further functional enrichment analysis.
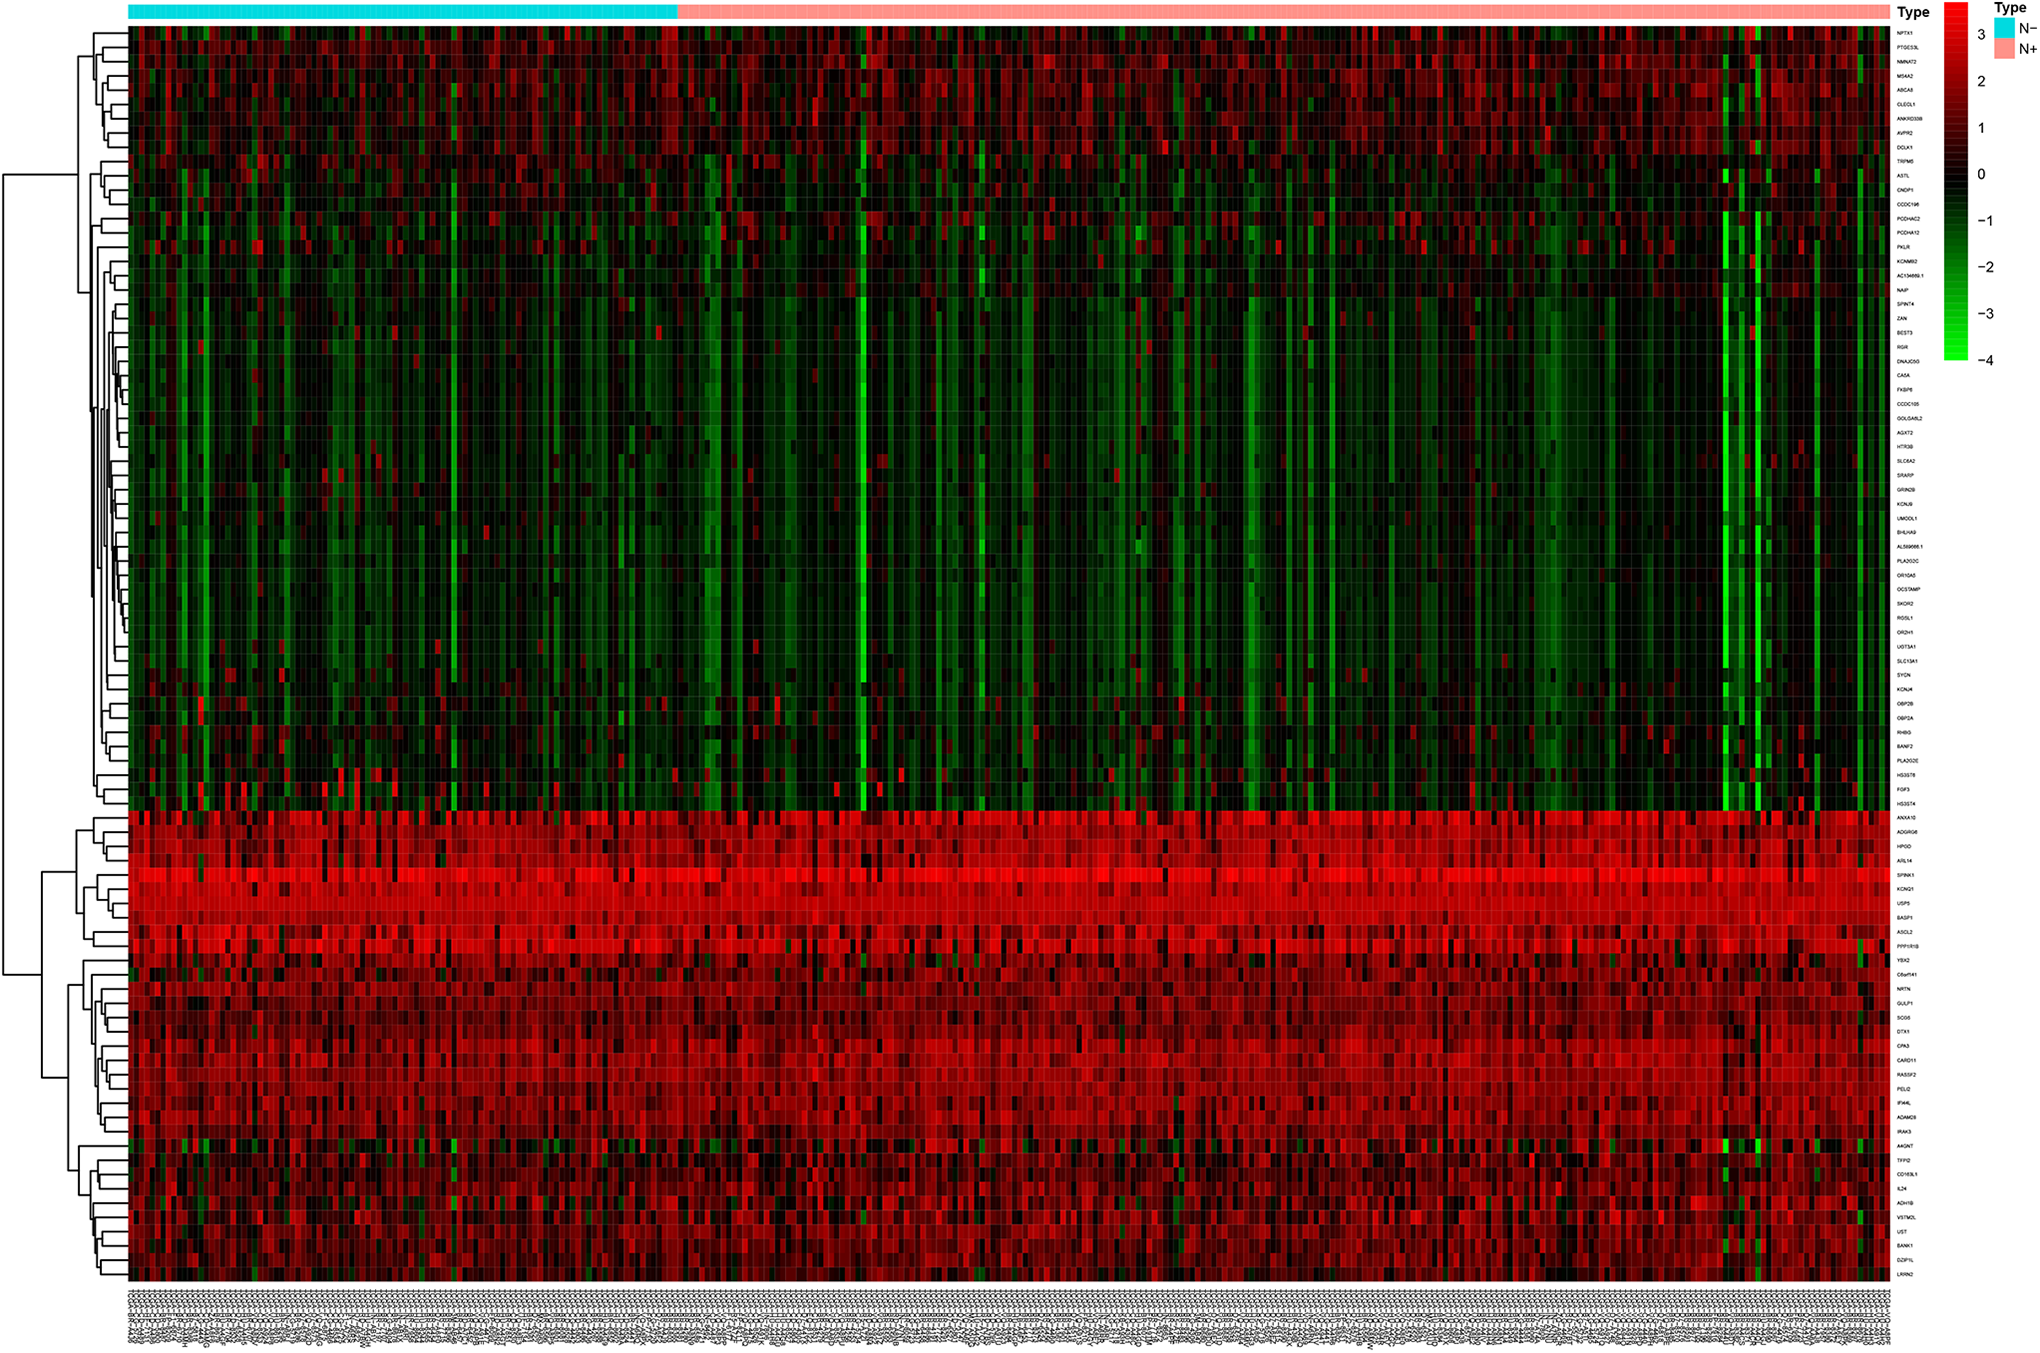
Comparison of gene expression profiles with the status of lymph node metastasis in GC. Heatmap was used to visualize differential expressed genes. N− indicates GC patients without lymph node metastasis; N+, GC patients with lymph node metastasis.
And 2 GO terms in CC and top 10 GO terms in MF were screened out (Figure 3A and B). For CC, those DEGs were only enriched 2 GO terms, including cation channel complex and basolateral plasma membrane (Figure 3A). Cation transmembrane transporter activity, metal ion transmembrane transporter activity and inorganic cation transmembrane transporter activity were top GO terms in MF (Figure 3B). In the KEGG pathway enrichment analysis, the top 9 pathways were shown in Figure 3C. Among them, pancreatic secretion, alpha-linolenic acid metabolism as well as linolenic acid metabolism were top KEGG pathways which 88 DEGs might be involved in. And PPI network was constructed based on 88 DEGs (Figure 3D).

Functional enrichment analysis, PPI network and identification of intersect genes. Two GO terms in CC (A), and top 10 GO terms in MF (B) were performed for functional enrichment clustering analysis and visualized as bar chart. Top 9 KEGG pathways were identified and visualized as bar chart (C). Protein-protein interaction network was constructed (D). Venn plots were performed to visualize the number of up-regulated (E) and down-regulated intersect genes (F) in tumor microenvironment. GO indicates gene ontology; CC, cellular components; MF, molecular functions; KEGG, kyoto encyclopedia of genes and genomes.
GSEA
To further improve and supplement the results of functional enrichment analysis, GSEA was employed. The results of GSEA revealed that the DEGs were significantly enriched in 2 KEGG pathways and 1 GO term negatively related to LNM (Figure S1). In the GO analysis, those DEGs were only enriched in thiolester hydrolase activity (Figure S1A). And in the KEGG analysis, those DEGs were enriched in 2 KEGG pathways, such as glyoxylate and dicarboxylate metabolism (Figure S1B) and peroxisome (Figure S1C).
DEGs Analysis in Stromal Scores and Immune Scores and Acquisition of Intersect Genes
A total of 327 patients with GC from TCGA database were enrolled. The ESTIMATE algorithm was used to calculate stromal, immune scores. Then those STAD patients were divided into low- and high-group according to the median stromal and immune scores, respectively. In immune score groups, 853 highly expressed and 321 lowly expressed genes were identified from DEGs analysis (Figure 3E and F). Meanwhile, 1513 upregulated genes and 218 downregulated genes were identified from stromal score groups (Figure 3E and F). The Venn diagram was applied to distinguish 9 intersect genes between the LNM related DEGs and upregulated genes of immune and stromal scores (Figure 3E). Besides, 4 intersect genes between the LNM related DEGs and downregulated genes of immune and stromal scores were also identified (Figure 3F). Therefore, a total of 13 intersect genes were identified.
Generation of 4-mRNAs Signature
Univariate analysis was performed to analyze the intersect mRNAs expression and the status of LNM of each patient from training cohort to identify the LNM-related mRNAs. A total of 9 mRNAs significantly correlated with LNM (P < 0.05) were screened out and applied for further multivariate logistic regression analysis. Subsequently, 4 mRNAs (RASSF2, MS4A2, ANKRD33B and ADH1B) were singled out to construct a predictive model (Table 3). A riskscore analysis of the 4 mRNAs to calculate the riskscore for each patient based on the coefficients and expression level of the 4 mRNAs. Riskscore = 1.820 * RASSF2 − 1.252 * MS4A2 − 1.351 * ANKRD33B + 0.546 * ADH1B. Among these mRNAs, 2 mRNAs with positive coefficients, including RASSF2 and ADH1B, which indicated that higher expression level of the 2 mRNAs was associated with higher risk of LNM. Meanwhile, the coefficients of the other 2 mRNAs (MS4A2 and ANKRD33B) were negative, which implied that higher expression level was associated with lower risk of LNM.
Summary of Univariate and Multivariate Logistic Regression Analysis.

Validation of the Validity of the 4-mRNAs Signature to Predict LNM
The riskscore for each patient of the training and test cohort was calculated. ROC curves were applied to determine the sensitivity and specificity of the 4-mRNAs signature and each mRNA. As depicted in Figure 4A, the AUC value of the 4-mRNAs signature was 0.800 in the training cohort which was significantly higher than that of each mRNA (RASSF2, 0.723; MS4A2, 0.606; ANKRD33B, 0.596; ADH1B, 0.707). The results indicated that the 4-mRNAs signature had good sensitivity and specificity for predicting LNM. The cutoff value was 1.016 which was determined by the ROC curve of training cohort. Then the training cohort was divided into low- (n = 69) and high-risk (n = 94) groups according to the cutoff value. As shown in Figure 4B, the distribution of riskscore in training cohort was plotted. Moreover, the proportion of patients with LNM in the low-risk group was significantly lower than high-risk group (P < 0.001, Figure 4C).

ROC curves, riskscore distribution and lymph node metastasis data of the training and test cohorts. ROC curves, riskscore distribution and the proportions of GC patients with lymph node metastasis in training cohort (A-C). ROC curves, riskscore distribution and the proportions of GC patients with lymph node metastasis in test cohort (D-F). LNM indicates lymph node metastasis.
To validate the predictive ability of the 4-mRNAs signature, ROC curves were also plotted to calculate the AUC value for test cohort. The AUC values of the 4-mRNAs signature in test cohorts were 0.742 (Figure 4D). And AUC values of the 4-mRNAs signature was higher than each mRNA in test cohort (Figure 4D). In addition, the test cohort was also grouped into low- (n = 92) and high-risk (n = 72) groups based on the same cutoff value. The distribution of riskscore in test cohort was also plotted (Figure 4E). And the proportion of patients with LNM in the high-risk group was significant higher than low-risk group (P < 0.001, Figure 4F).
Nomogram Model Construction and Prediction
To facilitate the 4-mRNAs signature application in clinical practice, nomogram was constructed based on training cohort (Figure 5A). A nomogram-based score is calculated for each patient based on 4 mRNAs on the point scale. The calibration curves of training (Figure 5B) and test cohorts (Figure 5C) imply that the nomogram model exhibits excellent performance for predicting LNM. The C-index of training and test cohorts were 0.856 and 0.756, respectively.

Construction and validation of nomogram. (A) The nomogram was constructed based on the training cohort. Calibration curves of the nomogram in the training (B) and test (C) cohorts.
Discussions
The prognosis of GC patients was evaluated mainly based on the TNM staging system. Among the TNM staging system, LNM is an important indicator. Moreover, the status of LNM is also vital to confirm the treatment regimens for GC. Hence, the identification of LNM-related biomarkers is beneficial to explore the underlying mechanisms involved in LNM and improve the prognosis of GC patients with lymph node involvement.
Combining the results of functional enrichment analysis and GSEA, we found that LNM is closely related to ion transport and some metabolic processes. Studies have shown that transient receptor potential vanilloid 2 (TRPV2), a member of transient receptor potential (TRP) Ca2+ permeable channels, has shown carcinogenic activity in various cancers, 18 such as breast cancer, 19 esophageal squamous cell carcinoma, 20,21 hepatocarcinoma 22 -24 and hematologic malignancies, 25 -27 by controlling proliferation, migration, angiogenesis, and invasion. Moreover, according to the GO result of GSEA, thiolester hydrolase activity is negatively associated with LNM. And thiolester hydrolase can catalyze the hydrolysis of thioester bonds which can be found in acetyl-coenzyme A. Importantly, acetyl-coenzyme A is an important intermediate metabolite of 3 nutrients such as glucose, fat and protein, and it can finally produce a large amount of energy through the tricarboxylic acid (TCA) cycle which is beneficial to the metastasis of tumor. 28 In addition, pancreatic secretion, fat digestion and absorption and alpha-liolenic acid metabolism were top terms in the KEGG pathways analysis. Herein, lipid metabolism may be involved in LNM of GC. Fatty acids are closely related to lipid metabolism in cancer, and the balance between the omega-3 and omega-6 families plays an important role in tumor metastasis. 29 Therefore, we suggested that LNM of GC was related to ion transmembrane transport, lipid metabolism and the decreased activity of thiolester hydrolase.
At present, the traditional diagnostic methods for LNM, such as EUS, CT, PET/CT and MDCT are subjective in some extent and have limited sensitivity, specificity and accuracy. Thus, we tried to build a prediction model based on gene expression level, which was quantifiable and more objective. We identified a 4-mRNAs signature with good predictive power for LNM in both training and test cohorts. The accuracy, sensitivity and specificity of the 4-mRNAs signature in training cohort were 80.0%, 73.2% and 76.5%, respectively. In test cohort, the accuracy, sensitivity and specificity of that were 74.2%, 61.1% and 84.3%, respectively. It has high accuracy in both training and test cohorts, indicating that the model has high stability in predicting LNM. To further elucidate the discriminate power of this model, patients were classified into low- and high-risk group based on the cutoff value of the riskscore for both training and test cohort. In both the training and test cohorts, the proportion of patients with LNM in the high-risk group was significantly higher than that in the low-risk group, and the proportion of patients with no LNM was significantly lower. According to the published articles, we found that the sensitivity and specificity of CT for lymph node involvement were 78% and 62%, respectively. The Youden index of CT is 0.400. However, according to our data results, in the training cohort, the sensitivity and specificity of the 4-mRNAs signature constructed by us are 73.2% and 76.8%, respectively. And the sensitivity and specificity of that in test cohort are 61.1% and 84.3%, respectively. And the Youden index of 4-mRNAs signature in training and test cohorts are 0.500 and 0.454, respectively. Obviously, the Youden index of 4-mRNAs signature is significantly higher than that of CT in both cohorts. Besides, the ability of MDCT to assess LNM in GC has also been recognized in recent years. And the AUC value of the LNM detection with MDCT in advanced GC is 74.4%, which is slightly lower than the 80.0% of the training cohort and similar to the 74.2% of the test cohort from the present study. According to another published articles, due to the low sensitivity (0.34), MDCT is insufficient for the detection of LNM in early GC. Therefore, we have reason to believe that this 4-mRNAs signature is not inferior or even superior to CT and MDCT.
To facilitate further clinical application, nomograms were constructed and calibrated. The C-index of training and test cohorts were 0.865 and 0.765, respectively. Furthermore, the calibration curves of training and test cohorts indicated that the nomogram was well calibrated. Nomograms were widely used to predict LNM of GC. However, there are some limitations to the application value as some factors are only available postoperatively. In this study, we applied the expression level of 4 mRNAs to predict LNM which could be obtained preoperatively. Moreover, compared with CT, the detection of the 4 mRNAs is simpler and radiation-free, which greatly saves the examination time of patients and brings them more convenience. However, this study has also some limitations. Firstly, the 4-mRNAs signature and nomogram were only constructed and validated in TCGA database. Secondly, this study did not directly compare the accuracy of the 4-mRNAs model and CT in the diagnosis of LNM in the same population. In the future, we will compare the predictive ability of the 4-mRNAs model with CT for LNM in our department, and evaluate whether the combination of the 2 can improve the accuracy in predicting LNM.
Conclusions
In conclusion, we found that ion transmembrane transporter activity, lipid metabolism and thiolester hydrolase activity are closely related to LNM in GC. Besides, 4 LNM-related genes in TME were identified and applied for the construction of prediction model and nomogram. More importantly, the prediction model and nomogram can accurately predict LNM in preoperative and provide some reference for the evaluation of GC and the formulation of clinical treatment regimens.
Supplemental Material
Supplemental Material, sj-tif-1-ccx-10.1177_10732748211027160 - Construction and Validation of a Nomogram for the Preoperative Prediction of Lymph Node Metastasis in Gastric Cancer
Supplemental Material, sj-tif-1-ccx-10.1177_10732748211027160 for Construction and Validation of a Nomogram for the Preoperative Prediction of Lymph Node Metastasis in Gastric Cancer by Shilong Li, Zongxian Zhao, Huaxiang Yang, Daohan Wang, Weilin Sun, Shuliang Li, Zhaoxiong Zhang and Weihua Fu in Cancer Control
Footnotes
Abbreviations
Authors’ Note
Shilong Li and Zongxian Zhao contributed equally to this article.
Declaration of Conflicting Interests
The author(s) declared no potential conflicts of interest with respect to the research, authorship, and/or publication of this article.
Funding
The author(s) received no financial support for the research, authorship, and/or publication of this article.
Supplemental Material
Supplemental material for this article is available online.
References
Supplementary Material
Please find the following supplemental material available below.
For Open Access articles published under a Creative Commons License, all supplemental material carries the same license as the article it is associated with.
For non-Open Access articles published, all supplemental material carries a non-exclusive license, and permission requests for re-use of supplemental material or any part of supplemental material shall be sent directly to the copyright owner as specified in the copyright notice associated with the article.