
Abstract
TLC388, a camptothecin-derivative targeting topoisomerase I, is a potential anticancer drug. In this study, its effect on A549 and H838 human non-small cell lung cancer (NSCLC) cells was investigated. Cell viability and proliferation were determined by thiazolyl blue tetrazolium bromide and clonogenic assays, respectively, and cell cycle analysis and detection of phosphorylated histone H3 (Ser10) were performed by flow cytometry. γ-H2AX protein; G2/M phase-associated molecules ataxia-telangiectasia mutated (ATM), CHK1, CHK2, CDC25C, CDC2, and cyclin B1; and apoptosis were assessed with immunofluorescence staining, immunoblotting, and an annexin V assay, respectively. The effect of co-treatment with CHIR124 (a checkpoint kinase 1 [CHK1] inhibitor) was also studied. TLC388 decreased the viability and proliferation of cells of both NSCLC lines in a dose-dependent manner. TLC388 inhibited the viability of NSCLC cell lines with an estimated concentration of 50% inhibition (IC50), which was 4.4 and 4.1 μM for A549 and H838 cells, respectively, after 24 hours. Moreover, it resulted in the accumulation of cells at the G2/M phase and increased γ-H2AX levels in A549 cells. Levels of the G2 phase–related molecules phosphorylated ATM, CHK1, CHK2, CDC25C, and cyclin B1 were increased in TLC388-treated cells. CHIR124 enhanced the cytotoxicity of TLC388 toward A549 and H838 cells and induced apoptosis of the former. TLC388 inhibits NSCLC cell growth by inflicting DNA damage and activating G2/M checkpoint proteins that trigger G2 phase cell cycle arrest to enable DNA repair. CHIR124 enhanced the cytotoxic effect of TLC388 and induced apoptosis.
Keywords
Introduction
Camptothecin (CPT) is a cytotoxic alkaloid that was first isolated from the bark of Camptotheca acuminate, a tree native to China. 1 Camptothecin has been shown to exert a strong antitumor effect by targeting DNA topoisomerase I (TOP1) to stabilize DNA-TOP1 complexes, thereby inhibiting DNA religation and inducing DNA double-strand breaks (DSBs) and cytotoxicity. 2 The anticancer drugs, topotecan and irinotecan, are 2 of the most commonly used CPT derivatives, developed and approved by the US Food and Drug Administration in the 1990s. 3 Topotecan has been approved for the treatment of ovarian cancer, small cell lung cancer, 4 and cervical cancer, 5 whereas irinotecan has been used to treat colorectal cancer. 6 Many topotecan clinical trials, mostly phase I/II, were conducted and have shown some promising activity in the treatment of advanced non-small cell lung cancer (NSCLC). 7 Despite its clinical efficacy, the tissue toxicity of CPT derivatives remains a critical concern. 8 The antitumor activity of CPT is generally attributed to its lactone E-ring. 3 However, the intrinsic instability of the lactone E-ring, and associated formation of an inactive ring-opened carboxylate, is a common feature of all existing CPT derivatives. 9 The opening of this ring not only leads to reduced potency but also causes increased toxicity on normal tissues. 3
TLC388 (Lipotecan, Taiwan Liposome Company, Ltd, Taipei, Taiwan), a second-generation CPT derivative with higher efficacy and lower toxicity, is a potential anticancer drug that has been developed to overcome the problems associated with lactone E-ring instability. 3 In vitro, TLC388 has been shown to function as a chemo- and radio-sensitizing drug by enhancing DNA DSBs and inhibiting DNA repair. 3 Moreover, a phase I study of TLC388 has demonstrated that it is safe and well tolerated to be used to treat advanced solid tumours. 10 Phase II studies of TLC388 treatment of solid tumors, including renal cell carcinoma, hepatocellular carcinoma, and colorectal carcinoma, are also ongoing. The present study was designed to examine the antitumor effect of TLC388 using A549 and H838 human NSCLC cells and investigate the possible regulatory mechanisms responsible for its antitumor effects.
Material and Methods
Materials and Cell Culture
TLC388 was kindly provided by the Taiwan Liposome Company, Ltd (Taipei, Taiwan) as a lyophilized powder. TLC388 was dissolved in dimethyl sulfoxide (DMSO) and stored as a stock solution at −20°C. Cells of 2 human NSCLC lines, A549 (CCL-185) and H838 (CRL-5844), were purchased from the American Type Culture Collection (Manassas, Virginia), as were nontumorigenic human bronchial epithelial cells of line NL20 (CRL-2503). The cancer cells were cultured in RPMI-1640 medium (GIBCO, Grand Island, New York) supplemented with sodium pyruvate (1 mM), minimum essential medium nonessential amino acids (1%), and heat-inactivated fetal bovine serum (FBS; 10%) at 37°C in a humidified incubator containing CO2 (5%) to maintain exponential growth. The human bronchial epithelial cells were cultured in Ham’s F-12 medium (Sigma-Aldrich, St Louis, Missouri) supplemented with sodium bicarbonate (1.5 g/L), glucose (2.7 g/L),
Cell Viability
Cells were treated with various concentrations of TLC388 (0, 0.01, 0.1, 1.0, 10 μM), with or without CHIR124 (0, 0.1, 1.0, 10 μM) and their viability was assessed with a thiazolyl blue tetrazolium bromide (MTT) assay. Briefly, MTT (1 mg/mL) was added to the culture medium and the cells were incubated at 37°C in an atmosphere containing CO2 (5%) for 4 hours. An equal volume of DMSO was then added to dissolve the formazan crystals inside viable cells, and absorbance at 570 nm was measured using a microplate reader as described previously. 11 All measurements were performed at least 3 experiments. IC50 values were calculated with SigmaPlot software version 10 (Systat Software, Inc, San Jose, California).
Colony Formation Assay
Viable tumor cells (102) were plated in a 35-mm culture dish and cultured in RPMI-1640 medium containing heat-inactivated FBS (10%) at 37°C for 24 hours in a humidified incubator containing CO2 (5%) before drug administration. The medium was removed 1 day after the addition of various concentrations of TLC388 (0, 0.01, 0.025, 0.05, 0.075, and 0.1 μM). After 10 to 14 days, the dishes were stained with crystal violet, and colonies comprising more than 50 cells were counted as described. 12 The surviving fraction was calculated as follows: mean number of colonies/(cells inoculated × control plating efficiency). The control plating efficiency for A549 and H838 cells was approximately 92 and 67%, respectively.
Cell Morphology
The morphology of A549 and H838 cells with and without treatment was observed after exposure to Liu’s stain (Muto Pure Chemicals Co Ltd, Bunkyou-Ku, Tokyo, Japan) as previous study. 13 Liu A solution was added for 45 seconds, followed by adding Liu B solution for 90 seconds at room temperature. Cells were then gently washed and dried. Micrographs were taken by ×200 (Figure 1B) or ×400 (Figure 5B) with a BX51 light microscope (Olympus, Tokyo, Japan).

The viability, morphology, and topoisomerase I expression in TLC388-treated cells. A, The viability of A549 and H838 cells was reduced by exposure to TLC388 for 24 hours in a dose-dependent manner, as demonstrated by a thiazolyl blue tetrazolium bromide (MTT) assay. TLC388 was less toxic to NL20 cells than A549 and H838 cells. The results are means ± standard deviations from 3 independent experiments. B, Morphology of A549 and H838 non-small cell lung cancer cells treated with TLC388 for 24 hours. Morphological alterations and disrupted cell structure were observed (Liu’s stain). C, TLC388 (0.1 and 1.0 μM) administration for 24 hours inhibited topoisomerase I expression in A549 and H838 lung cancer cells. CPT indicates camptothecin, a positive control; NC, negative control; TOP1, topoisomerase I.
Immunofluorescence Staining
Analysis of immunofluorescence staining was conducted as previously described. 14 Briefly, cells were seeded on a 96-well plate with 1 × 10⁴ cells/well. After treatment with TLC388 (1 μM) or CPT (1 μM), the cells were fixed with 4% paraformaldehyde, permeabilized with TritonX-100 (1%), and blocked with FBS (5%) in phosphate-buffered saline (PBS) for 1 hour. The cells were then incubated with a primary antibody against γ-H2AX (diluted 1:400; Cell Signaling Technology, Danvers, Massachusetts) overnight at 4°C. After washing, the cells were exposed to a tetramethylrhodamine isothiocyanate–conjugated secondary antibody (diluted 1:200; Jackson ImmunoResearch, West Grove, Pennsylvania), washed, and incubated in the dark with Hoechst 33258 (Sigma-Aldrich) for 10 minutes to stain nucleus. The results were observed and photographed under ImageXpress Micro 4 microscope (Molecular Devices, San Jose, California). The fluorescence intensity of foci was calculated and plotted using MetaXpress software version 6.5.2.351 (Molecular Devices).
Western Blot Analysis
Protein was extracted from the cells with lysis buffer (Cell Signaling Technology) at 4°C and quantified using a bicinchoninic acid protein assay kit (Bio-Rad Laboratories, Hercules, California). Proteins were separated by sodium dodecyl sulfate-polyacrylamide gel electrophoresis on an 8% to 15% gel and transferred to polyvinylidene fluoride membranes. Primary antibodies against various proteins, including TOP1 (GeneTex, Irvine, California), nonphosphorylated and phosphorylated forms of ataxia-telangiectasia mutated (ATM), cyclin B1, CDC2 (Cell Signaling Technology), CHK1 (Ser 317; MBL International Corporation, Woburn, Massachusetts), phosphorylated CHK1 (Ser 317; Cell Signaling Technology), CHK2 (Cell Signaling Technology), phosphorylated CHK2 (GeneTex), CDC25C (GeneTex), phosphorylated CDC25C (Cell Signaling Technology), phosphorylated histone H3 (Ser10; Cell Signaling Technology), γ-H2AX (Ser139; Cell Signaling Technology), TBP (GeneTex), procaspase 3 (GeneTex), and β-actin (Millipore, Burlington, MA), were used after having been diluted, and their binding was detected using a horseradish peroxidase–conjugated goat anti-rabbit immunoglobulin G antibody (Jackson ImmunoResearch), followed by enhanced chemiluminescence reagents. The results were analyzed with a Fusion FX7 chemiluminescence imaging system (Vilber Lourmat, Eberhardzell, Germany). Antibodies against actin and TBP (TATA-binding protein), as internal controls, were also used. Western blot analysis was performed as mentioned previously. 13
Cell Cycle Analysis by Flow Cytometry
Untreated cells and cells treated with TLC388 (0.1 μM) and/or CHIR124 (0.1 and 1.0 μM) were harvested and washed with PBS, before being fixed and permeabilized at 4°C with ethanol (70%) for 1 hour. The cells were then incubated with Triton X-100 (1%), RNase (3.0 mg/mL), and propidium iodide (PI, 0.1 mg/mL; Sigma-Aldrich) in the dark. Data were acquired from 104 cells, and cell cycle analysis was performed with a FACSCalibur flow cytometer (Becton Dickinson, Lincoln Park, New Jersey) as described previously. 15 ModFit software (Becton Dickinson) was used to calculate the proportion of cells in different phases.
Propidium Iodide and p-Histone H3 Staining
Staining with a p-histone H3 (Ser10) antibody and PI was used to estimate the proportion of mitotic cells as previous study. 13 Drug-treated cells with TLC388 (0.1 μM) were washed with PBS and subsequently fixed with paraformaldehyde (4%) at 4°C for 1 hour. The cells were then washed with FBS (1%) in PBS, incubated with Triton X-100 (1%) at 37°C for 30 minutes and exposed to an anti-p-histone H3 (Ser10) antibody (Cell Signaling Technology) at room temperature for 30 minutes. The cells were washed, before being stained in the dark with PI for 10 minutes. Data from 104 cells were collected and analyzed with a FACSCalibur flow cytometer. The proportion of mitotic cells was calculated using CellQuest Pro software (Becton Dickinson).
Analysis of Apoptosis by Annexin V and PI Staining and TUNEL Assay
Analysis of apoptosis by annexin V and PI staining was performed as described previously. 16 Cells were stained with fluorescein isothiocyanate (FITC)–conjugated annexin V and PI (TACS Annexin V-FITC Kit; Trevigen, Inc, Gaithersburg, Maryland) for assessment of apoptosis. Drug-treated cells with TLC388 (0.1 μM), CHIR124 (0.5 μM), or both were washed with PBS, then resuspended in Annexin V Binding Buffer (100 μL) containing FITC-conjugated annexin V (5 μL), and incubated in the dark for 15 minutes at room temperature. Cells suspended in binding buffer (200 μL) containing PI (0.1 μL) were filtered and kept at 4°C before flow cytometry analysis. Data from 104 cells were analyzed with CellQuest Pro software to calculate the proportion of cells in early and late apoptosis.
Terminal deoxynucleotidyl transferase (TdT) dUTP Nick-End Labeling (TUNEL) assay was performed according to manufacturer’s instructions. Briefly, cells were treated with TLC388 (0.1 μM), CHIR124 (1.0 μM), or both for 48 hours and the extent of DNA fragmentation was determined by flow cytometric analysis. In Situ Cell Death Detection Kit, Fluorescein (Sigma-Aldrich) was used for the experiment and fluorescein dUTP was incorporated at DNA strand breaks of apoptotic cells. The extent of DNA fragmentation was analyzed by CellQuest software.
Statistical Analysis
Results are expressed as the means ± standard deviations from at least 4 separate experiments. Student t test was used if the data passed both the normality test (Shapiro-Wilk) and equal variance test; otherwise, the Mann-Whitney U rank-sum test was employed. P for trend was analyzed by 1-way analysis of variance test. Differences were considered significant when associated with a P value of less than .05. All data analysis was carried out using SigmaPlot software version 10 (Systat Software, Inc, San Jose, California) and IBM SPSS Statistics 24 (IBMCorporation, Armonk, New York).
Results
TLC388 Inhibited Cell Growth and Induced Morphological Alternation on Both A549 and H838 Cells
The thiazolyl blue tetrazolium bromide (MTT) assay revealed that the viability of A549 and H838 cells was reduced by TLC388 in a dose-dependent manner (Figure 1A). Its half-maximal inhibitory concentration (IC50) was estimated to be 4.4 and 4.1 μM for A549 and H838 cells, respectively, after 24 hours. TLC388 was less toxic toward NL20 human bronchial epithelial cells than A549 and H838 cells. TLC388 induced morphological alterations and disrupted cell structure (Figure 1B).
TLC388 Reduced TOP1 Protein Expression Level in Non-Small Cell Lung Carcinoma
Western blot analysis showed that TOP1 protein expression in A549 and H838 cells was decreased following treatment with 1.0 μM TLC388 for 24 hours, suggesting that this drug reduced TOP1 expression in these lung cancer cells (Figure 1C).
TLC388 Inhibited A549 and H838 Cell Proliferation
Colony formation by A549 and H838 cells decreased in a TLC388 dose-dependent manner (Figure 2A and B), indicating that this drug inhibited the proliferation of NSCLC cells.

Colony formation and cell cycle analysis in TLC388-treated NSCLC cells. A, Colony formation by A549 and H838 cells treated with TLC388 for 24 hours decreased in a dose-dependent manner. B, Colony formation assay of A549 and H838 cells treated with TLC388 for 24 hours. The control (NC) plating efficiency for A549 and H838 cells was approximately 92% and 67%, respectively. The results are means ± standard deviations from 3 independent experiments. C, DNA histograms (upper panels) after 1 day of culture for A549 cells in the control and TLC388 (0.1 μM) treatment groups. Cell cycle analysis (lower panel) of A549 cancer cells treated with TLC388 for 24 hours. The proportion of cells arrested in the G2/M phase after 24 hours was 5-fold higher in the TLC388 (0.1 μM) treatment group than the control (NC) group. * P < .05, control versus TLC388 (0.1 μM). The results are means ± standard deviations from 5 independent experiments. D, A phosphorylated histone H3 (Ser 10) assay revealed that the proportion of mitotic A549 (upper panels) and H838 (lower panels) cancer cells was not increased after TLC388 treatment for 24 hours. Left panels: control; middle panels: TLC388 (0.1 μM); right panels: nocodazole treatment for 16 hours (0.1 μM; positive control). Percentages indicate the proportions of mitotic cells. NC indicates negative control; NSCLC, non-small cell lung cancer.
TLC388 Induced Cell Cycle Arrest at G2 Phase in A549 Cells
TLC388 treatment for 24 hours resulted in the arrest of A549 cells in the G2/M phase, as demonstrated by flow cytometry (Figure 2C). Compared with the control group, a 5-fold increase in the number of cells arrested at the G2/M phase was noted after 24 hours of treatment (Figure 2C). The cells were subjected to a phosphorylated (p-) histone H3 (Ser10) assay, which showed that the proportion of those undergoing mitosis was not increased after TLC388 treatment, indicating cell cycle arrest in the G2 phase (Figure 2D).
TLC388 Induced γ-H2AX Elevation in A549 Cells
To determine whether TLC388 induced DNA damage, phosphorylation of histone H2AX at Ser139 (resulting in γ-H2AX, a marker of DSBs) was monitored by immunofluorescence staining. Levels of γ-H2AX protein in A549 cancer cells increased in a time-dependent manner during treatment with TLC388 (Figure 3A). Nuclear γ-H2AX foci were visible but faint after exposure to 1.0 μM TLC388 for 30 minutes and could be clearly distinguishable following 1 hour of treatment. Treated A549 cells exhibited γ-H2AX foci up to 24 hours, demonstrating DNA damage and persistent DNA repair (Figure 3B). Levels of γ-H2AX protein expression exhibited similar results when treated A549 cells with CPT 1.0 μM (Figure 3A and B).

Immunofluorescence staining and molecular events of TLC388-treated A549 cancer cells. A, Levels of γ-H2AX protein in A549 cancer cells increased in a time-dependent manner during treatment with TLC388 (1 μM) and CPT (1 μM), as demonstrated by immunofluorescence staining. B, The intensity of fluorescence expression of TLC388-treated and camptothecin-treated A549 cancer cells. Results are mean ± standard deviations from 3 independent experiments. CPT indicates camptothecin; DAPI, 4′,6-diamidino-2-phenylindole.
TLC388 Induced G2/M Phase-Related Proteins Phosphorylated ATM, CHK1, CHK2, CDC25C, and Cyclin B1 Expression
The expression of G2/M cell cycle checkpoint-associated proteins in TLC388-treated cells was assessed (Figure 4). Phosphorylation of ATM was noted in A549 and H838 cells after 8 hours of treatment with 0.1 μM TLC388. Molecular events showed upregulation of p-CHK1, p-CHK2, p-CDC25C, and p-cyclin B1 was also noted in TLC388-treated cancer cells. Downregulation of CDC25C and cyclin B1 was observed on both cancer cells. Phosphorylated CDC2 slightly increased the expression level after TLC388 (0.1 μM) treatment in A549 cells.
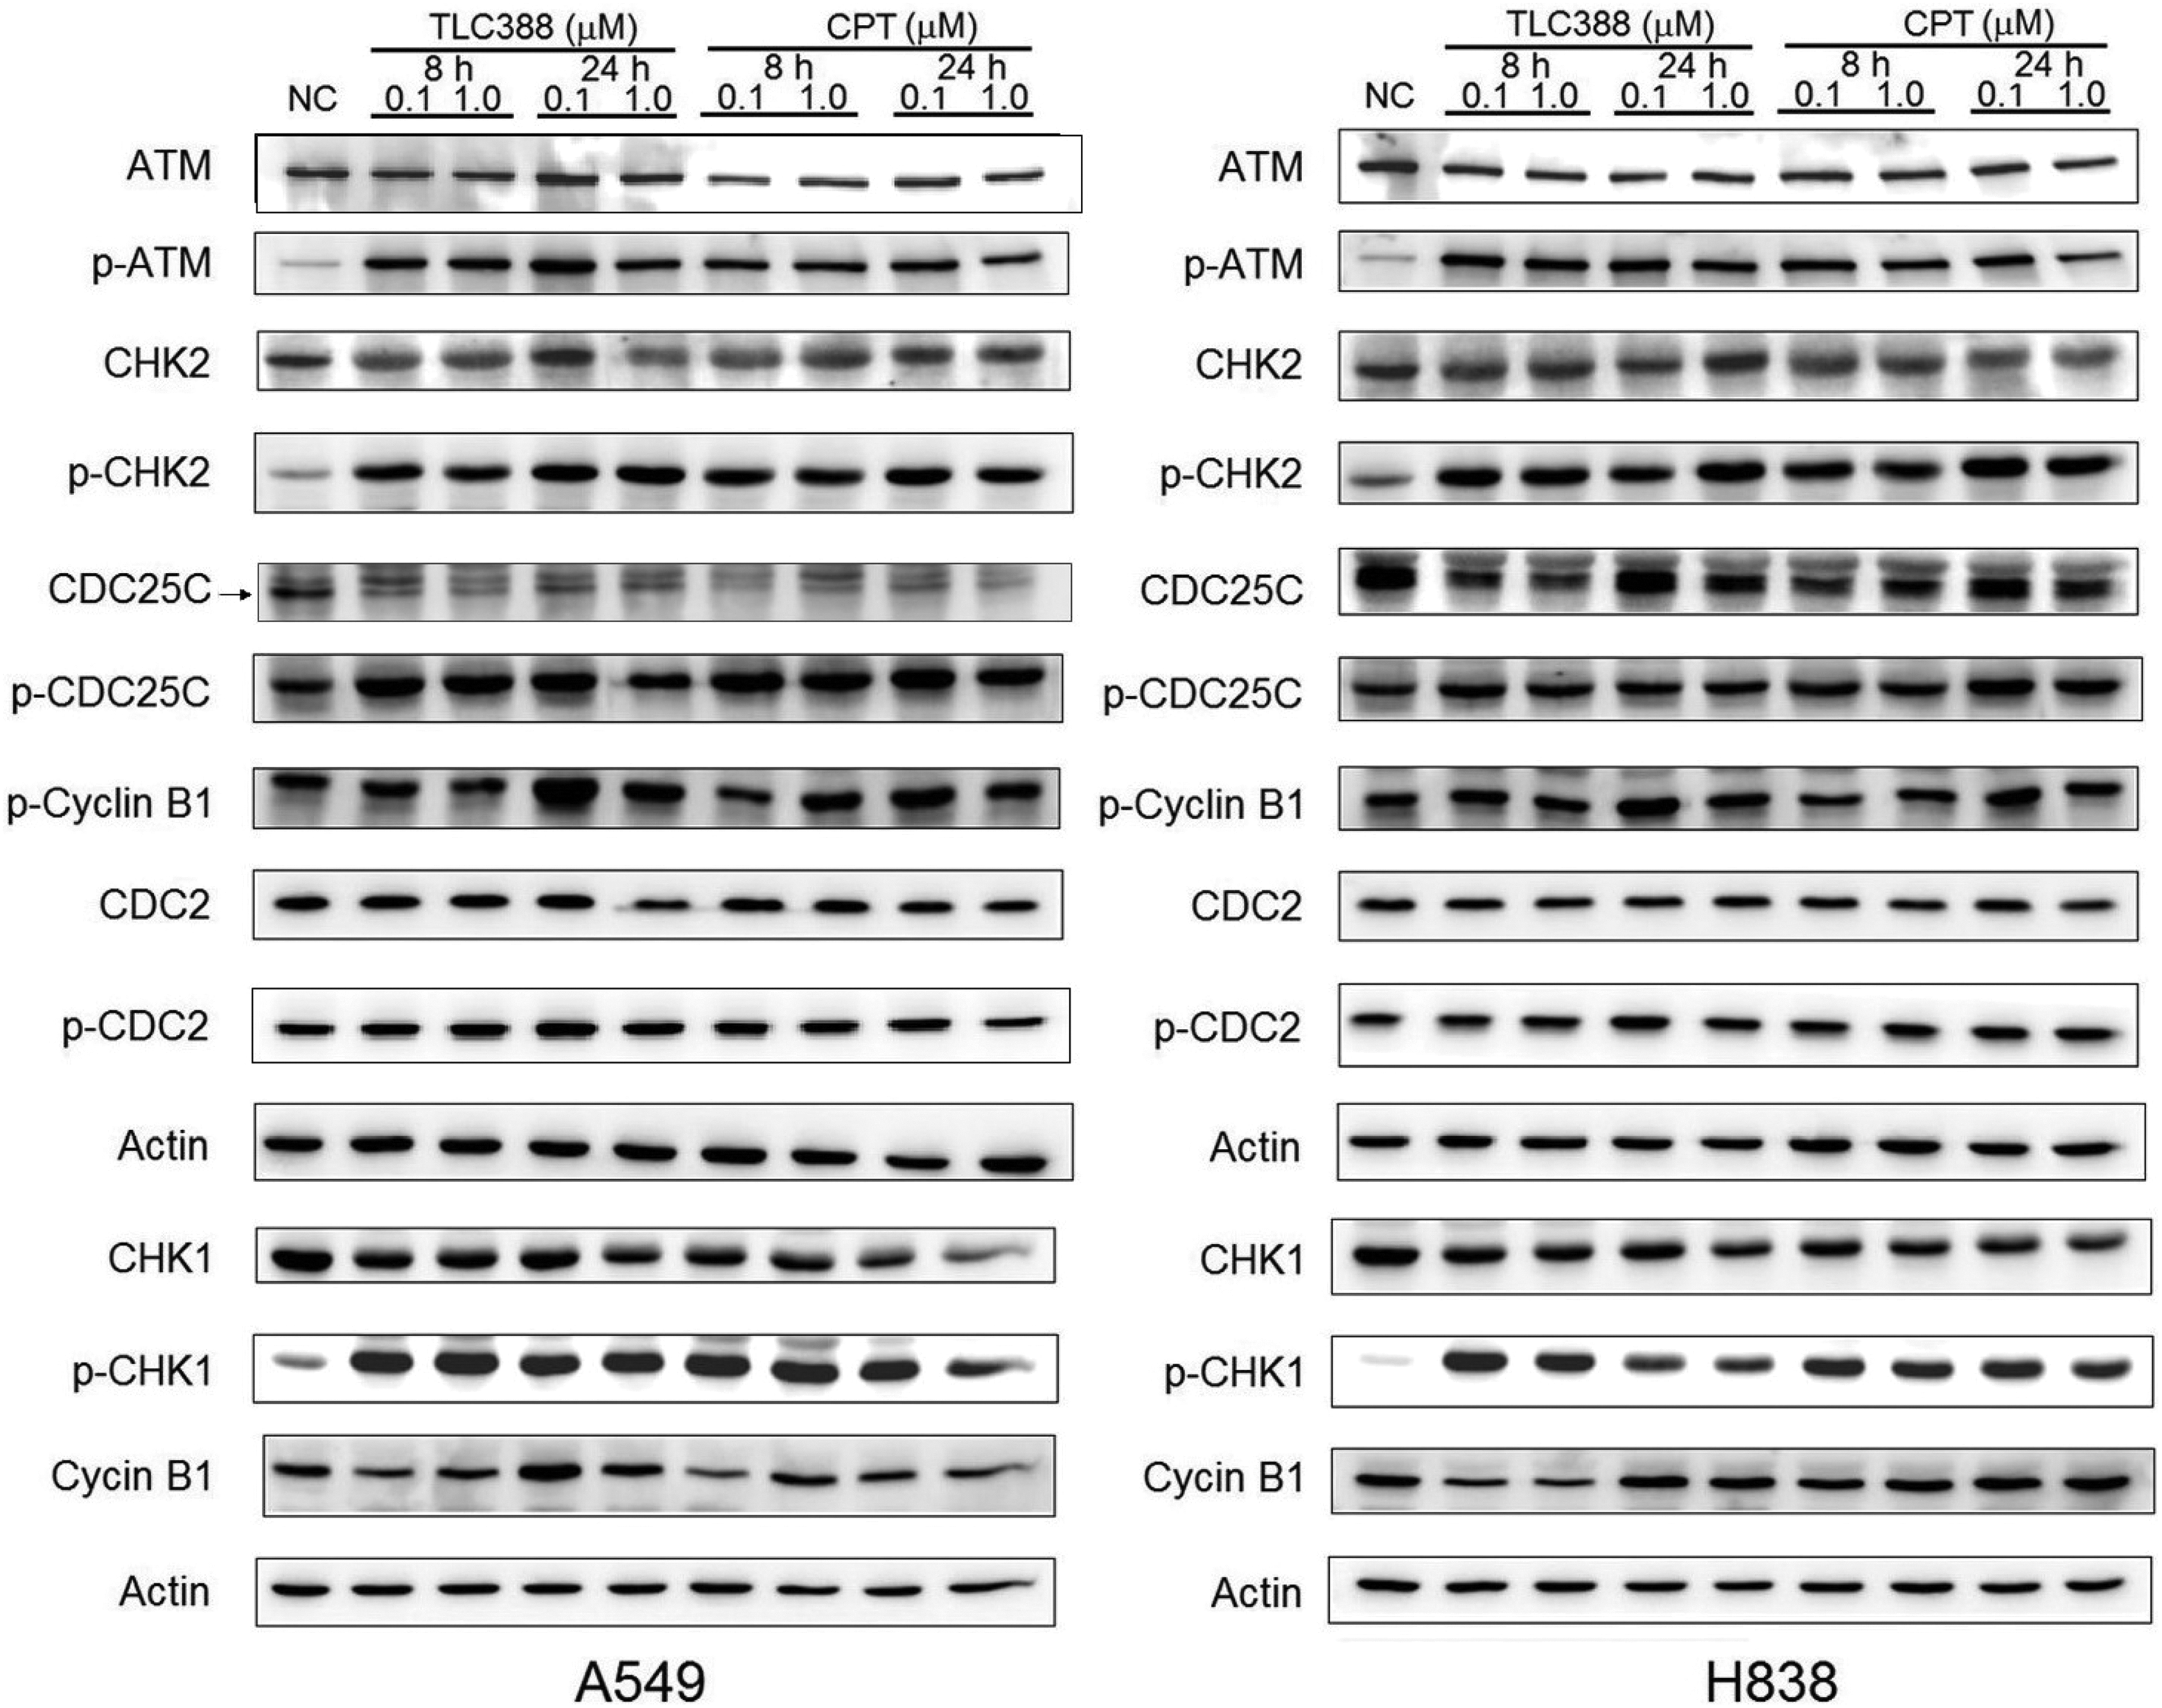
Expression of G2/M cell cycle checkpoint-related proteins in TLC388-treated A549 and H838 cancer cells. Phosphorylation of ataxia-telangiectasia mutated (ATM) was observed 8 hours after treatment with TLC388 (0.1 or 1.0 μM) in both A549 and H838 cells. Increased levels of proteins downstream of phosphorylated (p-)ATM, namely, p-CHK1, p-CHK2, p-CDC25C, and p-cyclin B1, were also noted in TLC388-treated cancer cells. Expression of CDC25C, cyclin B1 was decreased in both cancer cells. Phosphorylated CDC2 slightly increased the expression level after TLC388 (0.1 μM) treatment in A549 cells.
Combination of CHK1 Inhibitor With TLC388 Augmented Cell Inhibition in A549 and H838 Cells
The effect of CHIR124, a CHK1 inhibitor, on A549 and H838 cells was examined in this assay. An MTT assay showed that cell viability decreased in a dose-dependent manner when concomitantly administered CHIR124 and TLC388 (Figure 5A). Increased concentration of TLC388 and/or CHIR124 was associated with lower viability of cancer cells (P for trend < .05).

Cell viability and morphological examination in TLC388 and/or CHIR124 treated cells. A, Results of an MTT assay showing the effect of different concentrations of TLC388, CHIR124, or TLC388 plus CHIR124 treatment for 48 hours on A549 and H838 cells. Increased concentration of TLC388 and/or CHIR124 was associated with lower viability on cancer cells (P for trend < .05). Significant differences between control cells and cells treated with either TLC388 or TLC388 plus CHIR124 are indicated by *** P < .001. Significant differences between control cells and cells treated with CHIR124 or CHIR124 plus TLC 388 are indicated by ††† P < .001, †† P < .01, † P < .05. Results are mean ± standard deviation from 4 independent experiments. B, Changes in A549 cell morphology after treatment with CHIR124 (0.5 μM) and/or TLC388 (0.1 μM) for 24 hours (Liu’s stain). CPT indicates camptothecin; MTT, thiazolyl blue tetrazolium bromide.
Morphological Changes in A549 Cells After Co-Treatment With TLC388 and CHIR124
TLC388 and CHIR124 induced morphological alterations, such as chromatin condensation, membrane shrinkage, and apoptotic body formation. Some multinucleated cells were also observed in our study (Figure 5B).
Combination of TLC388 With CHIR124 Induced Sub-G1 Elevation and G2/M Phase Decrease
As shown in Figure 6A, treating A549 cells with TLC388 and CHIR124 resulted in a larger hypoploid cell population and accumulated of cells in the G2/M phase after 24 and 48 hours, when compared to the control groups. Compared to treatment with 0.1-μM TLC388 alone, the combined administration of 0.1-μM TLC388 and 0.1 or 1.0-μM CHIR124 significantly increased the population of sub-G1 phase cells and decreased the number of cells in G2/M phase after 24 and 48 hours (Figure 6B and C).
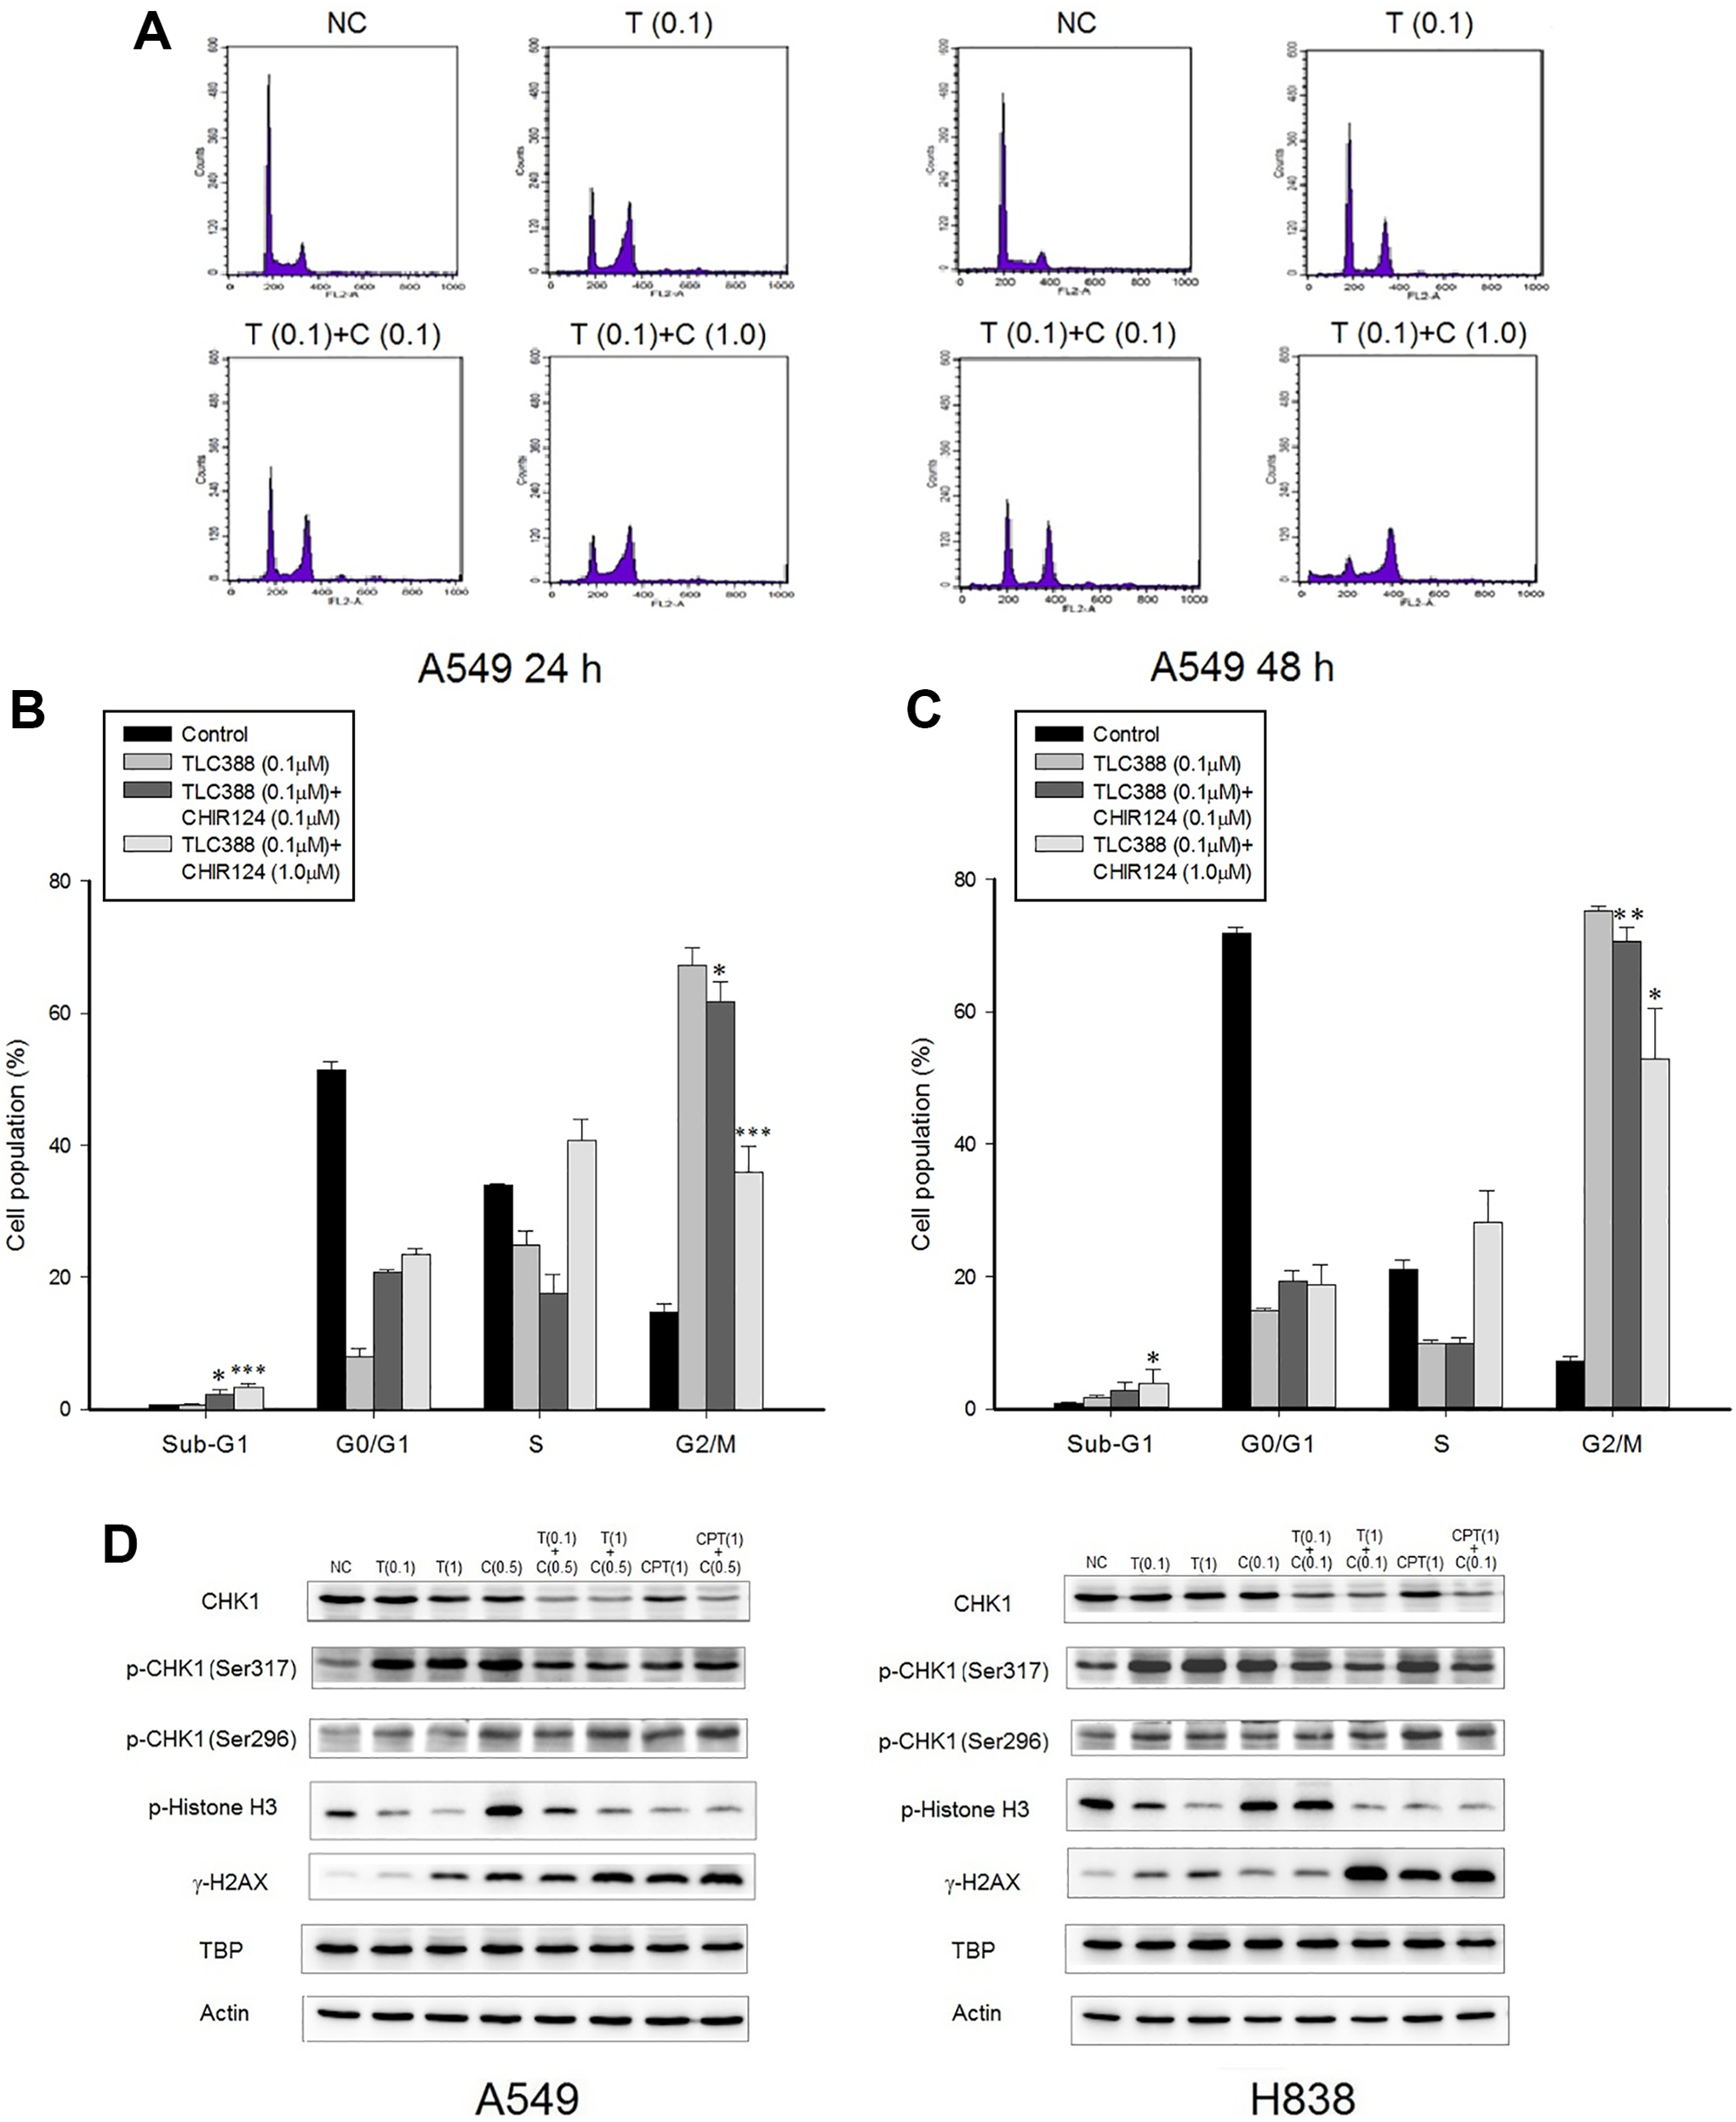
Flow cytometric analysis and expression of G2/M cell cycle checkpoint-related proteins in TLC388- and/or CHIR124-treated NSCLC cells. A, In contrast to the control treatment, exposure of A549 cells to a combination of TLC388 and CHIR124 for 24 or 48 hours resulted in a population of hypoploid cells and the accumulation of cells in the G2/M phase. Cell cycle analysis of A549 cancer cells at (B) 24 and (C) 48 hours is shown. Combined TLC388 + CHIR124 treatment significantly increased the population of cells in the sub-G1 phase and decreased that of cells in the G2/M phase at 24 and 48 hours compared with TLC388 treatment alone. Significant differences between cells treated with TLC388 (0.1 μM) and those treated with TLC388 (0.1 μM) + CHIR124 (0.1 μM) or TLC388 (0.1 μM) + CHIR124 (1 μM) are indicated as follows: * P < .05, ** P < .01, and *** P < .001. The results are means ± standard deviations from 4 independent experiments. D, After treatment for 24 hours, CHIR124 increased levels of p-CHK1 in A549 and H838 cells. Decreased CHK1 and p-CHK1 expression was observed in A549 and H838 cells following TLC388 and CHIR124 coadministration. Upregulation of γ-H2AX was notified in A549 and H838 cells co-treated with TLC388 and CHIR124, suggesting increased DNA damages in both drugs-treated cells. Increased expression of p-histone H3 was observed in CHIR124-treated A549 cells. NC denotes control; T (0.1/1), TLC388 (0.1/1 μM); C (0.1/0.5/1), CHIR124 (0.1/0.5/1 μM). CPT, indicates camptothecin; NSCLC, non-small cell lung cancer; TBP, TATA-binding protein, nuclear loading control.
Combination of CHIR124 With TLC388 Downregulated Phosphorylated CHK1 Expression
Upregulation of p-CHK1 in A549 cells and H838 cells in both cells lines was evident following exposure to CHIR124. Moreover, decreased CHK1 and p-CHK1 expression was observed in A549 and H838 cells following TLC388 and CHIR124 coadministration for 24 hours (Figure 6D).
CHIR124 and TLC388 Increased the Expression of γ-H2AX but Not p-Histone H3 in A549 and H838 cells
The upregulation of γ-H2AX was noted when A549 and H838 cells were co-treated with TLC388 and CHIR124, suggesting increased DNA damage in both CHIR124- and TLC388-treated cells (Figure 6D). Increased expression of p-histone H3 was observed in CHIR124-treated A549 cells. However, when compared with CHIR124 treatment alone, co-treatment CHIR 124 with TLC388 decreased the expression of p-Histone H3.
Co-Treatment TLC388 With CHK124 Increased Proportion of Apoptotic Cells in A549 Cells
The number of apoptotic A549 cells (ie, the proportion of FITC+/PI− and FITC+/PI+ cells in the annexin V/PI assay) increased after treatment with TLC388 and/or CHIR124 for 24 or 48 hours (Figure 7A). Compared to treatment with TLC388 alone, combining CHIR124 with TLC388 enhanced this proapoptotic effect after both 24 and 48 hours (Figure 7B). There is a trend that by TUNEL assay, apoptosis was enhanced using a combination of CHIR124 and TLC388 treated for 48 hours, compared to TLC388 alone, although there is no statistical significance (Figure 7C). Decreased expression of procaspase 3 was observed in TLC388 and CHIR124 co-treated (TLC388 0.1 μM + CHIR124 1 μM, TLC388 1.0 μM + CHIR124 1 μM) NSCLC cells for 48 hours (Figure 7D), suggesting increased proportion of apoptosis in NSCLC cells.

Flow cytometric analysis of apoptosis of TLC388- and/or CHIR124-treated NSCLC cells and immunoblotting for procaspase 3. A, A549 cells in the control (NC) and 24 and 48 hours treatment groups were stained with annexin V-fluorescein isothiocyanate (FITC) and propidium iodide (PI) and analyzed by flow cytometry. The number of apoptotic (FITC+/PI− and FITC+/PI+) cells increased after treatment with TLC388, CHIR124, and TLC388 + CHIR124. B, Proportion of A549 cancer cells undergoing apoptosis, as determined by an annexin V/PI staining assay. Apoptosis of A549 cells was significantly enhanced using a combination of CHIR124 and TLC388, compared to TLC388 alone, after 24 hours (9.92% vs 5.27%; * P < .05) and 48 hours of treatment (26.9% vs 14.3%; ** P < .01). *** P < 0.001, NC versus TLC388 (0.1 μM)-treated cells. The results are means ± standard deviations from 4 independent experiments. C Effect of TLC388 and/or CHIR124 on DNA fragmentation by TUNEL assay in A549 and H838 cells treated for 48 hours. There is a trend that apoptosis was enhanced using a combination of CHIR124 and TLC388, compared to TLC388 alone, although there’s no statistical significance. The results are means ± standard deviations from 3 independent experiments. D, Expression of procaspase 3 in TLC388- and/or CHIR124-treated NSCLC cells for 48 hours. Decreased expression of procaspase 3 was observed in TLC388 and CHIR124 co-treated NSCLC cells. NC indicates negative control; NSCLC, non-small cell lung cancer.
Discussion
Our results suggest that the CPT-derivative TLC388 has a negative effect on the viability and proliferation of lung cancer cells. TLC388 can activate cell cycle checkpoint proteins, which arrest the cell cycle in the G2 phase to enable DNA repair. Nuclear DNA TOP is an enzyme essential to organismal survival. DNA tends to be supercoiled during replication, transcription, recombination, and chromatin remodeling processes. Topoisomerase 1 can nick a single DNA strand, relax supercoiling, and religate DNA. 4 Topoisomerase 1 inhibitors can trap the DNA–TOP1 complex and inhibit religation, leading to DNA damage.
In A549 cells, γ-H2AX, the Ser139-phosphorylated form of histone H2AX that is generated upon induction of DSBs, 17,18 formed within minutes of TLC388 administration and its level increased up to 24 hours of treatment. H2AX, a variant of the nucleosome core histone H2A, constitutes 2% to 10% of the H2A complement in mammalian tissues. Its phosphorylation is mediated by PI3-related protein kinases, including ATM, ATR, and/or DNA-dependent protein kinase (DNA-PK), 19 -21 and occurs in megabase chromatin domains at the edges of DSBs. 22 γ-H2AX has been found to be involved in the recruitment of the repair factors RAD50, RAD51, and BRCA1 to nuclear foci after DNA damage, suggesting a role in DNA repair. 23 Our observation of γ-H2AX foci in A549 cells following TLC388 treatment, from within minutes of administration up to 24 hours later, indicated DNA damage and continuing DNA repair.
In the present study, the percentage of cells in the G2/M phase was shown to be 5-fold higher in the TLC388 treatment group than the control group. Previous data have demonstrated that topotecan causes an accumulation of NSCLC cells in the S and G2/M phases, 24 but in the present study, TLC388 had a greater arrest effect in the G2/M phase than topotecan. The results of our p-histone H3 (Ser10) assay suggested that the cell cycle was arrested in the G2 phase. In contrast to CPT, which has been shown to be cytotoxic to S-phase cells in early studies, 25,26 other studies have demonstrated S and G2/M arrest due to cells with defects in repairment of damaged replicons and/or alterations in DNA damage checkpoints, 26 and the effect of TLC388 may involve G2-phase regulatory checkpoints.
Further examination of G2-phase proteins by immunoblotting revealed that levels of p-ATM and the downstream molecules p-CHK1, p-CHK2, p-CDC25C, p-CDC2, and p-cyclin B1 were increased in lung cancer cells following TLC388 treatment, indicating the activation of checkpoint proteins to arrest the cell cycle at the G2 phase. p-ATM phosphorylated the downstream protein CHK1, which in turn phosphorylated the phosphatase CDC25C, inhibiting its activity. p-CDC2 and p-cyclin B1 then accumulated due to decreased dephosphorylation by CDC25C, preventing cell cycle progression to the M phase. Together with the presence of nuclear γ-H2AX foci, this suggests that TLC388 induced these cells to arrest at the G2 phase to enable DNA repair.
CHK1 is an essential kinase required for cell cycle delay after DNA damage 27 and is present during the S phase and at the G2/M checkpoint. It can stimulate the DNA-dependent protein kinase catalytic subunit (DNA-PKcs) to enhance DNA-PK-mediated nonhomologous end joining following DSBs. 28 Moreover, CHK1 interacts with RAD51 by phosphorylation of the latter at Thr309 to protect cells against lethal DNA insults through regulation of homologous recombination repair. 29 In response to DNA damage, CHK1 dissociates from chromatin in a mechanism involving reduced phosphorylation of histone H3 at Thr11 and the promotion of transcriptional repression. 30
In the present study, we also treated lung cancer cells with a combination of TLC388 and the CHK1 inhibitor CHIR124, a quinolone-based small molecule. Decreased cell viability and the induction of apoptosis were observed as a result of the co-treatment. Topoisomerase 1 and CHK1 inhibitor co-treatment has been found to enhance tumor cell death in previous work by disrupting the G2/M checkpoint and promoting apoptosis. 31,32
CHK1 is known to suppress the caspase 2-associated apoptotic response to irradiation-induced DNA damage 33 and can protect cells from apoptosis involving caspase 3 activation following DNA replication stress. 34 TLC388 treatment of lung cancer cells resulted in the activation of G2/M checkpoint proteins (including CHK1) and induced these cells into cell cycle arrest to allow for DNA repair, whereas CHK1 inhibitors downregulated G2/M-associated proteins and triggered more cells to undergo apoptosis. We observed increased p-histone H3 levels in A549 cells after CHIR124 administration, which indicated the possibility that this inhibitor led to abrogation of the G2/M checkpoint, causing them to undergo mitotic death, as observed in prior studies. 31,32 However, decreased expression of p-histone H3 was noted in co-treatment of TLC388 with CHIR124 compared with CHIR124 alone in our investigation; thus, our results might suggest that a mechanism other than G2/M checkpoint inhibition was involved. The potential mechanisms for the observed phenomenon require further investigation.
Conclusion
In conclusion, TLC388 is capable of inhibiting the growth of human lung cancer cells and inducing their arrest in the G2 phase for DNA repair. Co-treatment with CHIR124 enhanced the cytotoxic effect of TLC388 and promoted apoptosis.
Footnotes
Authors’ Note
This article is not involved in animal and human studies issues.
Acknowledgments
The authors thank Taiwan Liposome Company, Ltd (Taipei, Taiwan) for providing the TLC388. The authors also thank Dr Charles Ho of Molecular Devices Company for technical support on the instrumentation of ImageXpressMicro 4 microscope.
Declaration of Conflicting Interests
The author(s) declared no potential conflicts of interest with respect to the research, authorship, and/or publication of this article.
Funding
The author(s) disclosed receipt of the following financial support for the research, authorship, and/or publication of this article: This research was funded by MacKay Memorial Hospital (grant numbers MMH-E-109-13, MMH-E-108-13, and MMH-107-153) and the Ministry of Science and Technology (grant numbers MOST-104-2320-B-010-014-MY3, MOST-107-2320-B-010-027-MY3, and MOST-106-2623-E-195-001-NU) of Taiwan.