
Abstract
Practitioners of adult education have a long history of teaching for social change. They may, however, be uncomfortable using quantitative methods to assess the impact of their learning activities, or they might lack access to statistical analysis software. Quantitative methods help the practitioner determine whether behavioral or attitudinal change among participants is more likely linked to their learning intervention than to chance. This is crucial information for practitioners to secure support or funding for their learning programs. We, therefore, created this guide to try and make quantitative methodologies for measuring social change accessible to practitioners through provision of instruction and resources and by using Microsoft Excel to conduct the analyses.
“One important step is for the educator to consider how best to display results so their coworkers can easily interpret them.”
While the field of adult education has long advocated for social change, it has recently seen increased calls for practices that challenge White supremacy (Brookfield, 2020) and promote racial justice (Isaac‐Savage & Merriweather, 2021). Some U.S. practitioners respond to these calls by providing diversity, equity, and inclusion (DEI) training in their workplaces. According to a recent survey, about half of U.S. workers reported attending DEI trainings or meetings at work (Minkin, 2023), but what impact does this have? Kirkpatrick and Kirkpatrick (2016) describe four levels of training evaluation: reaction, learning, behavior, and results. They say data about behavior and results are crucial for demonstrating the value of the training to the organization, but these are also the most often omitted from evaluations. For DEI training, behavior change data might, for example, indicate employees made less biased decisions or were able to identify and modify policies that privileged some employees over others. Results data link outcomes to the intervention. Practitioners without terminal degrees may not know how to gather and assess data at these levels, thereby restricting their evaluations to the levels of reaction (were people satisfied with the training?) and learning (could people recall the concepts?).
Failing to determine the impact of social change initiatives can be problematic for at least two reasons. First, within the U.S., we simultaneously experience calls from advocates for prioritizing DEI and calls from opponents to quash these efforts. Increasing numbers of states have passed or introduced legislation banning the teaching of concepts such as unconscious bias (Ray & Gibbons, 2021) and critical race theory (Schwartz, 2021) in formal education, making this an especially dicey time for those practitioners who teach DEI concepts in schools. In such a divisive environment, demonstrating that participants liked a workshop (a reaction evaluation) is of limited value. Second, DEI training programs can have outcomes that are the opposite of what is intended. A blunt trainer in a workshop intended to encourage development of racial sensitivity, for example, could end up triggering extreme defensive reactions that entrench views instead of encouraging critical reflection (Anand & Winters, 2008). Practitioners need behavioral and results data to advocate for their workplace DEI programs and to improve them.
Resources for Analysis
Evaluation Design
A common way to determine whether a learning activity worked is to take a measure from participants before and after the intervention. This is called a pretest-posttest design. If the measure changes after the intervention, the change is assumed to come from the intervention. While accessible and intuitive, this design suffers from two major issues. The first is random variability, which occurs when an outcome varies across measurements for no apparent reason. Researchers often refer to this as “noise” in the data. A group may have an average score of 50 on a White privilege measure before a workshop and 48 after the workshop, but how do practitioners know whether this is a meaningful change or simply meaningless noise? Statistical tests help by quantifying the rarity of seeing such a change if, in fact, the workshop was ineffective. But these tests don’t rule out alternative explanations. These explanations, commonly called threats to internal validity, are a second issue affecting pretest-posttest designs. They must be considered and eliminated with design features.
Three common threats to internal validity affecting pretest-posttest designs are history effects, maturation effects, and testing effects (Knapp, 2016). History effects occur when unanticipated events occur between pretest and posttest measures and subsequently influence the latter. Imagine that Mia (she/her) works in an organization that has recently hired several refugees. These new employees have reported overhearing negative comments from coworkers when they chat using their native language in the cafeteria. Mia develops a workshop to raise awareness about color-blind racial discrimination. Her objectives for the workshop are for participants to contrast assimilation and acculturation, and to explore losses associated with assimilation. She asks participants to complete the Color-Blind Racial Attitudes Scale (CoBRAS) the day before the workshop and again two days after the workshop. Unbeknownst to Mia, though, news breaks hours after the workshop of former National Football League (NFL) coach Brian Flores alleging he participated in disingenuous job interviews to satisfy the NFL’s minority hiring interview guidelines. The story leads that night on national news networks. When participants complete the posttest, how can Mia be sure that changes stem from the workshop and not exposure to the Brian Flores story or to other media coverage of DEI issues?
One way of eliminating this possibility is to use a non-equivalent dependent variable (DV). A non-equivalent DV is a “dependent variable that is predicted not to change because of the treatment but is expected to respond to some or all of the contextually important internal validity threats in the same way as the target outcome” (Shadish et al., 2002, p. 509). A measure of the non-equivalent DV is included along with the measure of interest in both the pretest and posttest. If it does not change while the measure of interest does, one can have greater confidence in the intervention’s effect. Returning to the example, the CoBRAS has three subscales measuring unawareness of racial privilege, unawareness of institutional discrimination, and unawareness of blatant racial issues (Neville et al., 2000). Educators can use the scale in full or adopt one of its subscales for more narrowly defined measures. Mia’s workshop directly addresses the CoBRAS subscale measuring unawareness of institutional discrimination. The CoBRAS subscale measuring unawareness of blatant racial issues, however, could be expected to change if participants were influenced by societal forces like the Brian Flores story. If Mia’s posttest shows substantive changes in her measure of interest (unawareness of institutional discrimination) but not her non-equivalent DV (unawareness of blatant racial issues), she can reasonably conclude that the Brian Flores story did not affect her results.
Another threat to internal validity is the maturation effect. This occurs when a person’s scores on a measure change over time from developmental processes or unrelated, yet repeated, experiences. For instance, one might find that a company’s employees become more appreciative of diversity over their first year because they have diverse coworkers and customers. A pretest-posttest design for measuring the impact of a cultural competency workshop would be subsequently confounded. One way of eliminating this possibility is to use a non-participant comparison group that receives the pretest and posttest at the same times as those attending the workshop. If posttest changes are greater in the participant group, one may conclude the changes were not simply the result of repeated exposure to workplace diversity.
A third threat to internal validity in pretest-posttest designs is a testing effect. Testing effects occur when people’s scores on a test improve simply from taking it multiple times, often without feedback. This threat can be similarly ruled out with a non-participant comparison group. If posttest changes occur in the participant group but not the comparison group, the educator can rule out multiple testing opportunities as the cause.
Selecting and Using a Scale
Numerous scales for measuring social change are available online. Educators should select those with published psychometric information and use them as the authors intended—the scale’s creators will specify its purpose and audience. Schooley et al. (2019) provide a helpful review of 18 validated instruments measuring attitudes toward Black people/integration, modern racism, White racial identity development, and White privilege and antiracism. Most present statements to which participants indicate their agreement or disagreement on a Likert scale.
When choosing a scale, an educator should consider its content and its intended population. Regarding content, educators should review potential scales to determine the best match for their learning intervention’s intended outcomes. Scales measuring similar things may have differences between items that make one more appropriate than another depending on workshop topics. Educators must also ensure that a scale is intended for use by participants like those who are expected to attend the workshop. Most scales are initially validated with college students, and researchers often publish later studies to validate a scale’s applicability beyond its original population. Some instruments like the CoBRAS are intended for use by mixed races. Others are intended for only White participants, only female participants, or with other restraints. Educators should investigate a scale’s relevance to their intended population before using it.
Conducting the Analysis
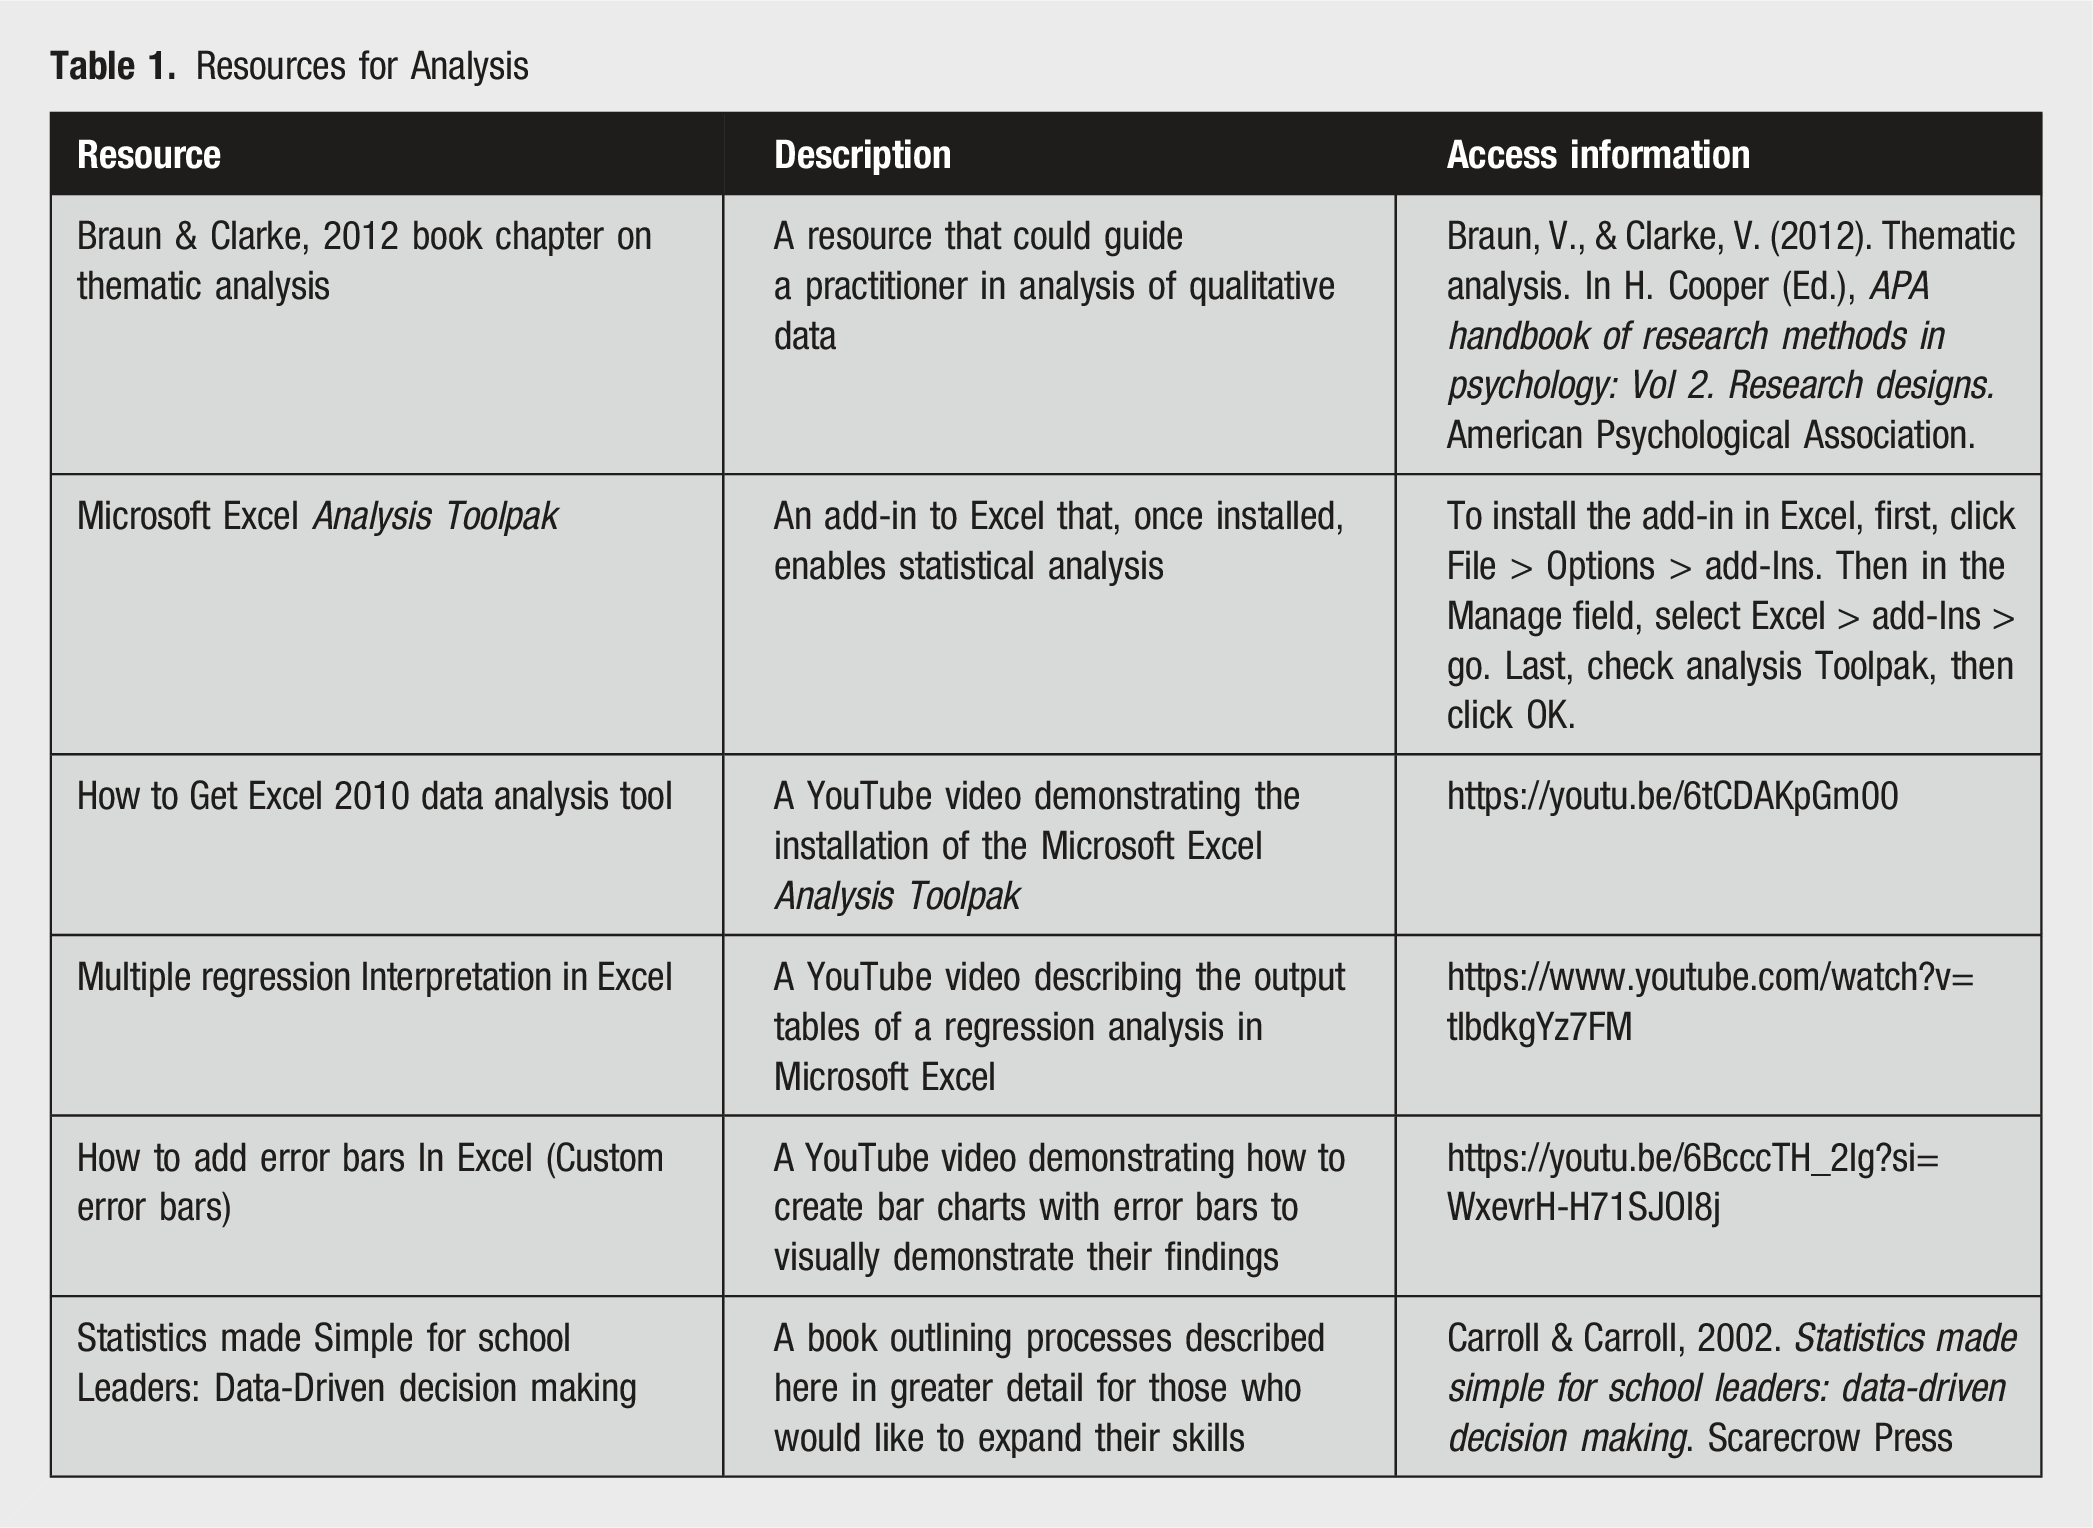
After selecting a scale and a pretest-posttest design, educators can begin collecting data through online or in-person surveys. Several software programs are available for determining if substantive changes have occurred in their measure of interest (e.g., IBM SPSS, R Studio, SAS, and STATA). Perhaps the most accessible to practitioners is Microsoft Excel. Using an add-in called the Analysis Toolpak, educators can conduct analyses ranging from t-tests to regression (see Table 1 for relevant resources).
What follows are two pretest-posttest examples with datasets from hypothetical DEI workshops. The first uses a paired samples t test with a non-equivalent dependent variable to evaluate program impact on perceived White privilege without a comparison group. The second uses regression to similarly evaluate program impact with a comparison group. Each dataset includes the steps for its respective analysis, and each may be used as a template for practice. Datasets may be accessed here: [link omitted for peer review].
Paired Samples t Test
Blake (they/them) held a workshop to help people better understand White privilege. Blake’s objectives for their workshop were for participants to be able to define privilege and identify examples of White privilege in U.S. advertisements, news, and television. Fifty people attended. Blake selected Bahk and Jandt’s (2004) Being White in America Scale (BWAS) as a measure of White privilege and distributed it in an electronic survey to participants one week before and one week after the workshop. Because a comparison group was not available, Blake included a 30-item emotional empathy scale (Caruso & Mayer, 1998) to measure a non-equivalent dependent variable, empathy. Blake believed the workshop would not influence a participant’s sense of empathy but witnessing emotionally laden news related to racial injustice would. If measures of White privilege change but not measures of empathy, Blake can more confidently conclude their workshop was effective. Blake organized the data into five columns: a) participant ID, b) BWAS pretest, c) BWAS-posttest, d) empathy pretest, and e) empathy posttest. Rows corresponded to participants. See Figure 1. Data setup for paired samples t test with a non-equivalent DV (empathy).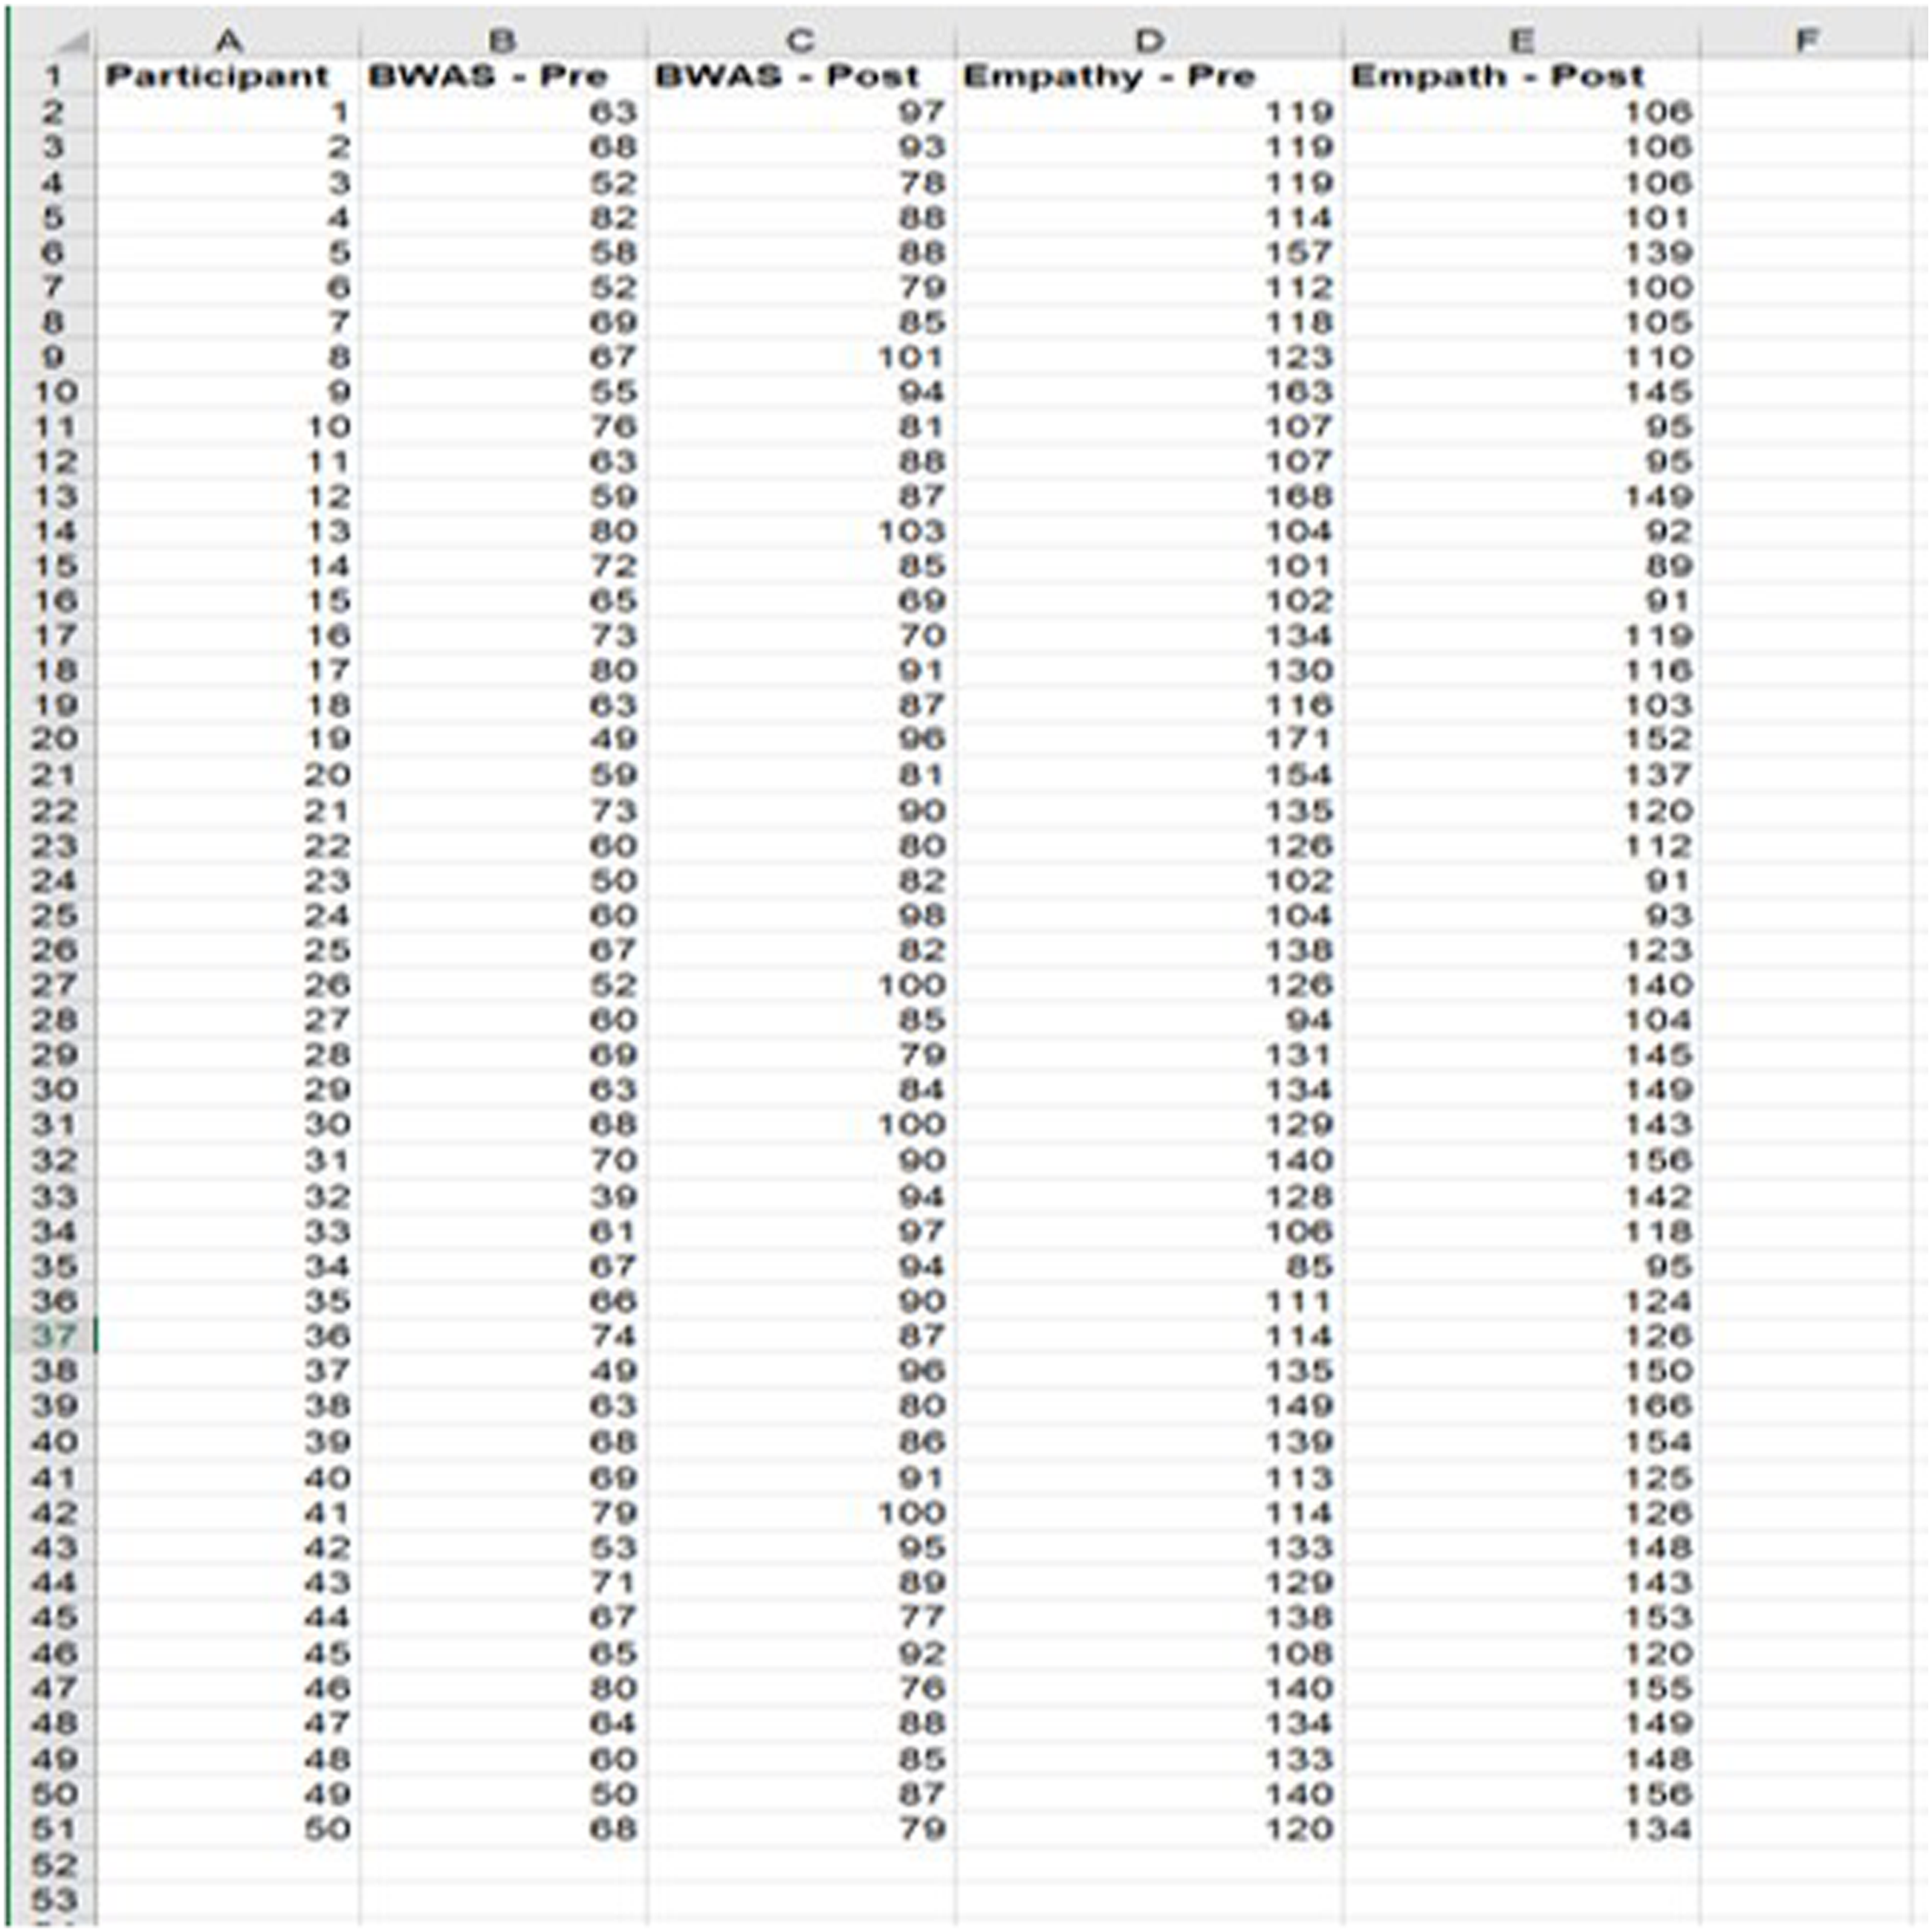
They then followed 10 steps for the related samples t test. See Figure 2. Steps for completing a paired samples t test in Excel with a non-equivalent DV (empathy).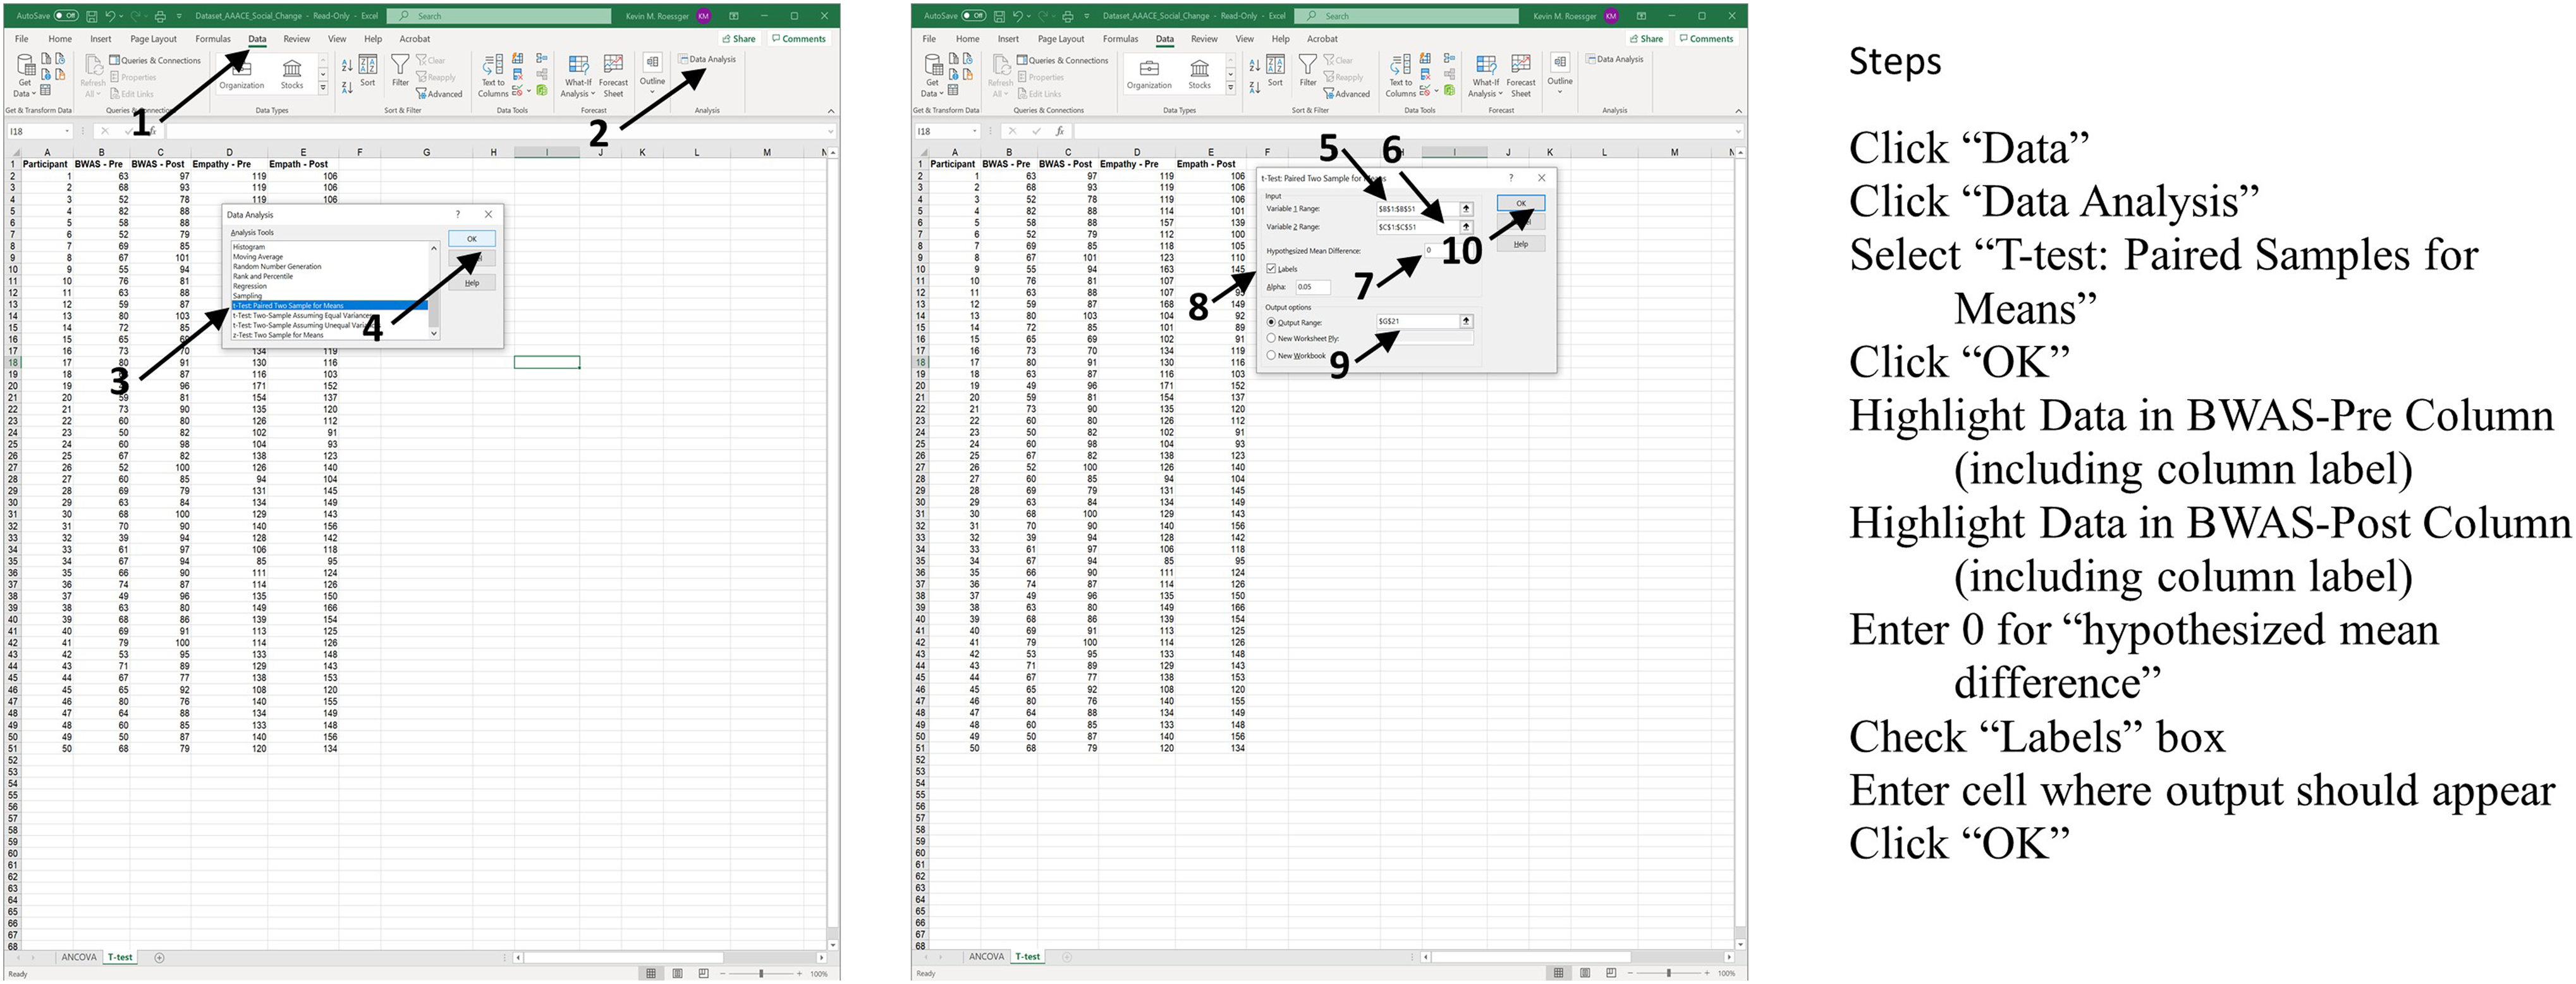
Blake’s output appeared on the spreadsheet. Examining Figure 3, we can see that BWAS pretest scores (M = 64.2) were lower than BWAS-posttest scores (M = 87.88). Output for BWAS using paired samples t test in MS Excel.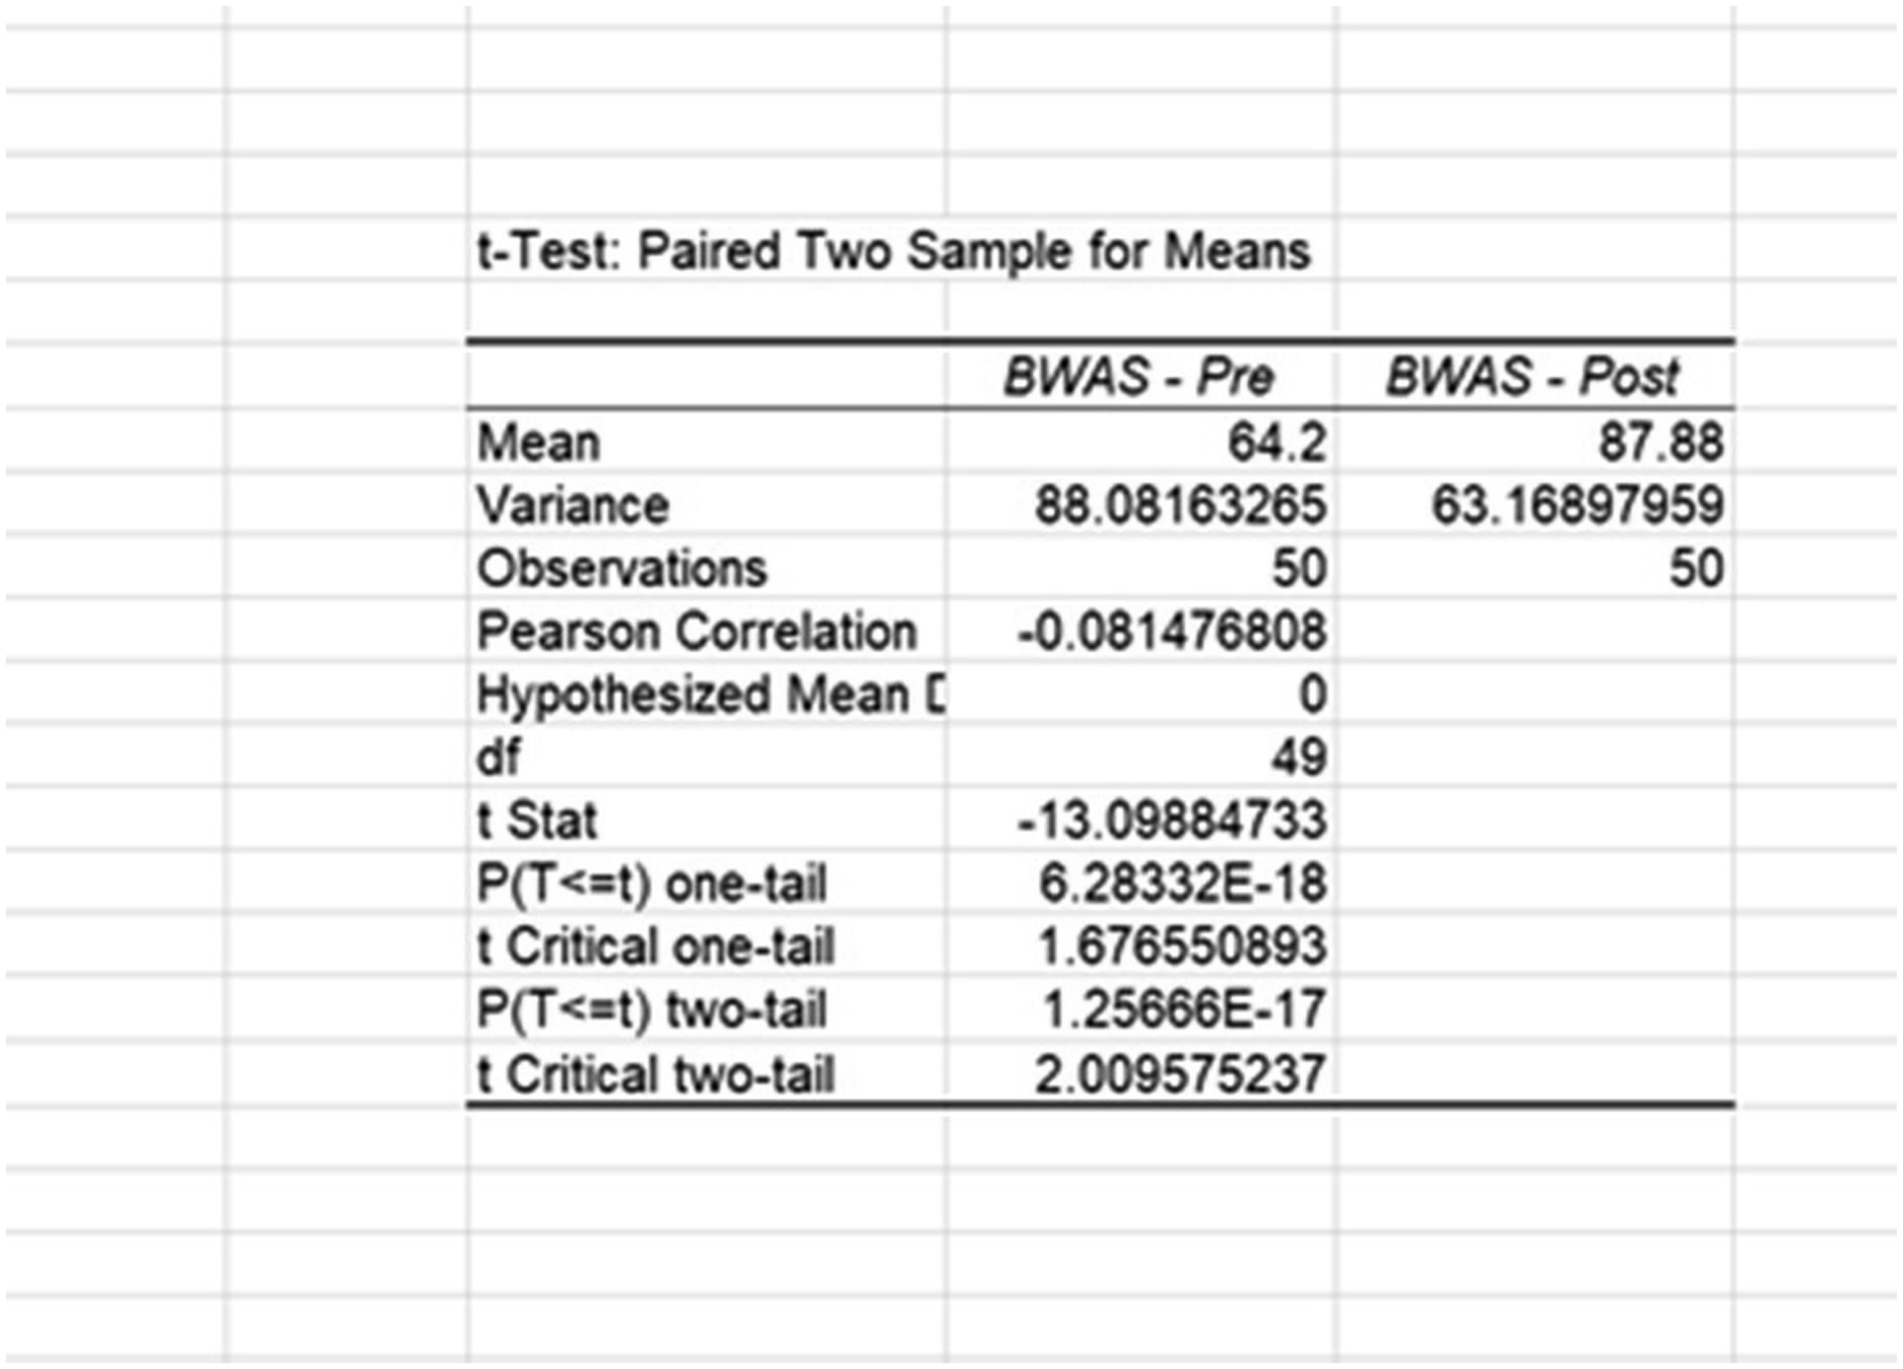
To determine the likelihood of these differences occurring by chance, Blake examined the associated t-statistic and two-tailed p-value (t(49) = −13.10, p < .001). When using inferential statistics, we begin with the assumption that there will be no difference between pre and post test scores. This is called the null hypothesis. The p-value indicates the likelihood of obtaining the statistical difference between the pre and post test results if the null hypothesis was true. A typical threshold of significance is below .05. Since this result meets that criteria, Blake concludes that the difference was not due to random variability and, instead, stemmed from a systematic difference between measurement times. To attribute this to workshop participation, Blake ran a second related samples t test on the pretest and posttest measures of empathy. With no systematic differences between empathy pretest and posttest scores, they can rule out suspected history effects due to news content, which presumably would affect participants feelings of empathy. To do this, Blake repeated the previous steps using empathy measures. Examining Figure 4, we can see that empathy pretest scores (M = 125.32) were slightly higher than empathy posttest scores (M = 125.28). In this case, the p-value is above the threshold of significance, so Blake infers that the difference is likely random variation and not meaningful changes between measurement times. Blake then concludes that their workshop was effective in changing participants’ feelings of White privilege. Output for empathy (non-equivalent DV) using paired samples t test in MS Excel.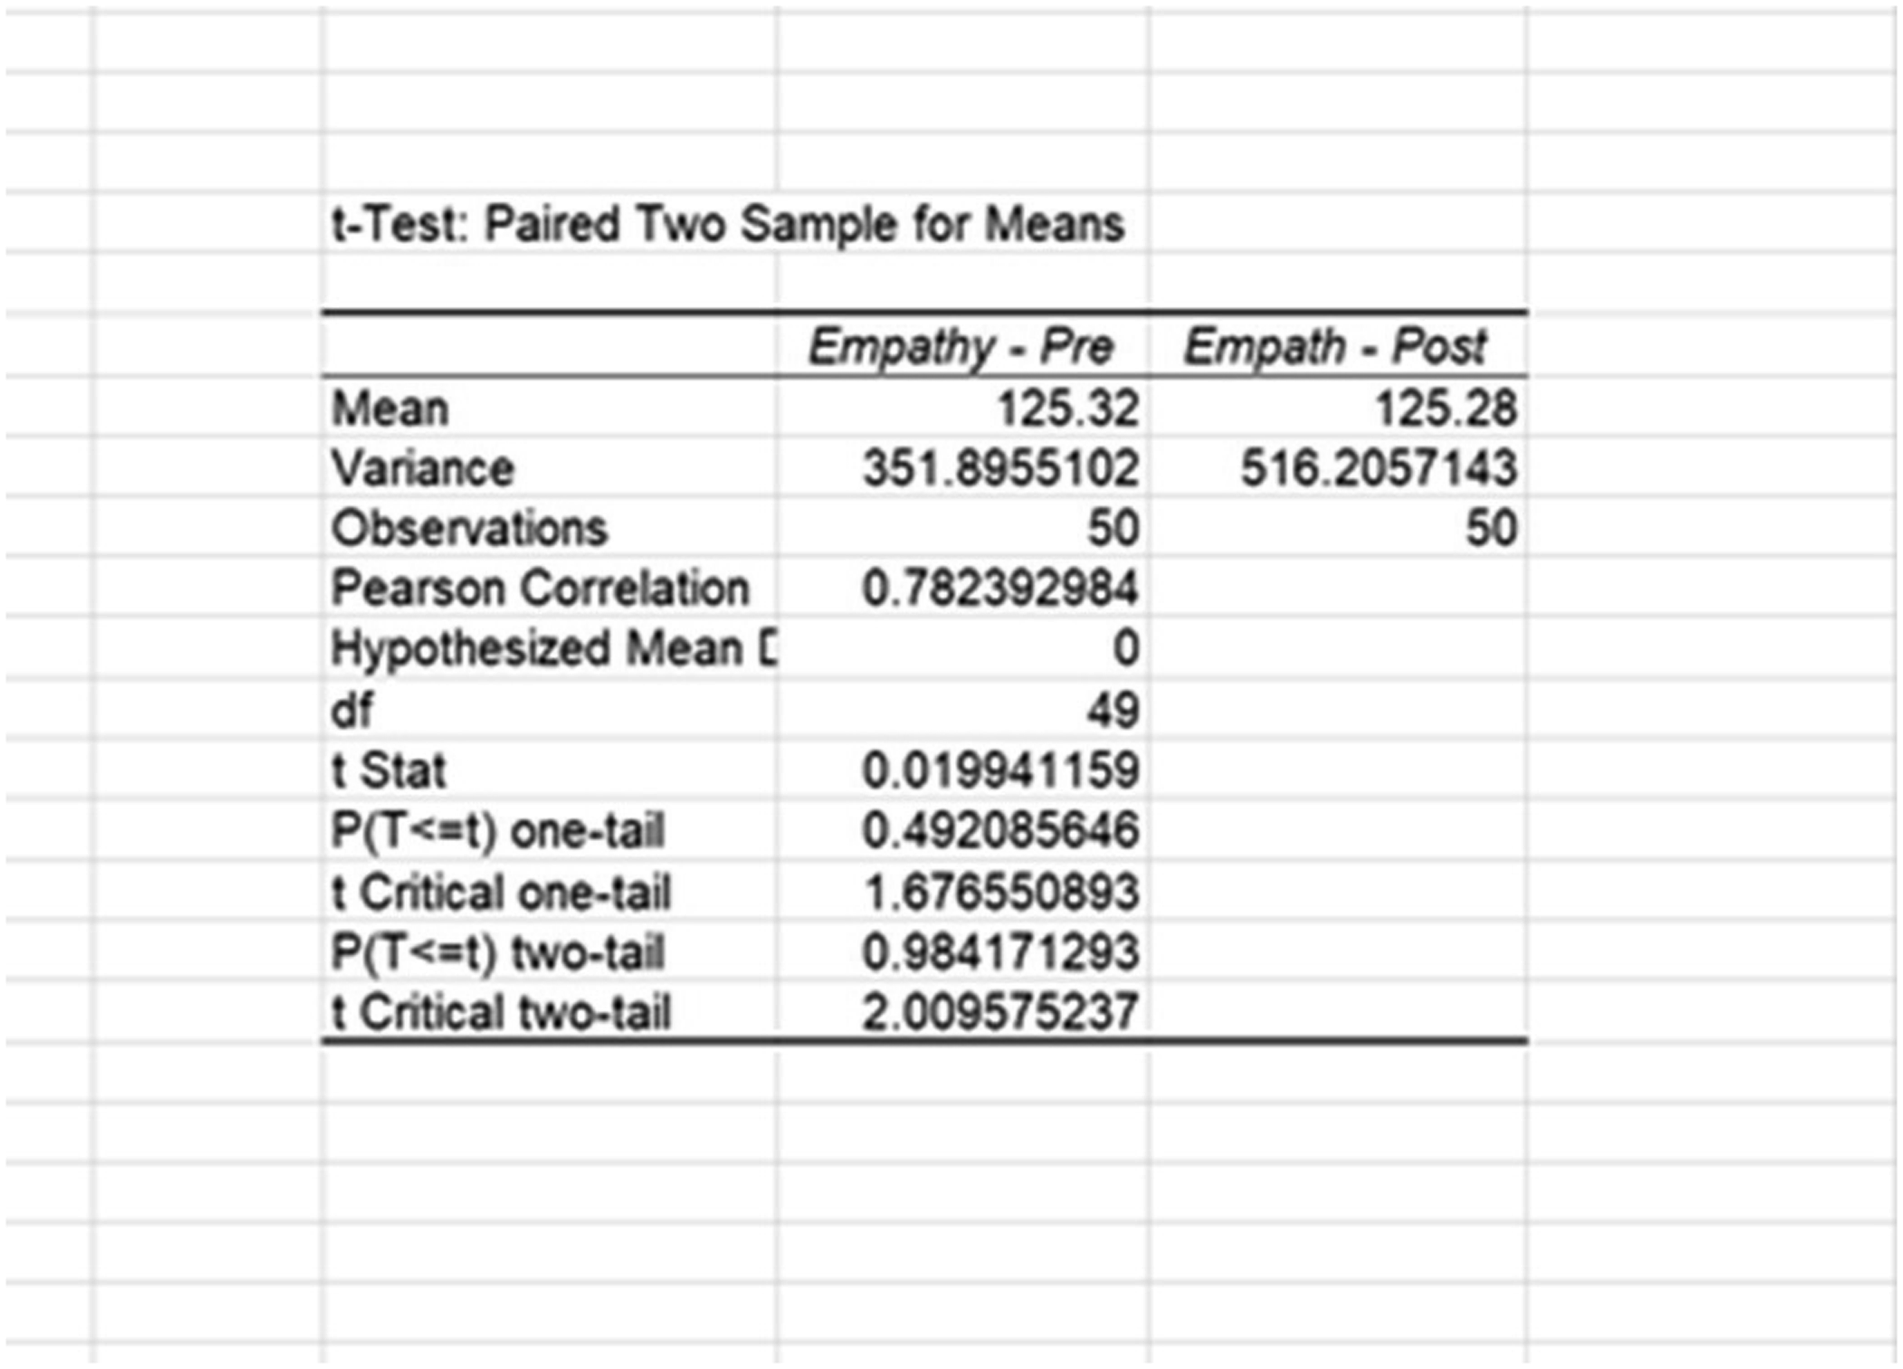
Regression
For this example, imagine Blake recruited a group of non-participants to serve as a comparison group for the same workshop. This allowed them to control for additional threats to internal validity (e.g., testing effects, maturation effects, and group selection biases). When possible, educators should randomly assign participants to groups, but when not, groups can still be equated on their baseline measures of BWAS using pretest BWAS measures as a control variable. Doing so rules out the possibility that potential differences in posttest scores result from different group starting levels. Blake organized their data into four columns: a) participant ID, b) Group, c) BWAS pretest, and d) BWAS-posttest. Group membership was coded as zero for non-participants and 1 for participants. See Figure 5 for an illustration. Data setup for regression with comparison group.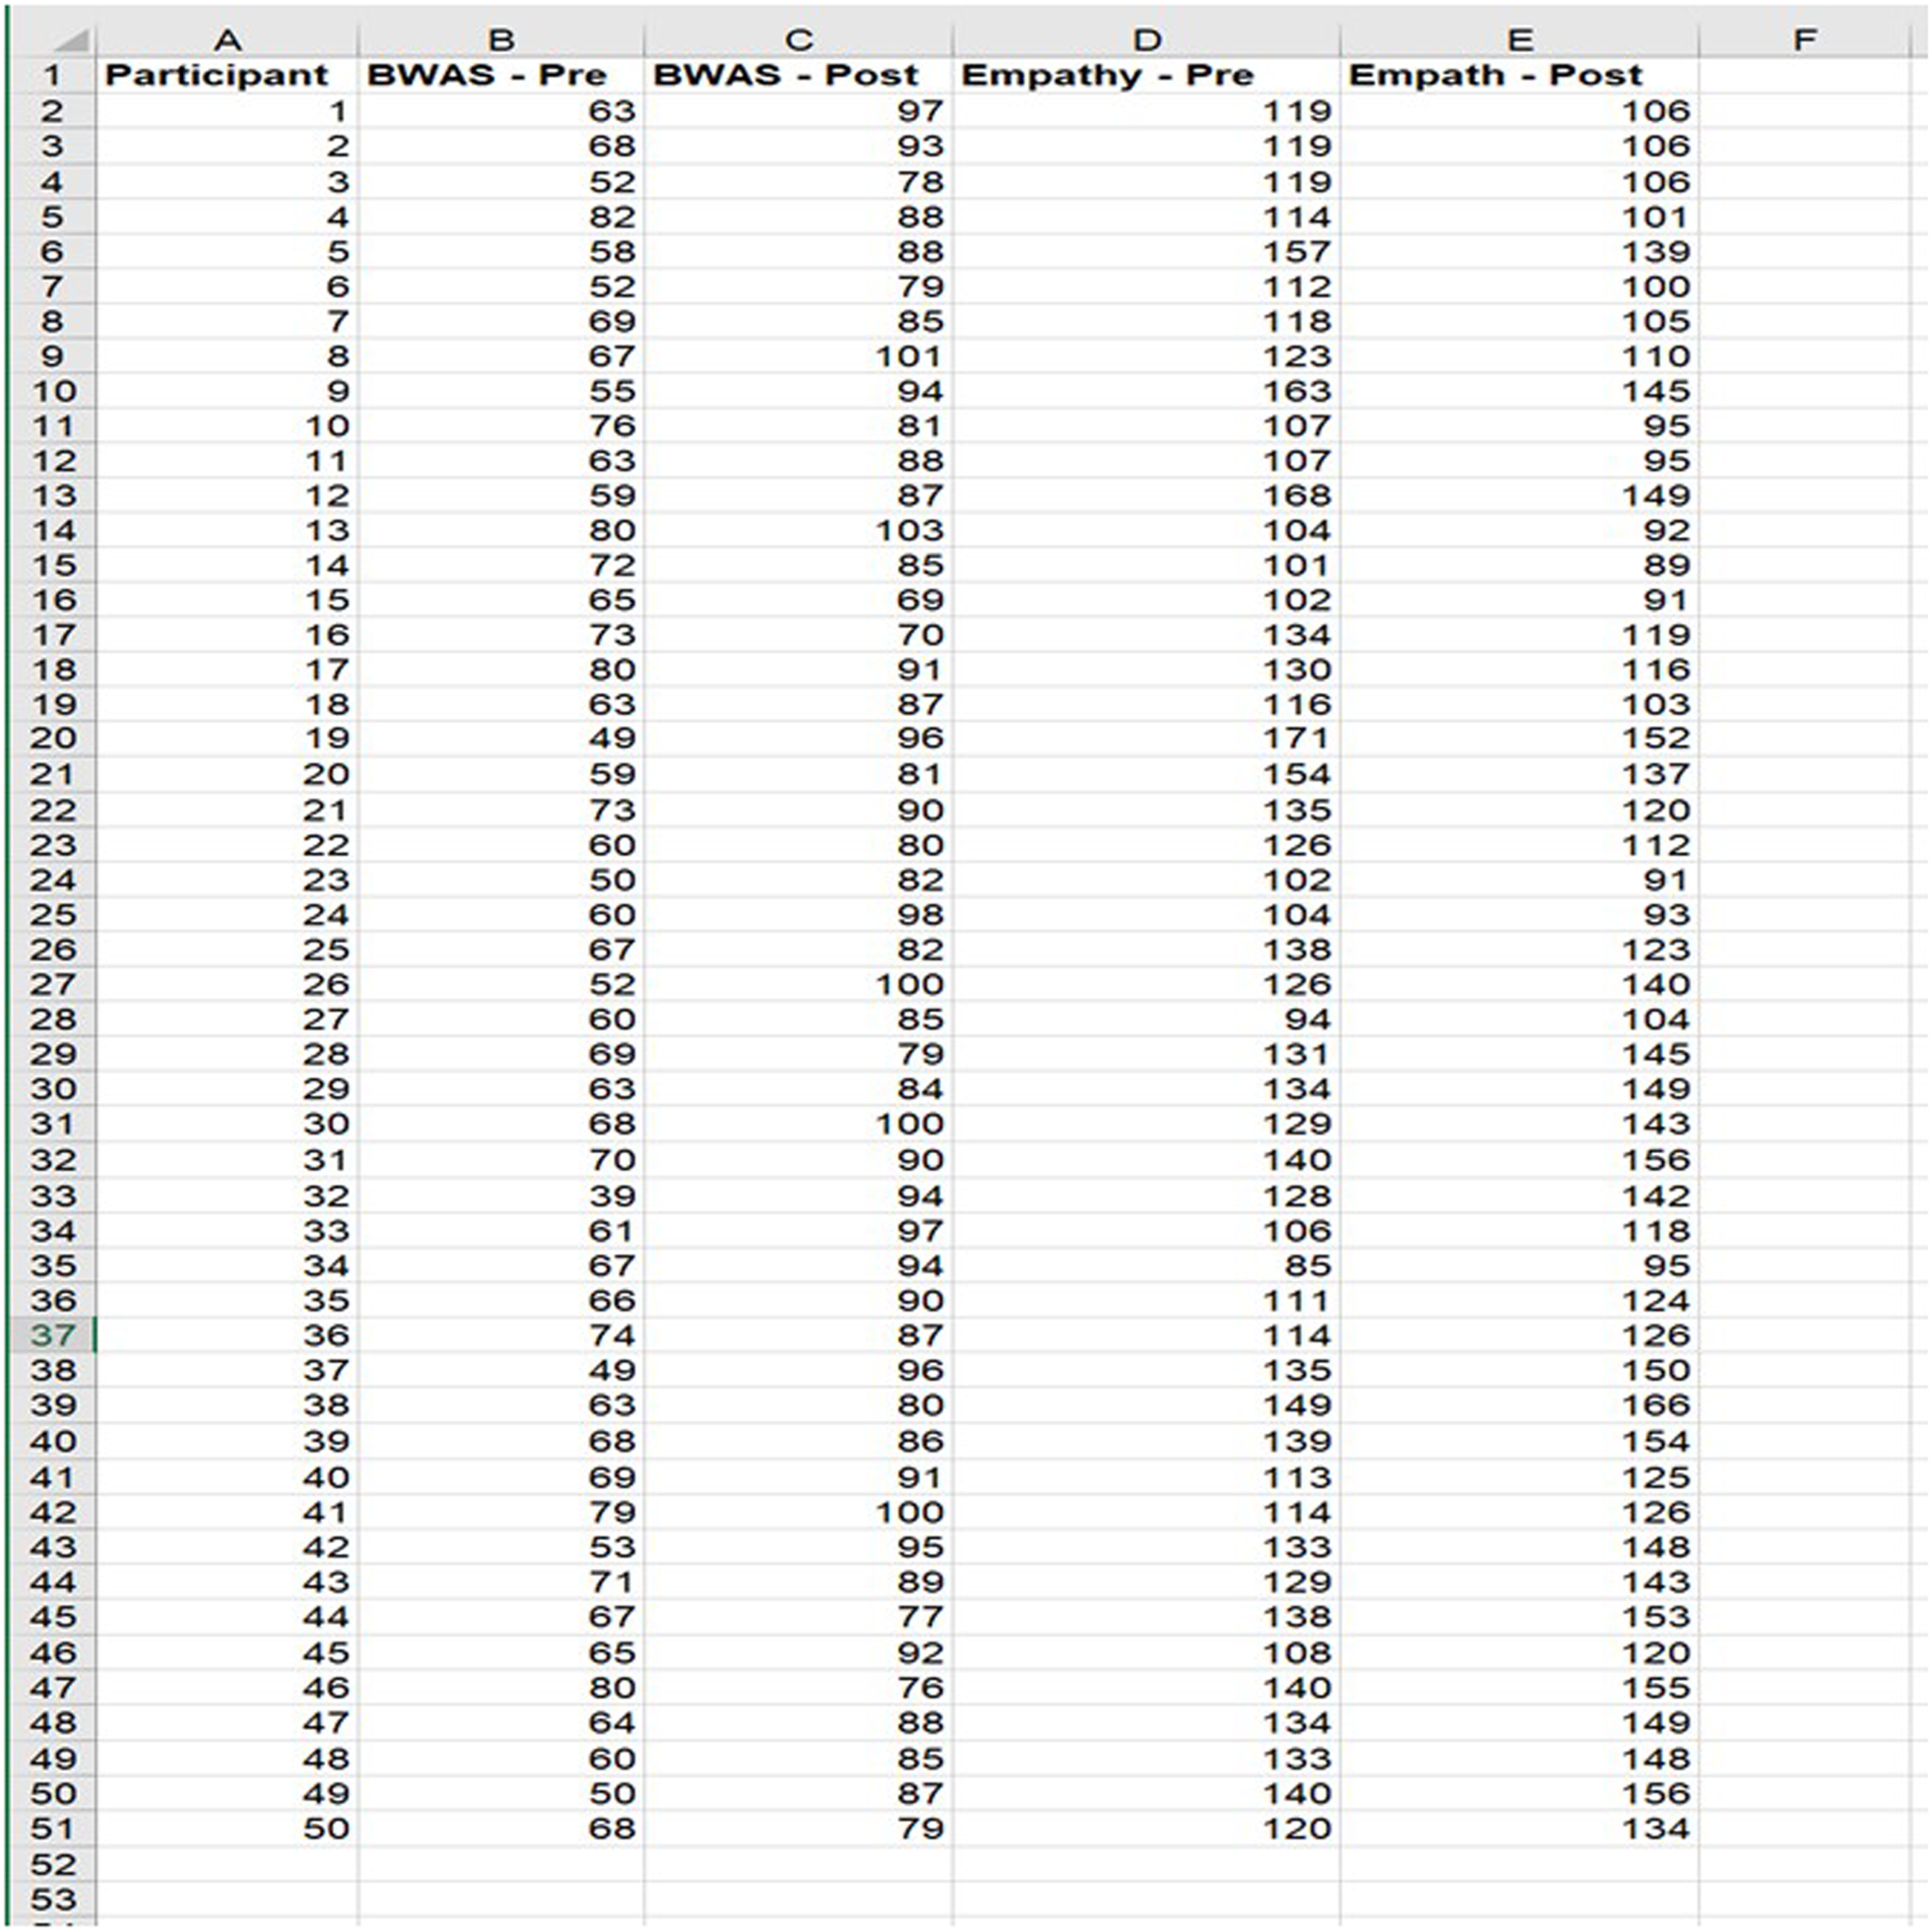
To conduct a regression analysis, Blake followed 9 steps. See Figure 6. Steps for completing regression in Excel using a comparison group.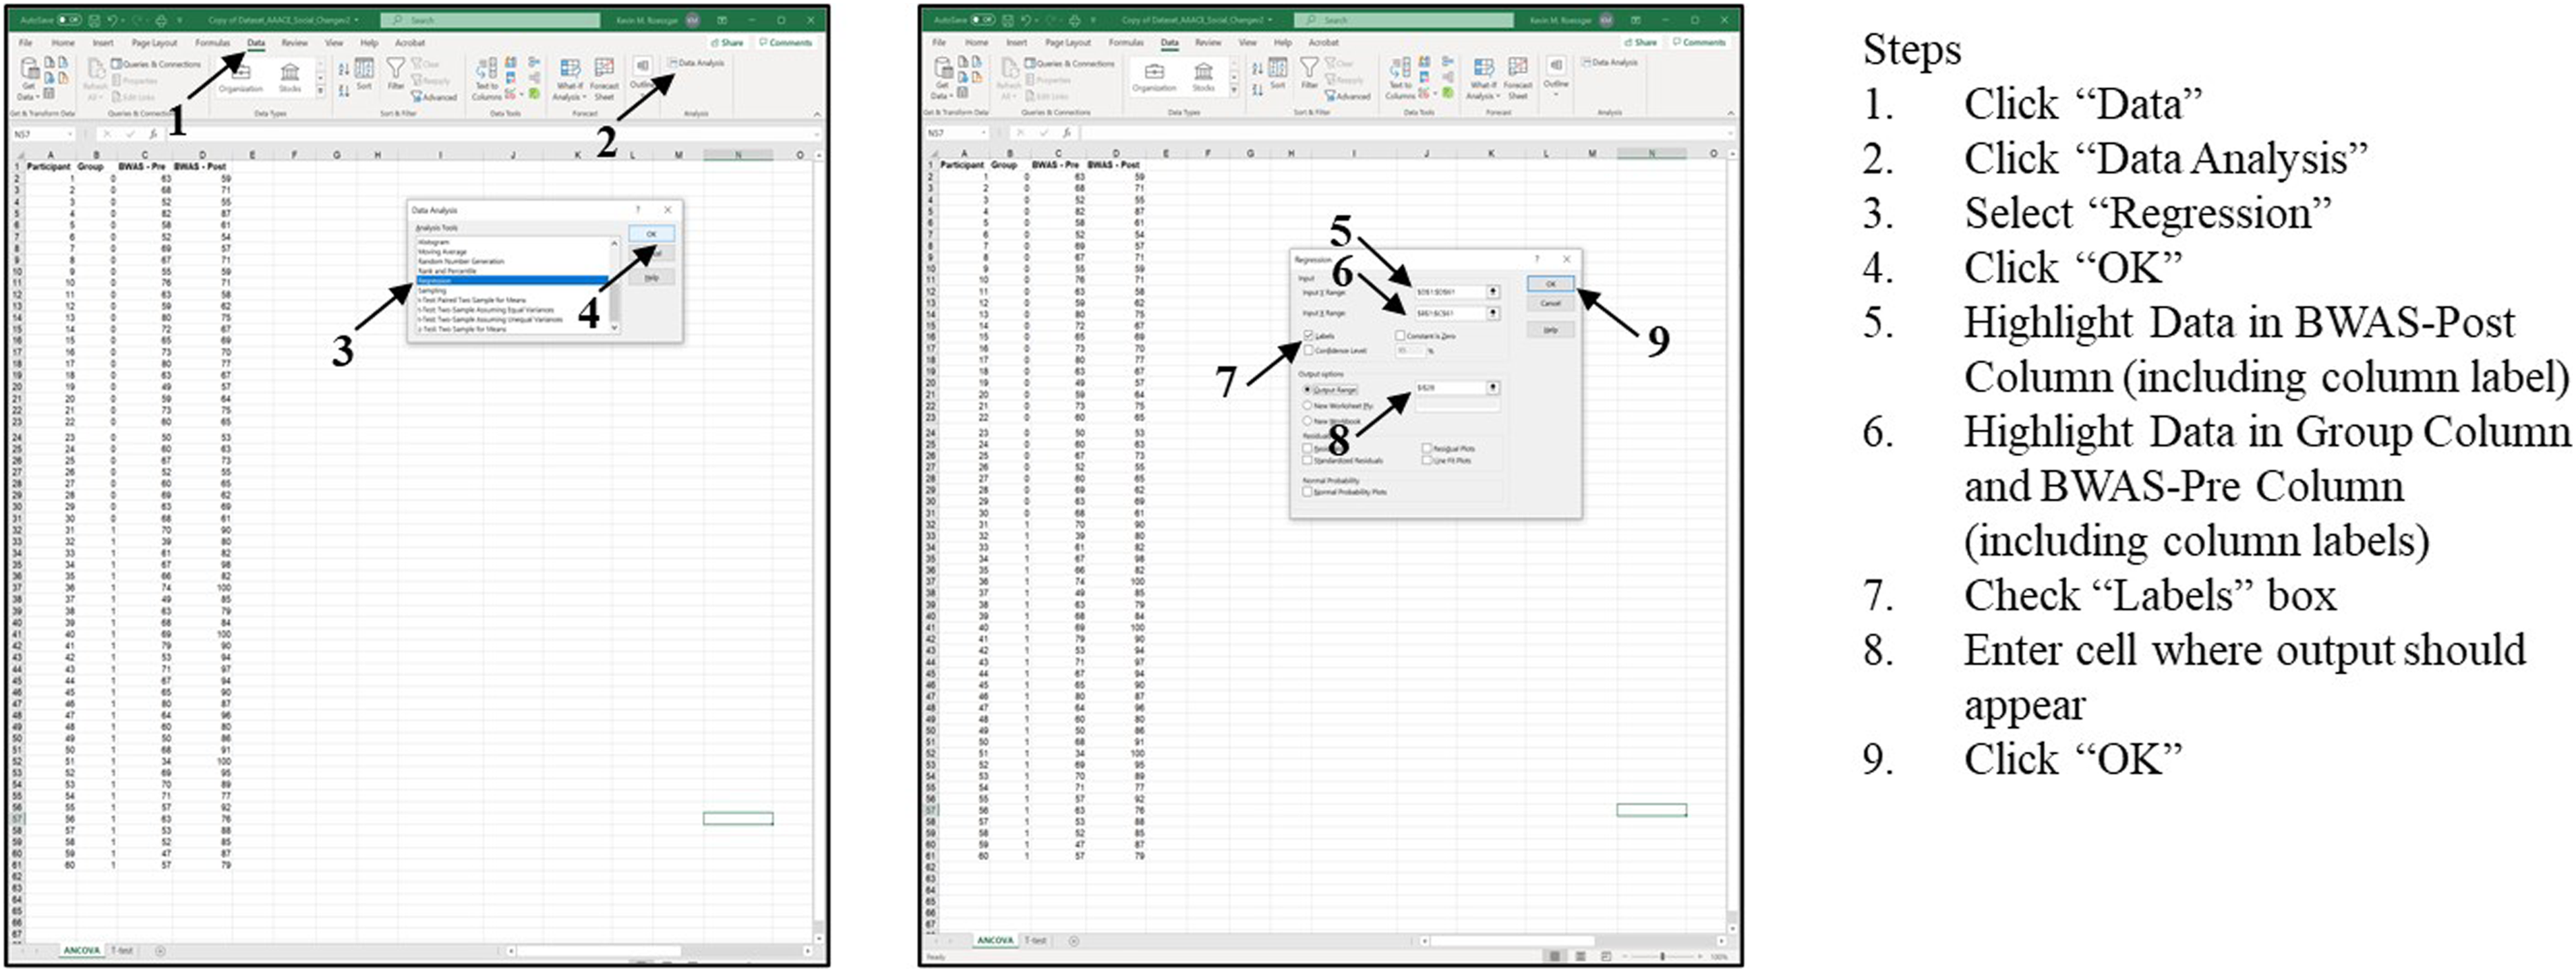
Examining Figure 7, we see three output tables. Although each contains critical information (see Table 1 for a resource to interpret more of this information), one set of statistics allows Blake to understand and interpret the magnitude of BWAS-post differences between groups. Next to Group, Blake finds its associated regression coefficient (b = 24.19) telling them participants (Group = 1) scored on average 24.19 points higher on BWAS-post measures after controlling for pretest scores. To the right, they find its associated t-statistic and p-value (t = 13.73, p < .001), the latter telling Blake to reject the null hypothesis, so they conclude differences in BWAS-posttest scores are likely caused by participation in the workshop. Output for workshop group differences using regression in MS Excel.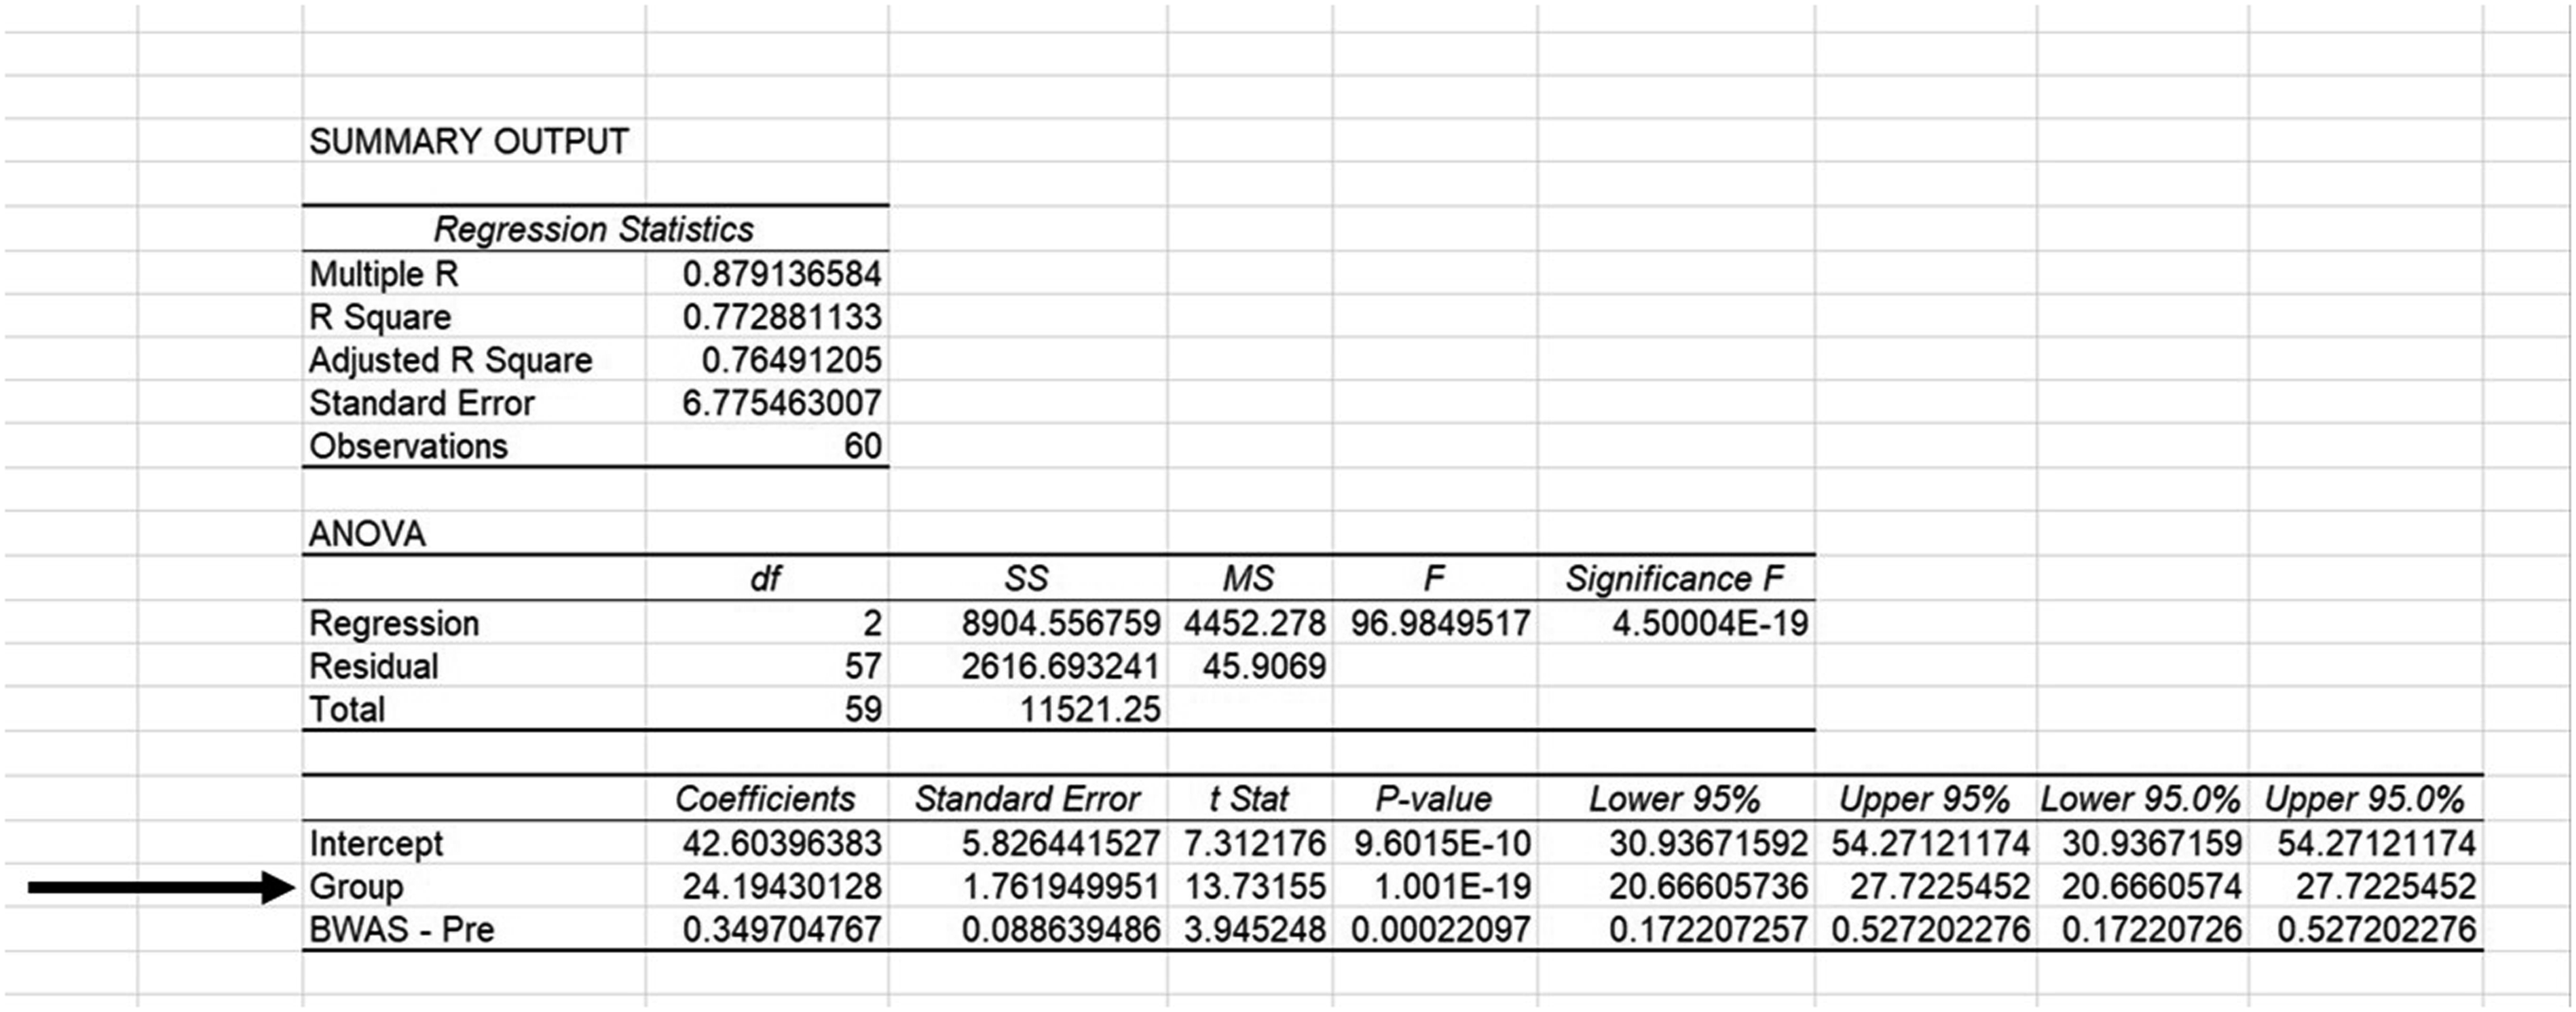
Sharing Results
DEI training programs like those described here are increasingly under scrutiny, perhaps especially in formal education settings. In Iowa, for example, the Board of Regents has halted implementation of new DEI programs while a review of existing programs is conducted due to rising pressure from state legislators (Akin, 2023). For practitioner DEI educators like Mia and Blake, evaluating their trainings with robust methods like those described here could help them advocate for keeping programs that result in desirable behavior or attitudinal change within their organizations. In fact, quantitative methods like those described here represent the highest level of training evaluation according to Kirkpatrick and Kirkpatrick (2016) because they make a persuasive argument that desired outcomes resulted from participating in training.
Practitioners who achieve this type of result can advance DEI within their organizations by sharing their results. One important step is for the educator to consider how best to display results so their coworkers can easily interpret them. In the examples described here, creating a bar graph with error bars in Excel would be a good choice (see Table 1 for an instructional video). The bar graph will visually show the difference between group scores. This chart could be incorporated in an infographic about the training, demonstrating the link between its learning objectives and outcomes. The infographic could then be shared on internal social media groups like Yammer, or included in routine emails that share organizational news. Ideally, it should also be shared with people in organizational leadership roles because these people are the most likely able to approve funding or dedicate employee time to participate in future DEI programs.
Footnotes
Declaration of Conflicting Interests
The author(s) declared no potential conflicts of interest with respect to the research, authorship, and/or publication of this article.
Funding
The author(s) received no financial support for the research, authorship, and/or publication of this article.