
Abstract
Nosemosis, caused by Vairimorpha (Nosema) ceranae or V. (Nosema) apis, is the main fungal disease affecting the Western honey bee (Apis mellifera). We evaluated the use of histology in the diagnosis of disease, identified the histologic patterns, and compared the efficacy of different staining techniques. We sampled 10 hives, collecting ~80 bees per hive. Spore counts were performed on 60 bees per sample using a hemocytometer in accordance with the standard procedure. Slides of whole bees were produced from the remaining bees, stained with 15 different techniques, and observed under a light microscope at 400×. Infection in the ventriculus was graded using hematoxylin–phloxine–saffron stain; prevalence and severity of the infection were determined; and an intra-class coefficient (ICC) was calculated to correlate the histologic results with the standard counting method. Based on contrast, specificity, and sensitivity, we found hot Gram chromotrope and Ziehl–Neelsen stains offered the best approach for highlighting Vairimorpha spores. These stains were optimized to find the ideal staining times for Vairimorpha by testing different immersion durations in key steps to enhance spore contrast. There was a notable association between histologic observations and spore count, with an ICC of 0.74 (95% CI [0.36, 0.91]) and 0.82 (95% CI [0.54, 0.93]) for the percentage of infected bees and histologic grade, respectively. Lesions included distension of ventricular epithelial cells, intracellular microsporidia, reduced ciliation, and disintegration of the peritrophic membrane. No spores were detected in extra-ventricular organs.
Western honey bees (Apis mellifera) are domesticated insects valued for the honey they produce, but also as key pollinators, contributing to food safety, biodiversity, and the economy. 18 Over the past 20 y, the decline of bees has been alarming. 13 Multiple causes, including climate change, habitat destruction, pesticide use, and emerging diseases, are likely related to this pressing issue. Nosemosis is the principal fungal disease affecting Western honey bees and contributing to colony collapse. 5 Two microsporidian species have been identified as causative agents of this disease: Vairimorpha (previously Nosema 32 ) apis and V. (Nosema) ceranae.
Nosemosis infections are often subclinical, which complicates diagnosis. 5 When present, clinical signs vary depending on the causative agent. Infections caused by V. apis may result in distinctive milky-white midguts, swollen abdomens, and dysentery. In contrast, V. ceranae infections are typically less obvious and may lead to immunosuppression, energy stress, and poor colony development. The diversity of clinical presentations remains poorly understood, and to our knowledge, no histopathologic differences have been identified to date between the 2 infections. 15
Bees become infected by ingesting spores in water or food, or as they clean contaminated hive structures. 5 The ingested spores germinate and develop in the honey bee ventriculus, or midgut, where the spore polar tubule extrudes, pierces the membrane of the epithelial cells, and injects its contaminating content: the sporoplasm. The sporoplasm undergoes multiple divisions within the cytoplasm of the infected ventricular cells, and then further divides, forming additional spores. The produced spores then can infect adjacent cells or be released into the intestinal lumen. Spores in the lumen are excreted with the feces and may infect other bees. In the environment, the spores are highly resistant and can survive for 5–6 wk in dead bees, 2–4 mo in honey, and a year or more in feces. 3 The cycle continues, and the number of spores within cells rapidly increases, thus leading to the death of many cells and the degeneration of the ventricular epithelium.5,12
Histologically, the ventriculus has 3 distinct layers: the muscle layer, the mucosa, and the peritrophic membrane. 12 The external layer comprises striated muscle cells oriented in 3 directions: longitudinal, oblique, and annular. The middle layer, or mucosa, consists of simple cuboidal-to-columnar epithelial cells, with scattered goblet cells, neuroendocrine cells, and regenerative cells. 20 The latter, located basally, are stem cells encased apically by tall columnar secretory cells. The basement membrane is enveloped by thin layers of circular and longitudinal muscles. The peritrophic membrane, made up of chitin and proteins, forms a protective layer that surrounds food boluses within the gut. Ventricular epithelial cells infected by Vairimorpha spp. are distended by intracellular edema and abundant spores. 12 As the secretory cells die and desquamate in an unbalanced fashion, the gut wall becomes uneven. Cells may also show other signs of degeneration and necrosis, such as hyperchromatic or pyknotic nuclei. In the absence of secretory activity, the peritrophic membrane is reduced or disappears.12,15 Nutrients can no longer be adequately digested, and the bee starves.
The current method used in apiculture to diagnose nosemosis involves manually counting spores from the bees’ gut with a hemocytometer. 11 An estimate of the number of spores per bee is then calculated, reflecting the severity of the infection within the hive. This microscopic method is based on a procedure first developed in 1970. 4 However, the reliability of the spore counting method has been questioned, as it is not always correlated with clinical signs.16,25
Because bees are central to pollination, mitigating the deleterious effects of nosemosis on honey bee colonies is crucial. New diagnostic methods and further research into the parasite tissue tropism may help improve our understanding of the parasite life cycle. Our purpose was to describe the histologic patterns of the disease and identify the affected organs while determining if histologic results could reliably assess the severity of the infection. Another objective was to compare different histologic special stains to determine the best approach for observing Vairimorpha spp. spores.
Materials and methods
Animal collection and spore counting
Insects are not covered by the Canadian Council for Animal Care Guidelines, but ethical considerations were taken throughout the study. We included 4 beeyards in Saint-Hyacinthe (Quebec, Canada). Between June and September 2015, we sampled 10 hives, collecting ~80 bees from each. The bees were euthanized in a 70% ethanol solution, and 60 bees were used to calculate the infection level of the colony using the standard method: the manual counting of the spores under light microscopy. 11 Briefly, the guts of the bees were removed with tweezers and crushed with a mortar and pestle. They were then added to 60 mL of water to create a solution of 1 mL/bee. Finally, spores in a sample of the solution were observed in a hemocytometer with a light microscope, and an estimate of the number of spores per bee was obtained.
Histology
The remaining bees (at least 20) from each sample were processed for the production of histologic slides, as described elsewhere.
23
Briefly, they were placed into a Schaffer solution (1 part 37% formalin, 2 parts 90% ethanol) modified to add depilatory cream (Nair; Church & Dwight) at a 1:1 ratio (Schaffer:Nair). Bees were then placed in a tissue processor for 24 h, 14 of the 24 h with a fixing agent: a modified Bouin solution (1-part glacial acetic acid, 4-parts 37% formalin, 12-parts 80% ethanol). Paraffin blocks were made using standard methods and then immersed in an emollient product (Histoheme; Polysciences) for 10 min. Slides were cut (3 µm) and stained with hematoxylin–phloxine–saffron (
On each slide of a transverse section of a bee, the entire ventricular surface was observed to ensure comprehensive evaluation. The length of the ventricular mucosa examined histologically was similar across different bees, as sections were standardized to cover the whole ventriculus in a single section. The ventriculus was examined and bees were classified as infected or not, based on the presence of spores. Sections of all infected bees were further scrutinized under the microscope, with particular attention to the hypopharyngeal glands, mandibular glands, post-cerebral glands, wax glands, crop, proventriculus, ventriculus, Malpighian tubules, small intestine, rectum, and fat bodies. A control group with an identical number of uninfected bees went through the same process. Depending on the amount of the ventricular surface covered by spores, the lesions in infected bees were differentiated as either grade 1 (<30% of the surface covered by spores), grade 2 (30–80%), or grade 3 (>80%).
Statistical analysis
The data were first normalized to obtain a common scale among the variables. Histologic diagnosis and infection severity assessment were compared with the standard microscopic method in 2 ways. First, the correlation between the percentage of infected bees and the number of spores per bee was calculated. Second, for each hive, a common grade of infection was obtained by adding the grades of the infected bees and dividing by the number of sampled bees. The correlation between the common grade of infection and the number of spores per bee was also calculated. To assess the correlation between these 2 procedures, relying on histology and the reference microscopic method, the intra-class coefficients (
Special stains
The following stains were tested to verify which one(s) best highlighted the spores: periodic acid–Schiff, 17 Grocott methenamine silver, 22 Warthin–Starry, 30 Fite–Faraco, 22 Giemsa, 14 Giemsa for parasite, 2 Gram Goodpasture, 17 toluidine blue, 22 Prussian blue, 30 Masson trichrome, 22 methyl green–pyronin, 21 Ziehl–Neelsen, 7 Luna stain for eosinophils, 21 and hot Gram chromotrope. 26 The stains were compared qualitatively and semi-quantitatively, based on their contrast (weak, medium, strong), sensitivity (percentage of stained spores in 10 microscopic fields at 400×), and specificity (weak, medium, strong; based on the presence of nonspecific staining).
Two special stains were selected for further optimization. Different immersion times were hence tested for the hot Gram chromotrope
26
and Ziehl–Neelsen
7
methods to adjust the intensity of the dyes (
Hot Gram chromotrope staining protocol for Vairimorpha spores in honeybee samples.
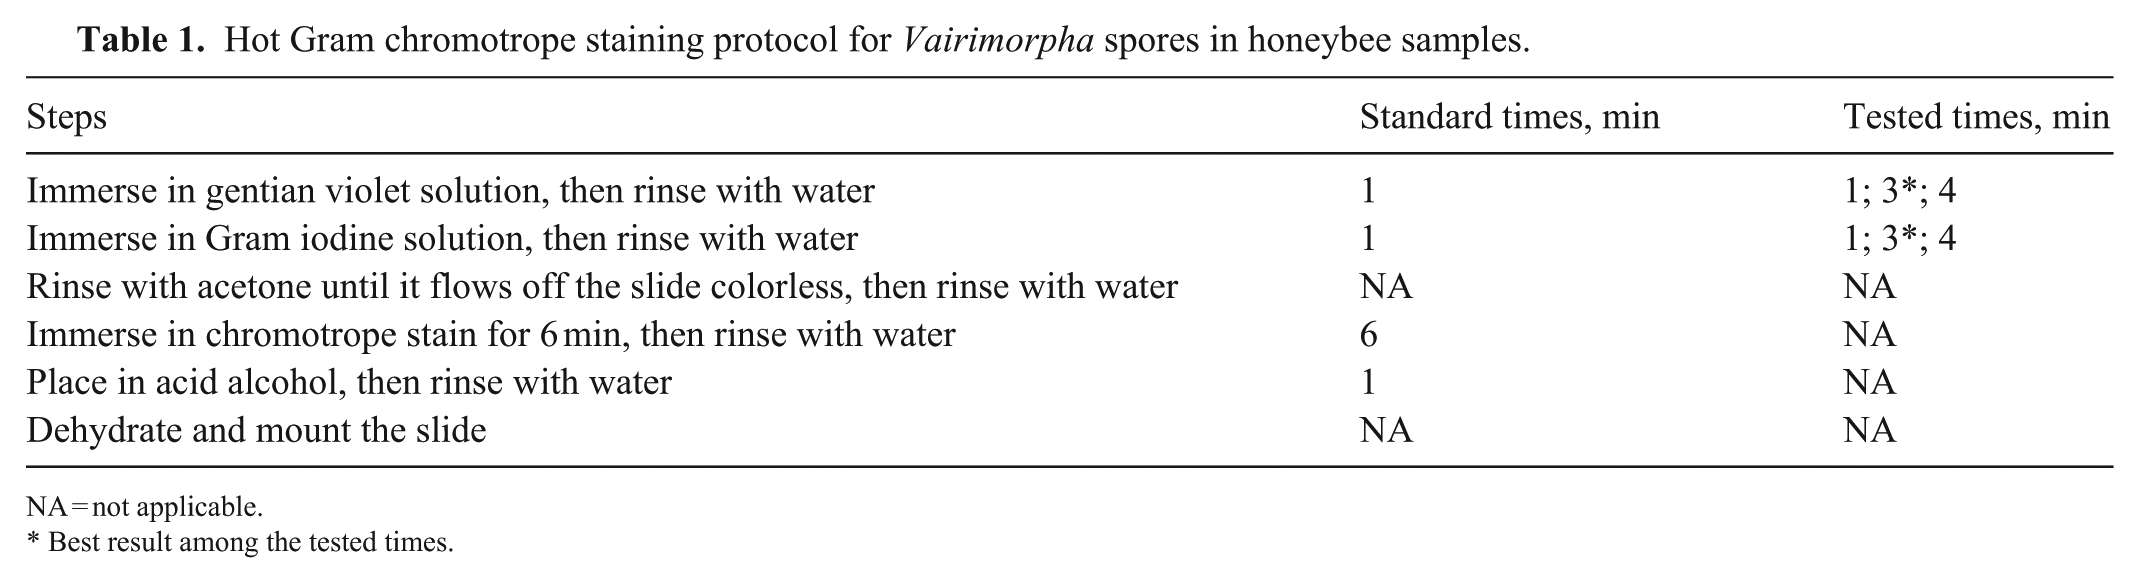
NA = not applicable.
Best result among the tested times.
Ziehl–Neelsen staining protocol for Vairimorpha spores in honey bee samples.
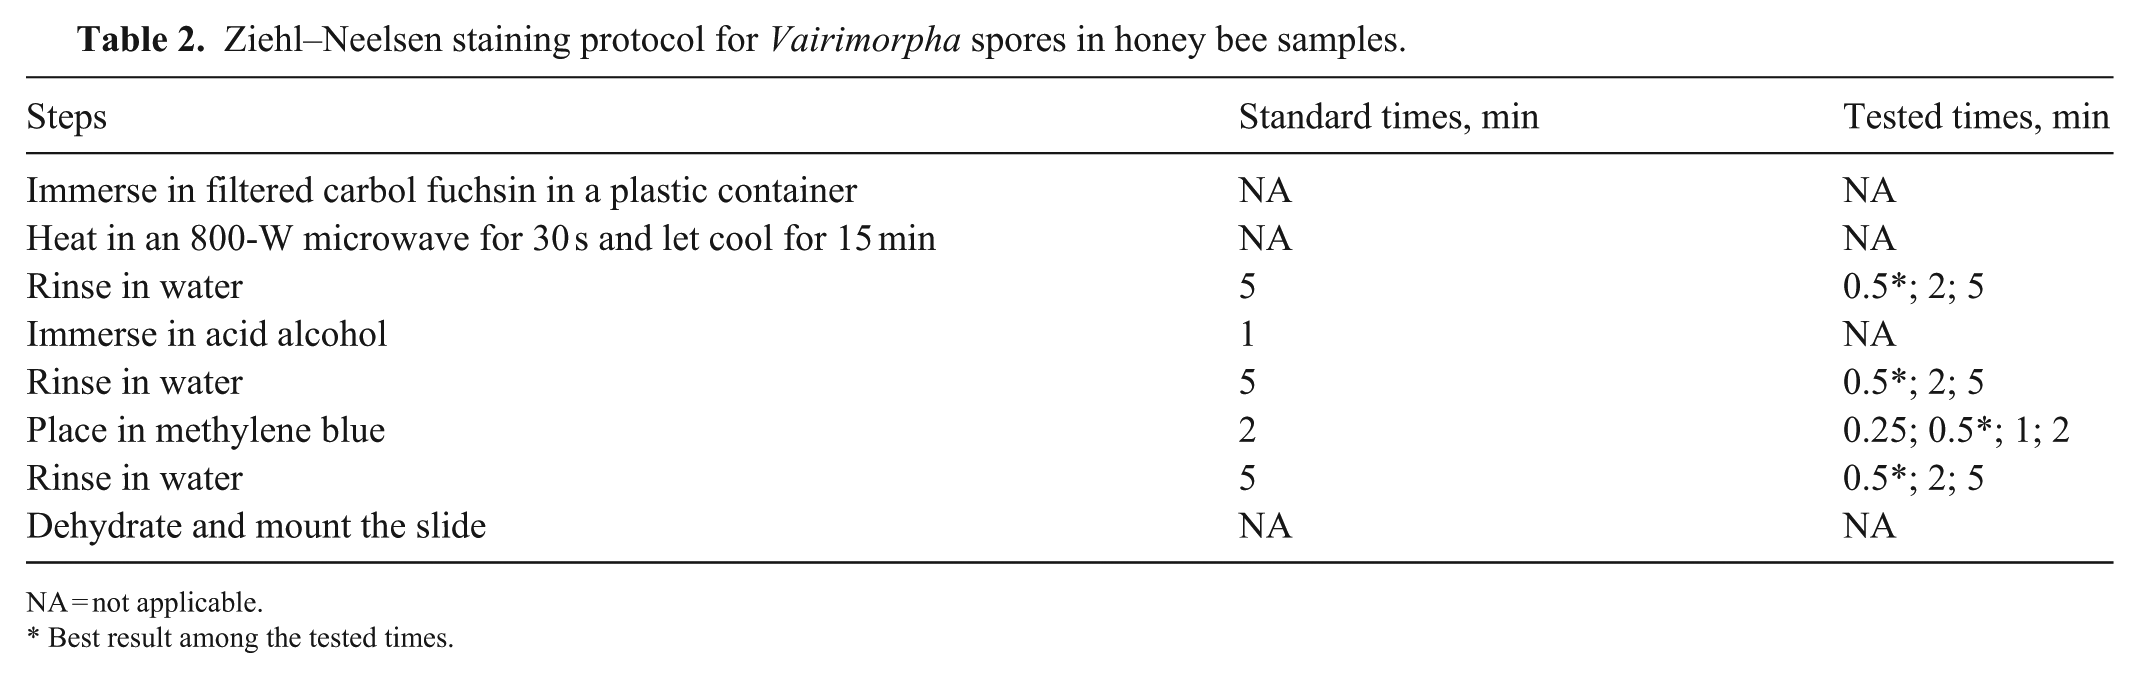
NA = not applicable.
Best result among the tested times.
Immerse the slide with gentian violet solution for 1 min, then rinse with water.
Immerse the slide with Gram iodine solution for 1 min, then rinse with water.
Rinse with acetone until it flows off the slide colorless, then rinse with water.
Immerse the slide in chromotrope stain for 6 min, then rinse with water.
Place in acid alcohol for 1 min, then rinse with water.
Dehydrate and mount the slide.
The immersion times in gentian violet and Gram iodine solution (steps 1, 2) were tested and adjusted. Times of 1, 3, and 4 min were tested.
The Ziehl–Neelsen stain was optimized as follows:
Immerse the slide with filtered carbol fuchsin in a plastic container. Heat in an 800-W microwave for 30 s and let cool for 15 min.
Rinse 5 min in water.
Immerse the slide in acid alcohol for 1 min.
Rinse 5 min in water.
Place the slide in methylene blue for 2 min.
Rinse 5 min in water.
Dehydrate the slide by immersing it for 1 min in 95% ethanol, followed by 2 immersions of 1 min each in 100% ethanol. Let dry and mount the slide.
For the immersion time in methylene blue (step 5), times of 15 s, 30 s, 1 min, and 2 min were tested. Shorter rinsing times of 30 s and 2 min were also tested for steps 2, 4, and 6 to make the method more efficient.
Results
Spore counts and histology
The number of spores counted with the hemocytometer in each hive was 0–1.6 × 10⁶ spores/bee (
Comparison of Vairimorpha spores count in honey bee samples with histologic results.
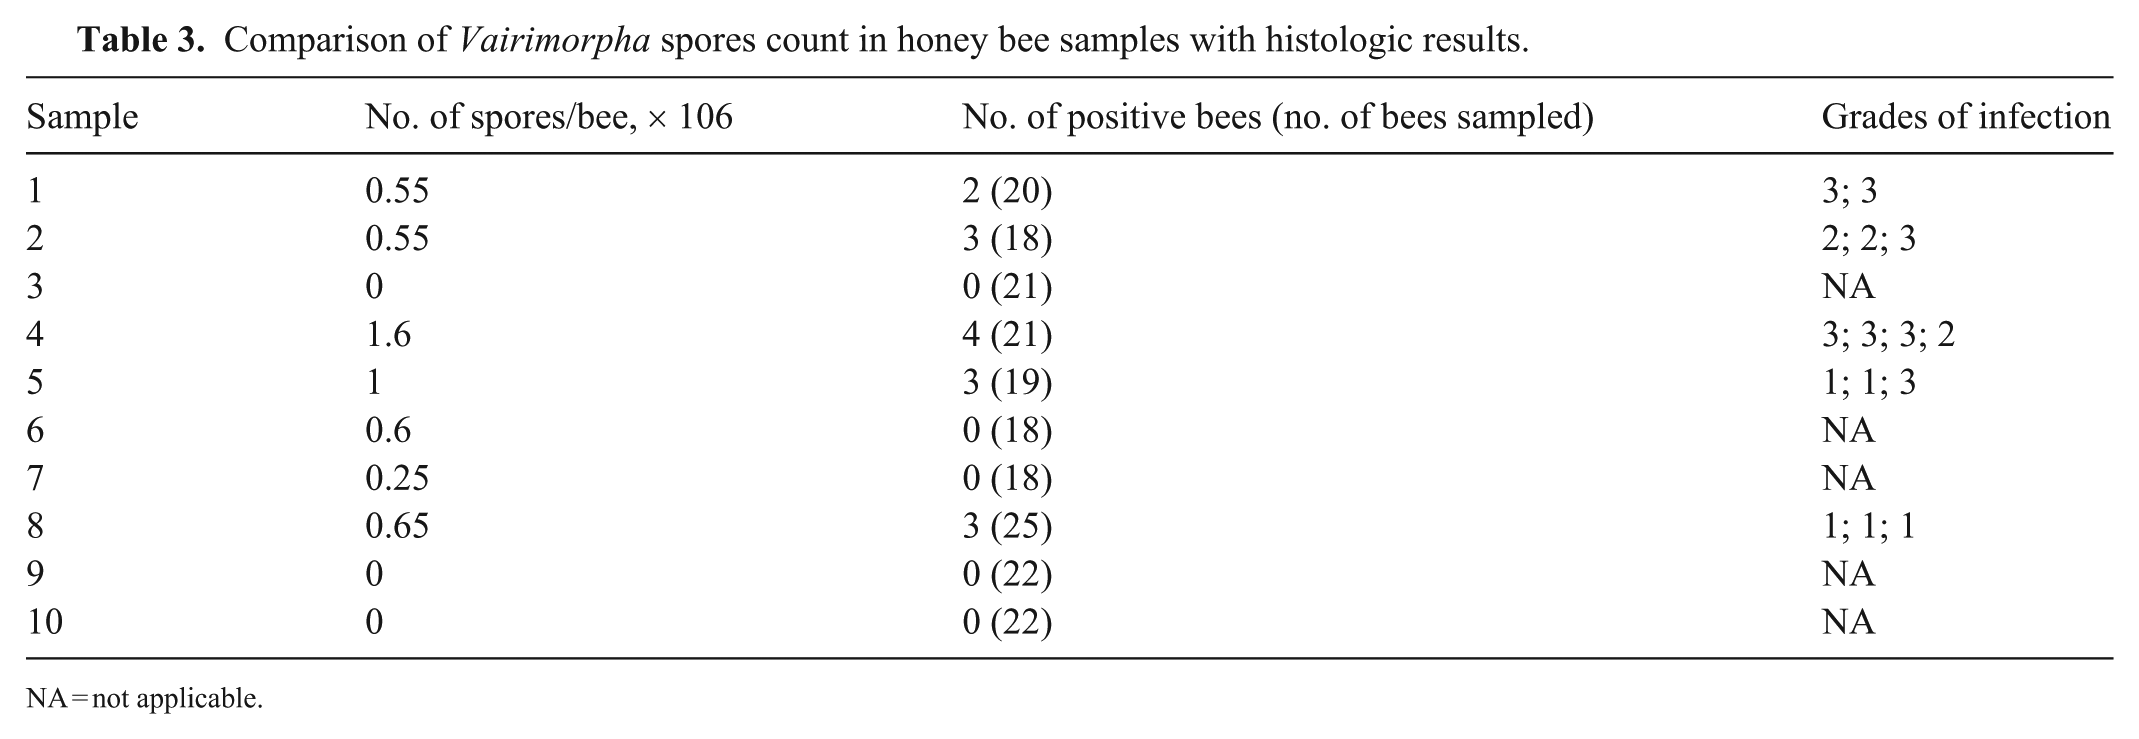
NA = not applicable.
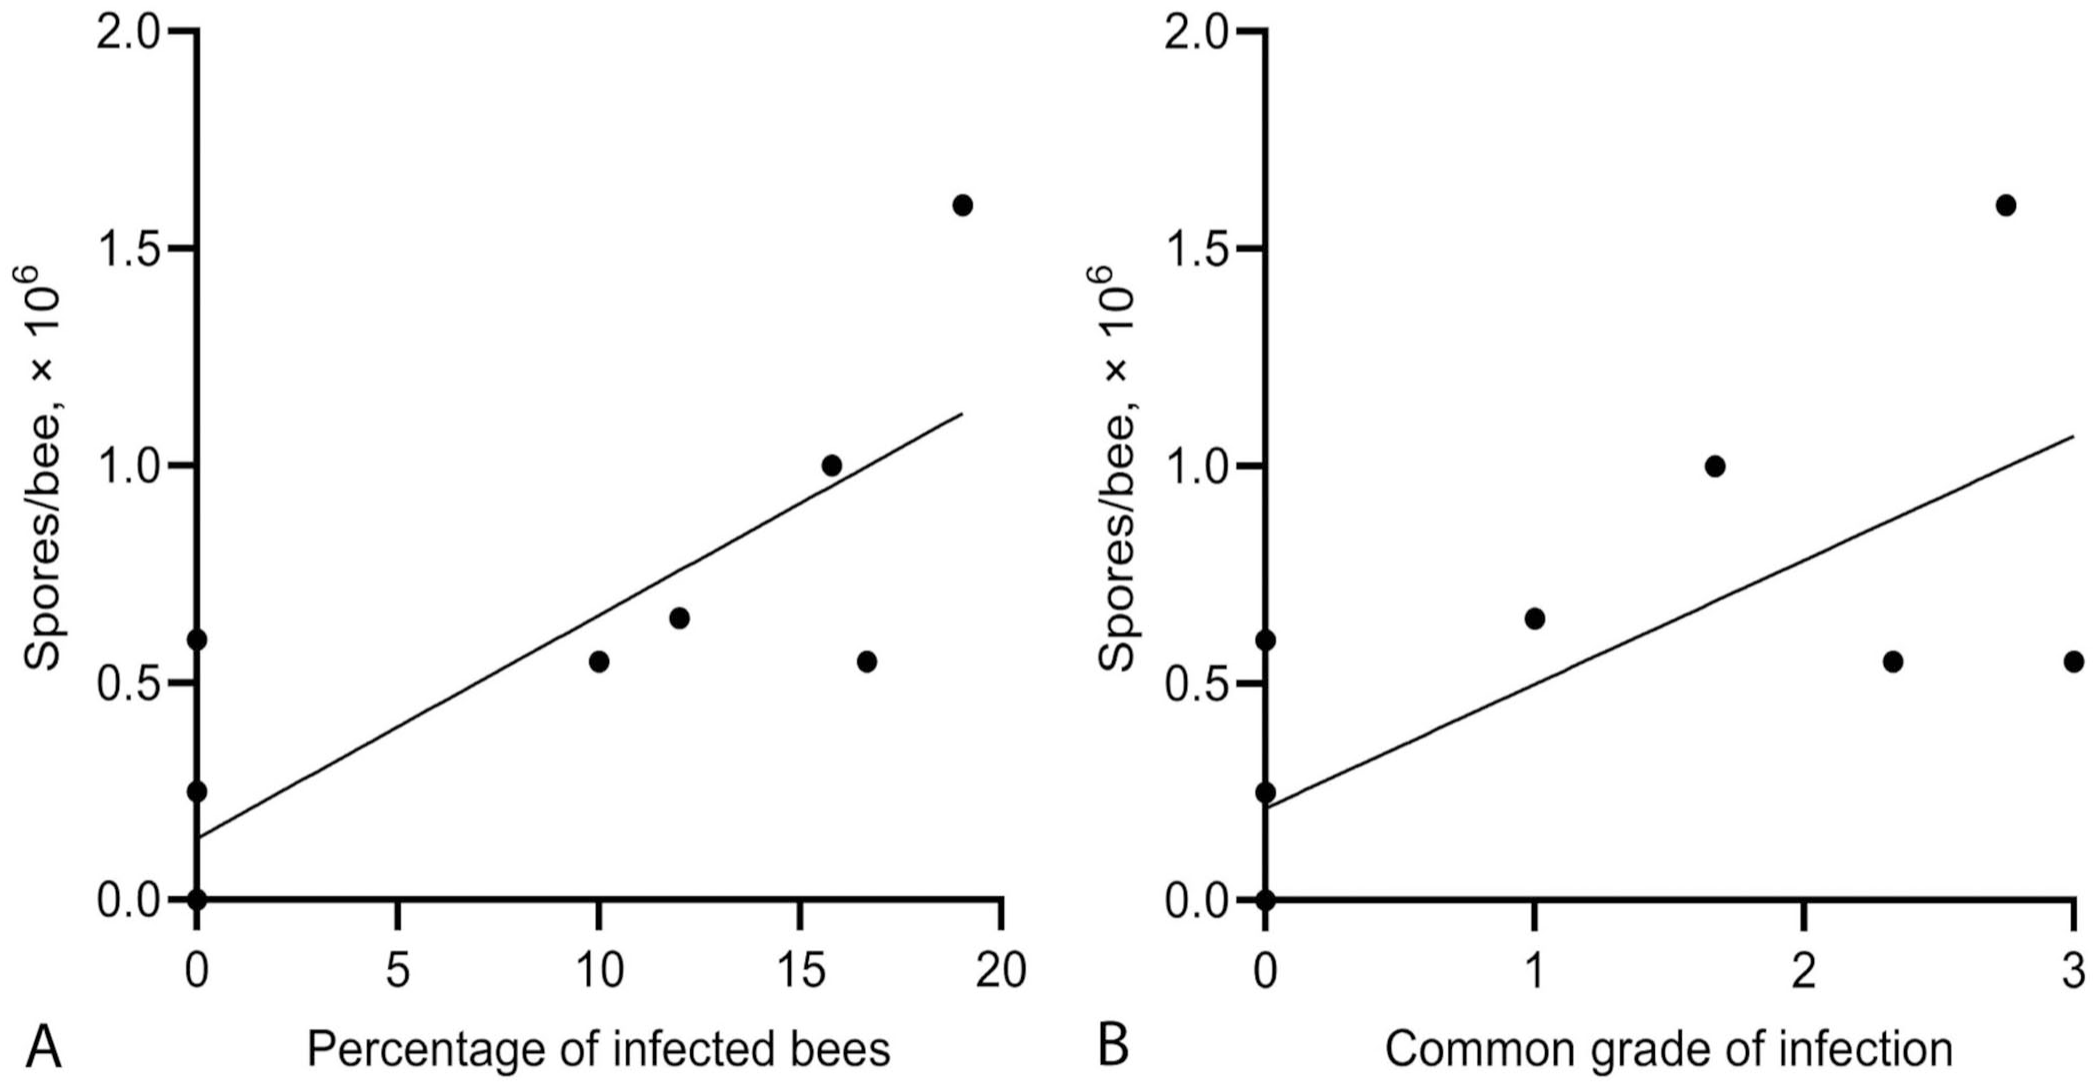
Correlation between the standard counting method and histologic analysis of bees infected by Vairimorpha spp.
Among the 15 positive bees, 5 had a grade 1 infection, 3 had a grade 2 infection, and 7 had a grade 3 infection. The ICC between the common grade and the number of spores per bee was similar between the 2 methods (ICC = 0.82, 95% CI [0.54, 0.93];
The histologic lesions included distension of ventricular epithelial cells, numerous microsporidia in vegetative and spore forms, reduced ciliation of the cells, and disintegrated peritrophic membranes (
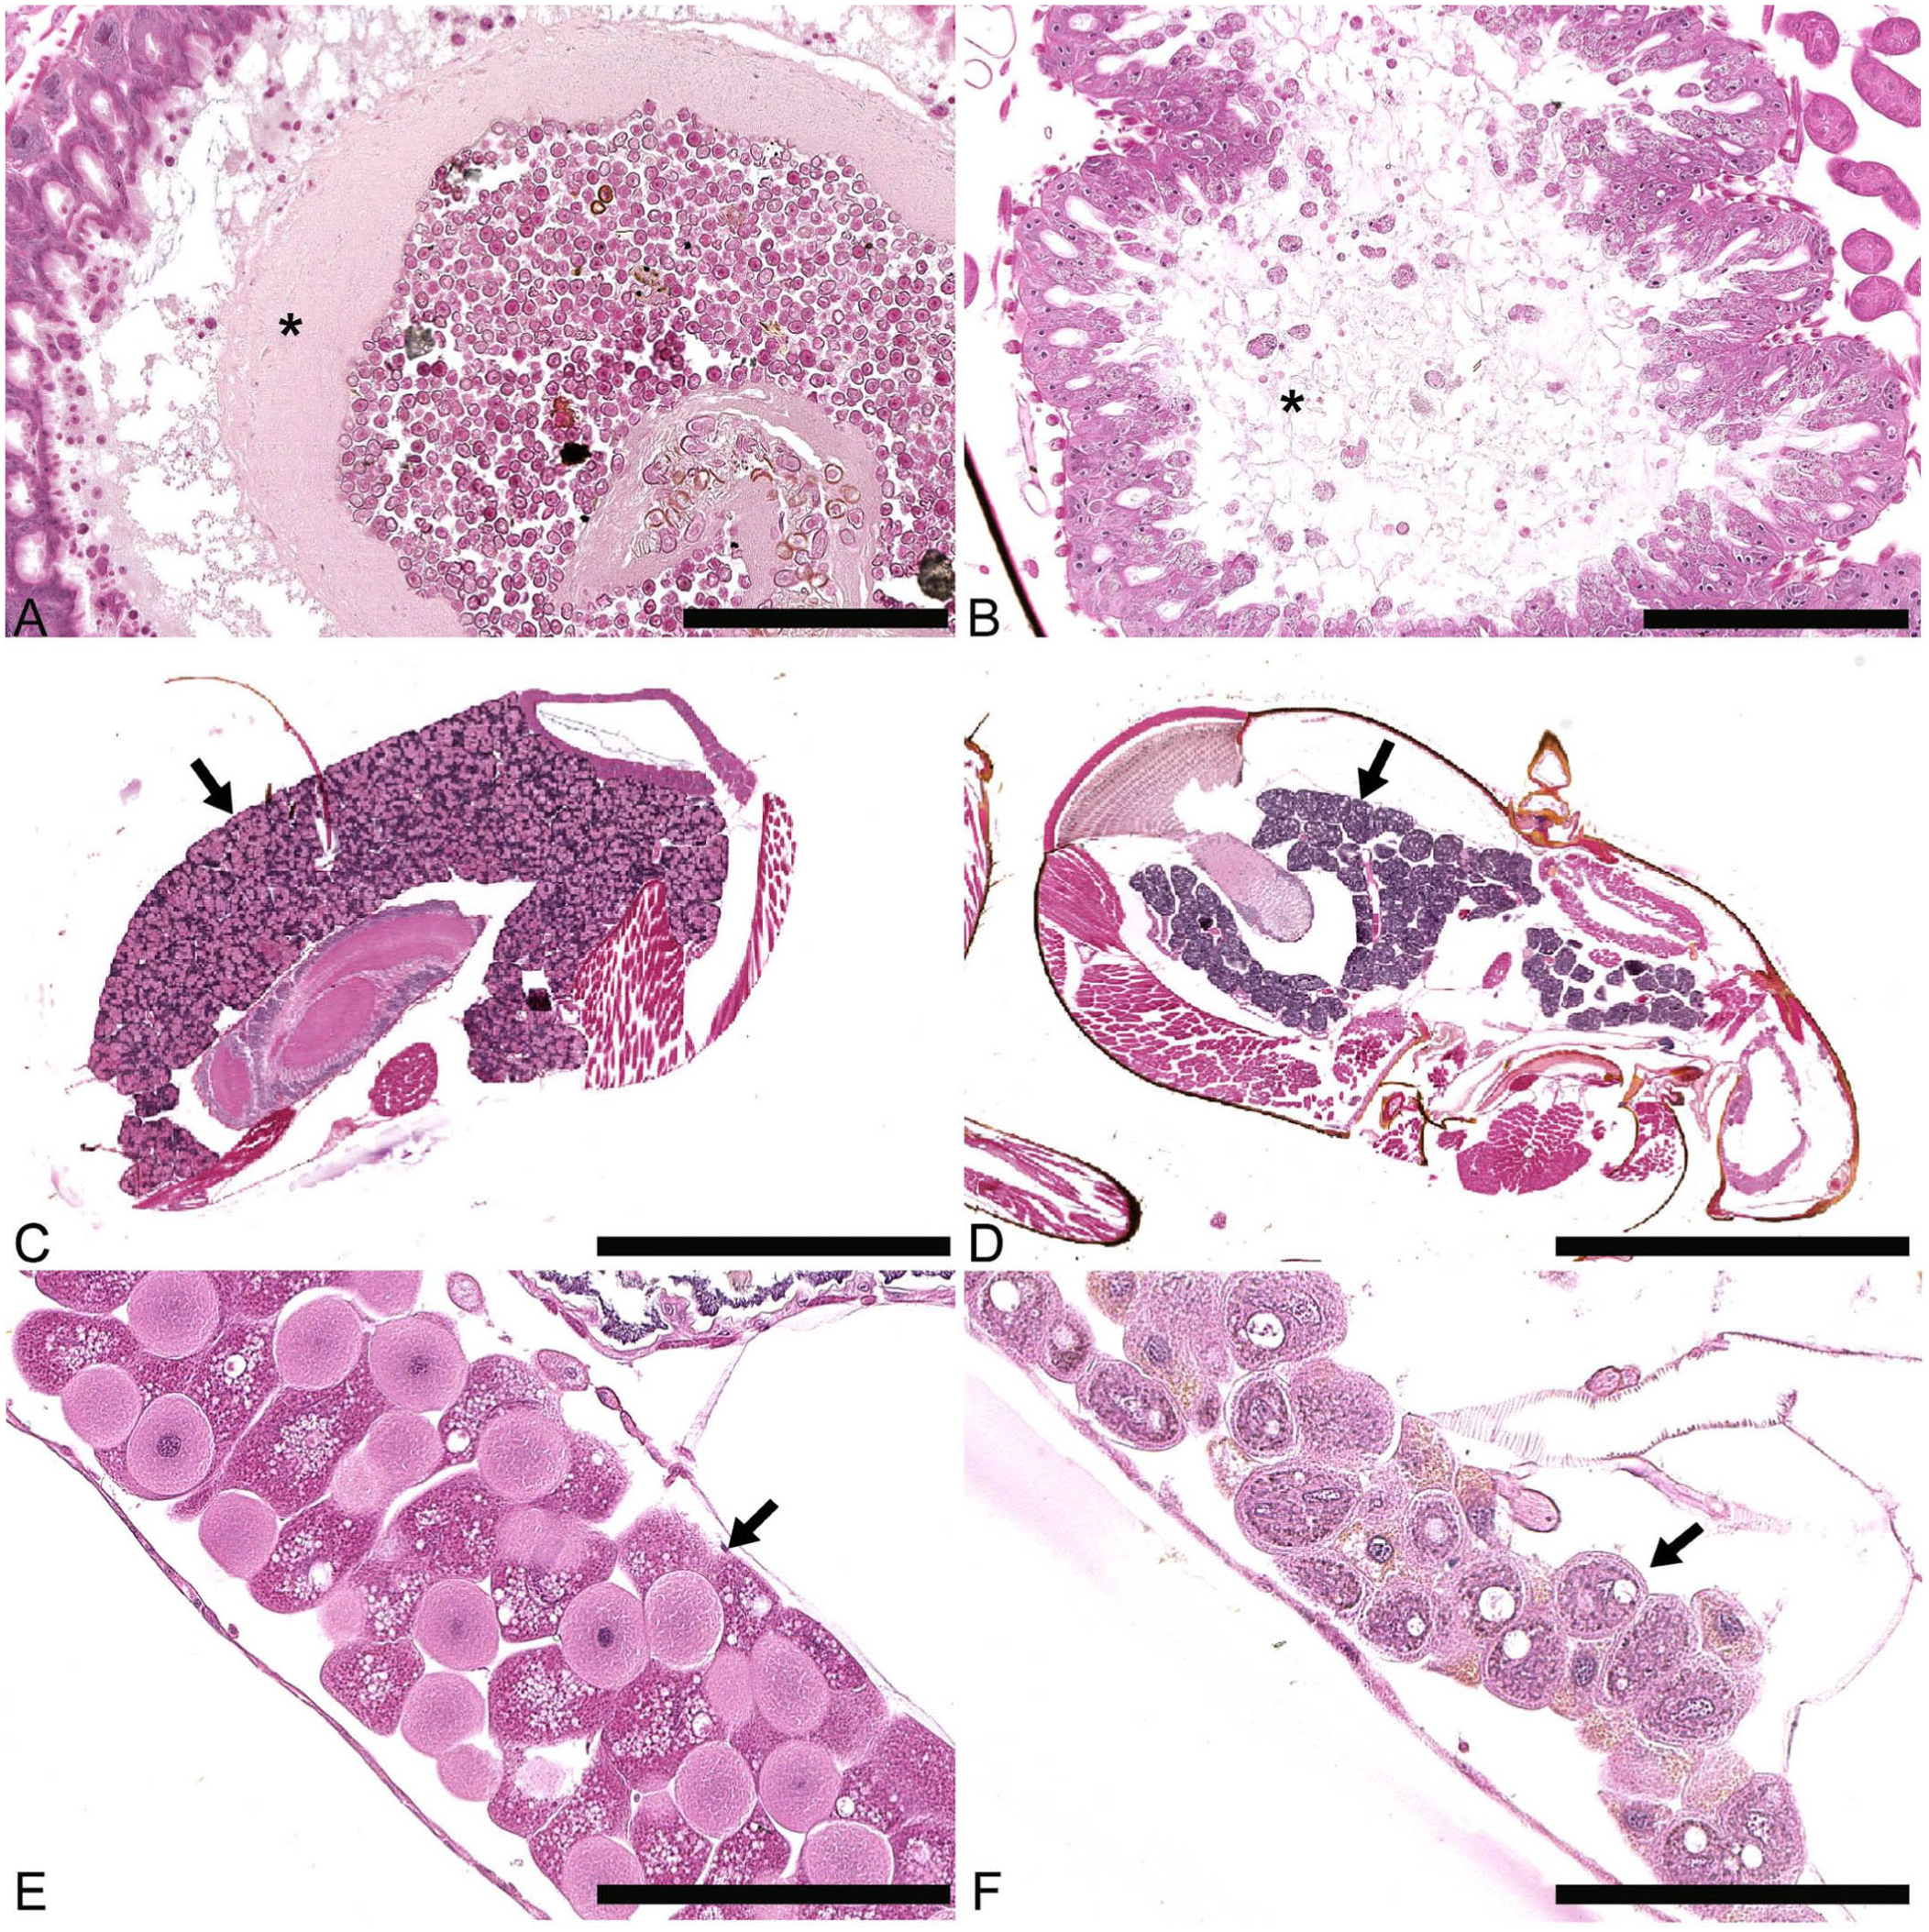
Histopathologic features of Vairimorpha spp. infections in foraging honey bees (transverse sections). The images on the left are from healthy control bees; those on the right are from infected bees. Hematoxylin–phloxine–saffron (HPS).
Special stains
Of all of the special stains tested, the hot Gram chromotrope technique gave the best results based on the qualitative and semi-quantitative evaluation criteria: contrast, sensitivity, and specificity (
Staining properties of selected special stains positive for Vairimorpha spores in honey bee ventriculus.
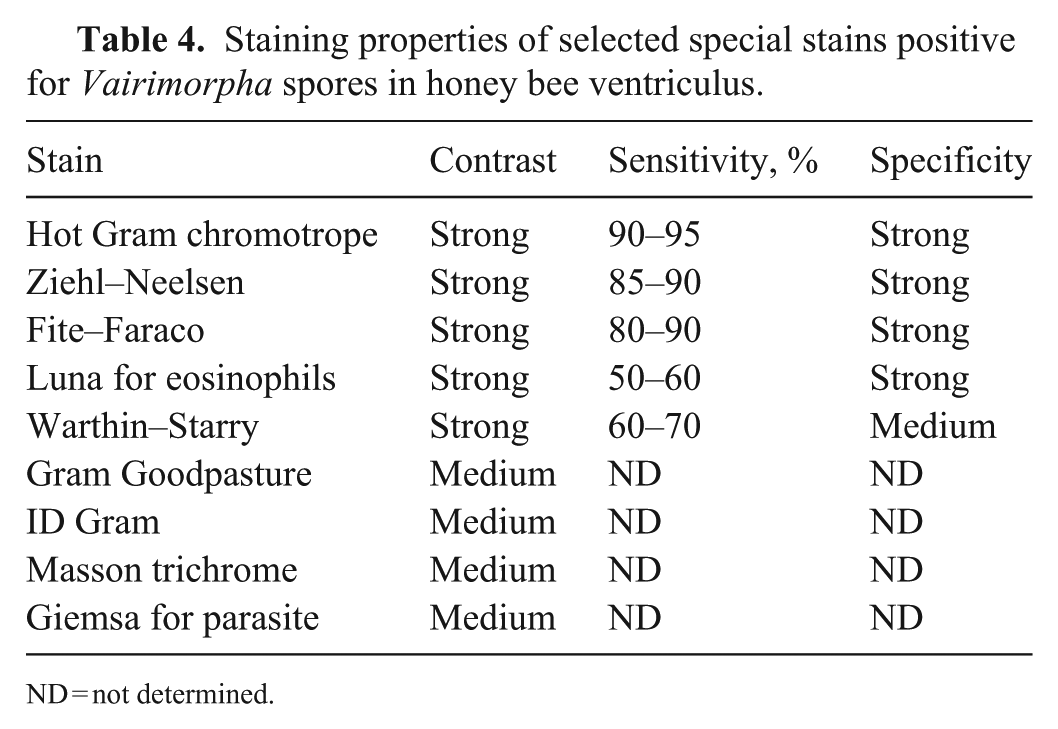
ND = not determined.
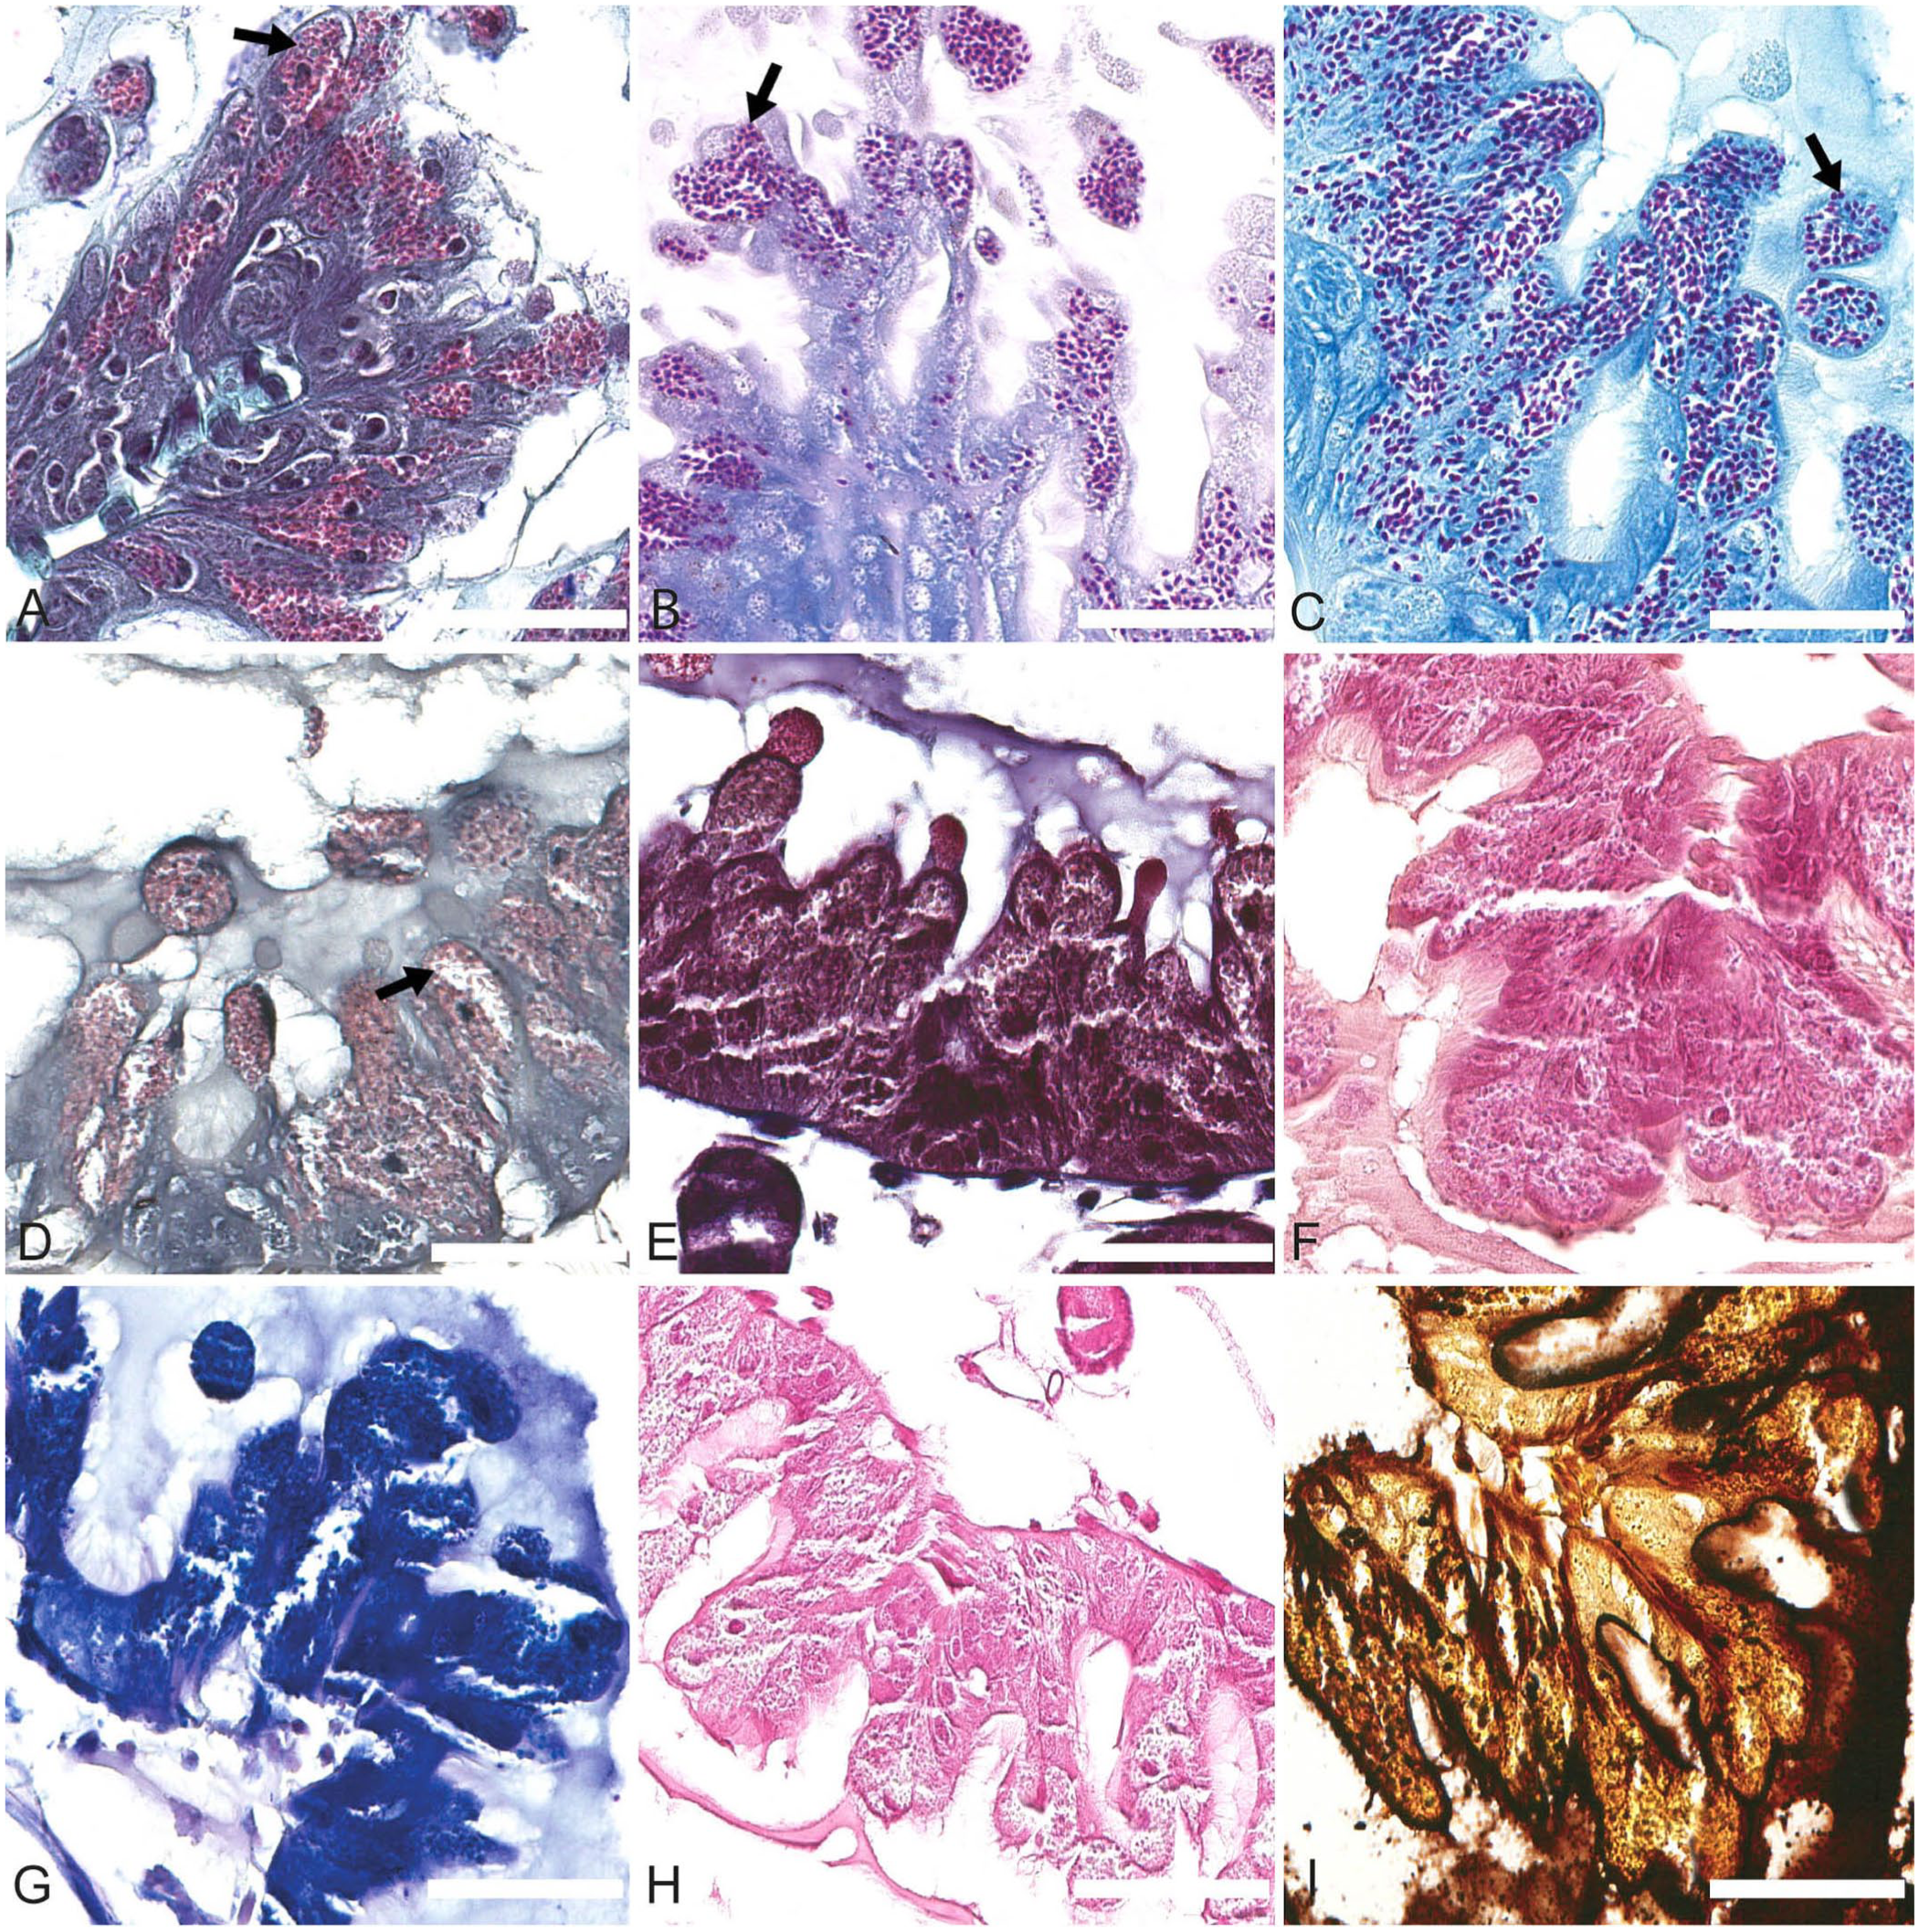
Special stains tested for Vairimorpha spp. staining in transverse sections of the honey bee ventriculus. Arrows point to spores clearly revealed by the staining technique. Bars = 60 μm.
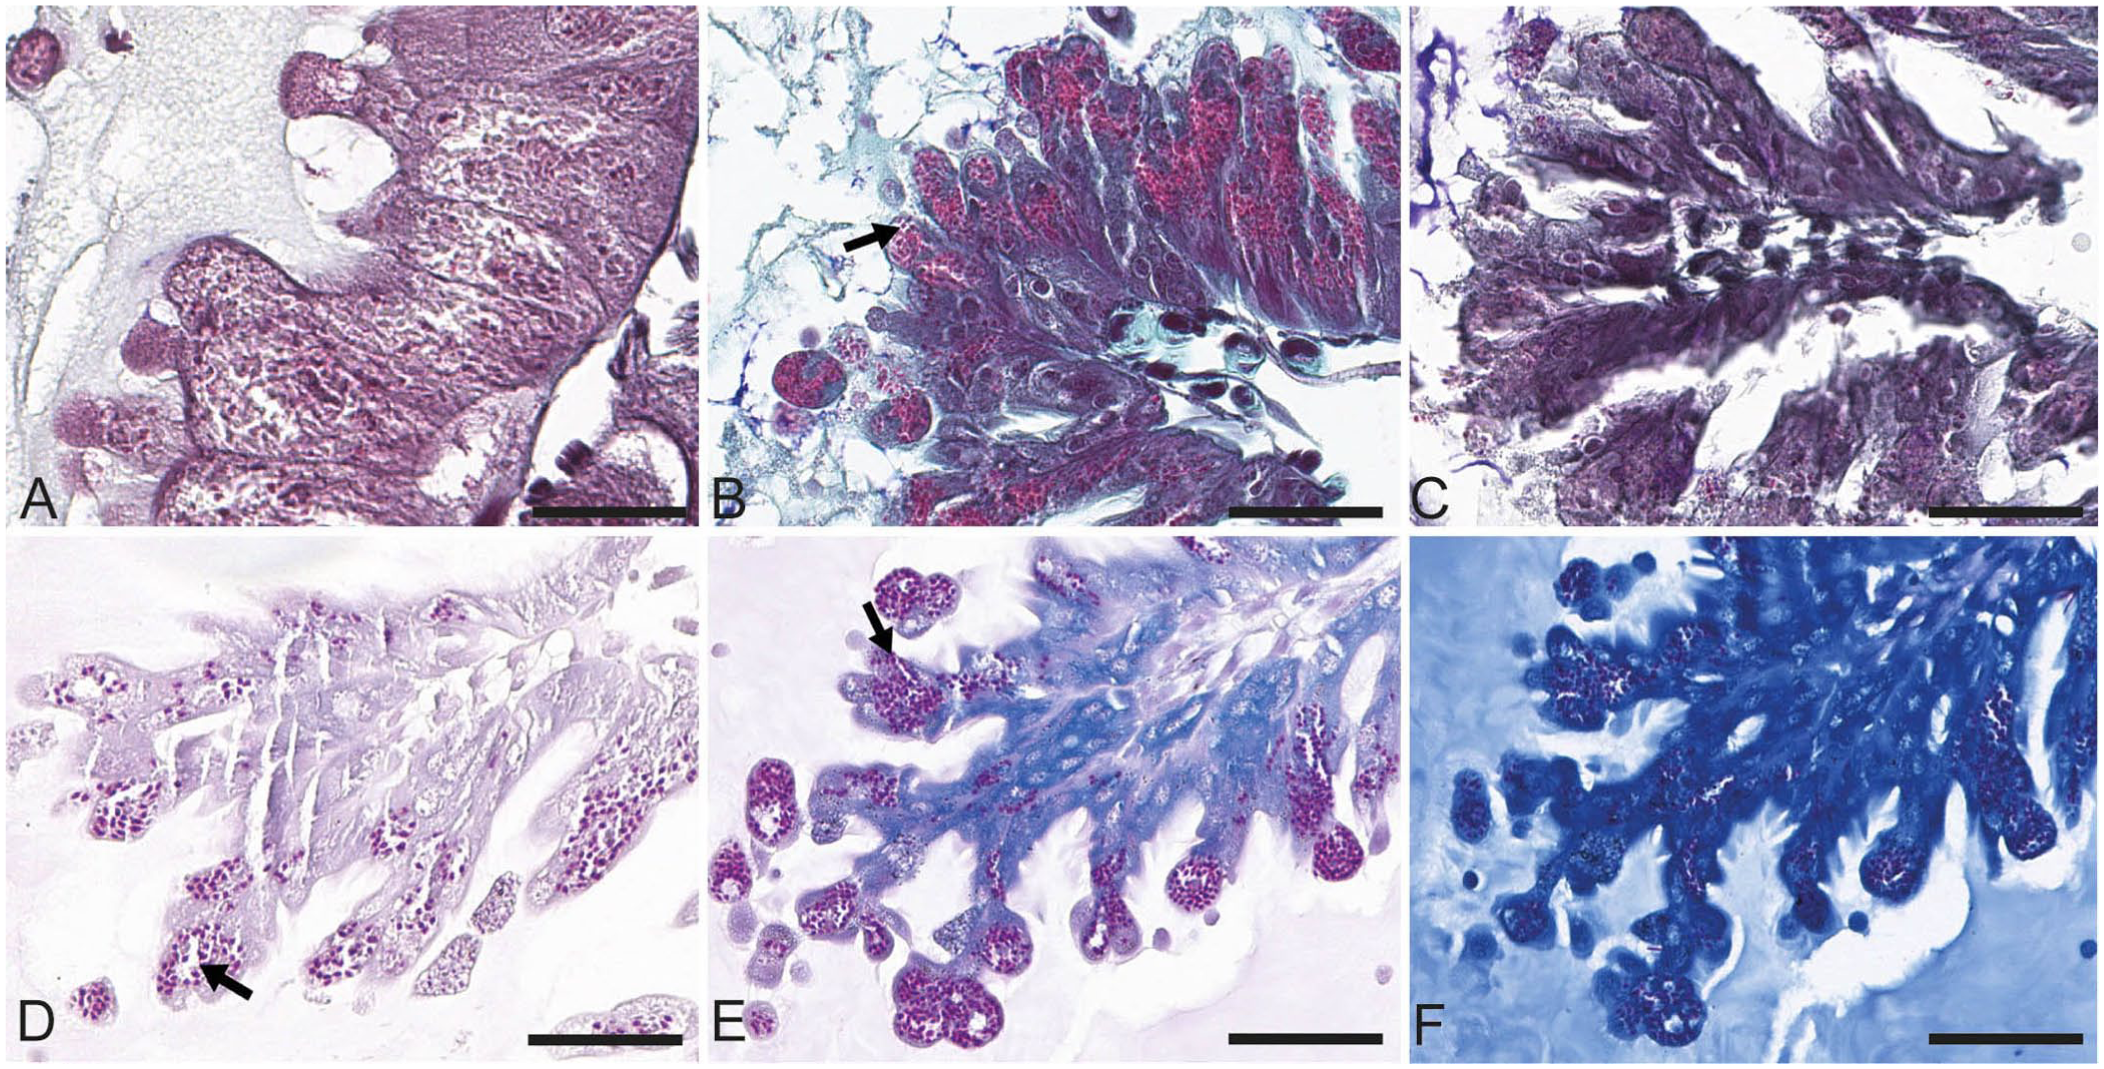
Special stains tested for Vairimorpha spp. staining in transverse sections of the honey bee ventriculus. Arrows point to spores clearly revealed by the staining technique. Bars = 60 μm.
Discussion
The histologic methods that we tested yielded results that correlated well with the standard counting method. First, comparing manual counting of the spores to the percentage of infected bees, the ICC of 0.74 indicates that the method is moderately reliable. 19 However, the 95% CI [0.36, 0.91] is very large, reflecting poor precision, and reliability could range from poor to excellent. In infected hives, the number of spores per bee, determined with the hemocytometer, usually reflected one or a few highly infected bees, with others having few spores or no infection. 10 This may explain the absence of a strong relationship between the percentage of infected bees and the manual spore count in our study. Nonetheless, studying the difference in the spore load between bees can improve our understanding of the course of the infection, and can be realized with histologic methods.
Second, comparing the manual count of the spores with the grade of infection of a hive, the ICC of 0.82 indicates good reliability of the method. 19 Once again, the 95% CI [0.53, 0.94] is large, indicating this method’s reliability ranges from moderately reliable to excellent. Using a larger sample size probably would have helped obtain more precise results and reduce the 95% CIs. 27 Only one sample contained >106 spores per bee, which is the threshold for treatment. 11 All the other samples were considered within normal limits. It is possible that with a higher number of severely infected samples, the histologic differences between severely infected hives and minimally infected ones would have been more pronounced. Given the relatively small sample size, our findings should be generalized with caution; larger cohorts will help validate these results across diverse populations and conditions.
Histology was not as sensitive as the standard manual counting method; spores were only observed histologically in 10.8% of the bees coming from infected samples. Additionally, in 2 infected hives, spores were not detected histologically, and this lower sensitivity could lead to false-negatives and late treatment in the field. Not all bees within an infected hive bear spores; 10 the lower number of bees processed for histology (~20) compared with those used for counting (60) thus reduces the sensitivity of the histology process. Increasing the number of bees for histologic examination would increase the sensitivity and precision. The downside is an increase in cost and evaluation time. Indeed, histology is significantly more time-consuming and more expensive than hemocytometer counting. However, histology can provide additional information on bee health status, such as cellular alterations and the localization of specific lesions, that cannot be obtained from simple counting. 33
We found that spores colonized only the bee ventriculus, which is in accordance with other studies. 15 However, it is possible that using a special stain, such as the hot Gram chromotrope, with additional and more infected samples, would have revealed spores in other organs, as other studies have detected spores in extra-ventricular organs by PCR.6,8 Indeed, the ventriculus is the main organ in which Vairimorpha spp. develop, but studies of the effects of nosemosis on other organs have produced conflicting results. Researchers have also detected spores in the salivary glands, mandibular glands, hypopharyngeal glands, and venom sacs and glands by PCR, but no histologic observations were reported to confirm these results. 8 In another study, using PCR, V. ceranae spores were identified in the Malpighian tubules and fat bodies. 6 PCR analysis variably detected Vairimorpha spp. in extra-ventricular organs, but potential contamination of the samples cannot be excluded, considering that these spores were not observed histologically.
We observed distension and edema of ventricular epithelial cells in infected bees, similar to published results. 12 The spore accumulation within the cells prevented their normal secretory activity, altering production of a peritrophic membrane. The destruction of the peritrophic membrane and epithelial cells likely causes indigestion and death in serious cases. The hypopharyngeal glands of the infected bees were atrophied, which corroborates previous results. 34 However, it is unknown if this atrophy is a direct effect of the infection or a consequence of malnutrition and aging. 1 Indeed, many factors can affect the gland size, some of which were not controlled in our study. Because the parasite imposes an energy stress on the infected honey bee, the hypopharyngeal gland atrophy is likely caused by malnutrition, rather than a direct effect of the disease. 24 In a similar manner, the fat bodies were also atrophied, which may be linked to nutritional stress, given that malnutrition causes fat body lipolysis. 9
Histology is widely used by veterinary pathologists to diagnose and characterize diseases in mammals, but is still underused in arthropods. 28 Although a treatment threshold of 106 spores per bee has been proposed in some studies, this value remains somewhat arbitrary. 11 A better understanding of the lesions associated with infection and the proportion of bees affected within a colony could help refine this threshold. Such information would also aid decision-making on the need for intervention.
To our knowledge, no previous study has compared special stains to identify and optimize those most effective for visualizing Vairimorpha spp. spores within the honey bee ventriculus. We found no such reports in searches of Google, PubMed, Web of Science, and Scopus using various combinations of the terms “Vairimorpha”, “Nosema”, “special stain”, “honey bee”, and “ventriculus,” suggesting that this comparison has not been reported previously. Yet, each dye has different properties that allow for the specific staining of cellular components. 33 Special stains might allow for the detection of lower intensity infections, which could promote early response and treatment of diseases. Moreover, bees with fewer spores may have better immune systems, which could be studied to search for a cure or to identify Vairimorpha-resistant bee strains. Special stains allow for the rapid identification of nosemosis, and the hot Gram chromotrope technique was the best among the stains tested for this purpose. The required immersion times in each dye are very specific, and a slight change can affect the overall quality of the slide.
We did not identify the Vairimorpha species (V. ceranae and/or V. apis) involved. In future research, it would be important to distinguish between the 2 species using molecular methods, such as PCR or species-specific immunohistochemistry. This not only would confirm the identity of the infecting microsporidian but also allow investigation of potential species-specific patterns of histologic lesions. Although histologic differences between the 2 species are not yet clearly defined, V. ceranae is known to be more pathogenic and has been associated with colony collapse disorder.5,15 Therefore, characterizing lesions such as hypopharyngeal gland or fat body atrophy in a species-specific manner may shed light on the underlying mechanisms of disease. The improved special stains identified here, including the hot Gram chromotrope and Ziehl–Neelsen stains, could help reveal such differences in parasite localization or tissue tropism. These approaches may contribute to a better understanding of the distinct pathogenesis and clinical outcomes associated with each species.
Supplemental Material
sj-pdf-1-vdi-10.1177_10406387251395204 – Supplemental material for Histopathology of nosemosis in honey bees: correlation with manual counting and comparison of staining methods
Supplemental material, sj-pdf-1-vdi-10.1177_10406387251395204 for Histopathology of nosemosis in honey bees: correlation with manual counting and comparison of staining methods by Elsa Racine, Magaly Bégin-Pépin and Marie-Odile Benoit-Biancamano in Journal of Veterinary Diagnostic Investigation
Footnotes
Acknowledgements
We thank Dr. Pascal Dubreuil for access to the hives and for his help with sample collection; Tristan Juette for his help with the statistical analyses; and Jacinthe Cardin for her technical support with histology slide production.
Declaration of conflicting interests
The authors declared no potential conflicts of interest with respect to the research, authorship, and/or publication of this article.
Funding
Funding was received from the Concours de développement analytique CDEVQ (Complexe de diagnostic et d’épidémiosurveillance vétérinaires du Québec)–MAPAQ (Ministère de l’Agriculture, des Pêcheries et de l’Alimentation du Québec), Fonds du centenaire–Faculté de médecine vétérinaire–Université de Montréal. E. Racine received scholarships from the Fonds de Recherche du Québec-Nature et Technologies (FRQNT) (341133) and the Natural Sciences and Engineering Research Council of Canada (NSERC).
Supplemental material
Supplemental material for this article is available online.
References
Supplementary Material
Please find the following supplemental material available below.
For Open Access articles published under a Creative Commons License, all supplemental material carries the same license as the article it is associated with.
For non-Open Access articles published, all supplemental material carries a non-exclusive license, and permission requests for re-use of supplemental material or any part of supplemental material shall be sent directly to the copyright owner as specified in the copyright notice associated with the article.