
Abstract
The current work was undertaken to settle the debate about the toxicity of artificial sweeteners (AS), particularly aspartame and saccharin. Twenty-five, 7-week-old male Wistar albino rats with an average body weight of 101 ± 4.8 g were divided into a control group and four experimental groups (n = 5 rats). The first and second experimental groups received daily doses equivalent to the acceptable daily intake (ADI) of aspartame (250 mg/Kg BW) and four-fold ADI of aspartame (1000 mg/Kg BW). The third and fourth experimental groups received daily doses equivalent to ADI of saccharin (25 mg/Kg BW) and four-fold ADI of saccharin (100 mg/Kg BW). The experimental groups received the corresponding sweetener dissolved in water by oral route for 8 weeks. The activities of enzymes relevant to liver functions and antioxidants were measured in the blood plasma. Histological studies were used for the evaluation of the changes in the hepatic tissues. The gene expression levels of the key oncogene (h-Ras) and the tumor suppressor gene (P27) were also evaluated. In addition to a significant reduction in the body weight, the AS-treated groups displayed elevated enzymes activities, lowered antioxidants values, and histological changes reflecting the hepatotoxic effect of aspartame and saccharin. Moreover, the overexpression of the key oncogene (h-Ras) and the downregulation of the tumor suppressor gene (P27) in all treated rat groups may indicate a potential risk of liver carcinogenesis, particularly on long-term exposure.
Introduction
Although non-nutritive or artificial sweeteners (AS) greatly replaced sucrose in foods for enhancing flavor while reducing calories, their safety has been controversial. Aspartame and saccharin are among the most common sugar substitutes used to sweeten various products, including soft drinks, jams, chewing gum, canned fruit, candies, cosmetic products, vitamins, and medications. 1 Sodium saccharin or soluble saccharin (ortho-benzoylsulfimide sodium salt) is the most widely known benzisothiazole derivative and the most commercially available non-nutritive sweetener. 2 Aspartame (L-α-aspartyl-L-phenylalanine, 1-methyl ester) is also a widely used AS. 3 It is a dipeptide methyl ester, built up of a phenylalanine molecule, an aspartate molecule, and a methyl group esterified to the carbonic acid group of the phenylalanine.
Many of the studies on the safety of AS have been conducted by companies that produce these AS and are not generally available to consumers. However, some independent research studies have associated AS with health disorders such as hepatotoxicity 4 and cancers. 1 A vast controversy concerning this issue still, however, exists. The role of sweeteners in cancer risk has been widely debated. 5 Undoubtedly, aspartame has been the most controversial AS because of its potential toxicity 1 and carcinogenicity, 6 even at a dosage level approximating the ADI for humans. 1 Similarly, exposure studies on saccharin provide both positive and negative results including the potential to induce cancer in rats, dogs, and humans. 1 On the other hand, human-based study indicates that the consumption of AS was not associated with the risk of cancer. 5
Long-term consumption of AS in rats leads to hepatocellular injury and alterations in liver antioxidant status. 7 Many histological alterations have been reported in liver sections from aspartame-treated7,8 and saccharin-treated 9 albino rats, respectively.
Aspartame has been reported to induce remarkable alterations in the expression of key oncogenes (Harvey rat sarcoma viral oncogene homolog [h-Ras] and cellular myelocytomatosis viral oncogene homolog [c-myc]) in rat liver. 10 Sodium saccharin was previously reported to induce point mutation in the Kirsten rat sarcoma viral oncogene homolog (K-ras) in human RSA cells in vitro. 11 Additionally, saccharin induces greater DNA damage than aspartame. 12 Recently, DNA binding properties of aspartame 13 and saccharin 14 were also reported, supporting the notion that both may be genotoxic.
This resonant controversy among independent scientific publications and those financed by AS manufacturers about the toxicity and safety of AS had motivated us to design this research proposal attempting to disclose some of the enigmatic aspects of this issue.
Materials and methods
Artificial sweeteners
Both aspartame (Cat. No. AL5181-ASPA) and sodium saccharin (Cat. No. AL3367), were purchased from Alpha Chemika (Mumbai, India).
Animals and experimental design
Twenty-five, 7-week-old male Wistar albino rats with an average body weight of 101 ± 4.8 g were purchased from the animal house of the College of Pharmacy, King Saud University, Riyadh, Saudi Arabia. The rats were acclimatized for 7 days before the onset of the experiment. Animals were maintained at 22°C, good ventilation, and 12 h light/dark cycle. The animal experimental protocols were approved by the Animal Care and Use Committee of Taif University (Grant No. 434/2514). The rats were fed a standard pellet diet, and water ad libitum. The rats were divided into a control group and four experimental groups (5 rats per group), and housed in polycarbonate cages.
The first and second experimental groups received daily doses equivalent to the ADI of aspartame (250 mg/Kg BW) and four-fold ADI of aspartame (1000 mg/Kg BW). The third and fourth experimental groups received daily doses equivalent to ADI of saccharin (25 mg/Kg BW) and four-fold ADI of saccharin (100 mg/Kg BW).
Rats in different treated groups received the corresponding sweetener dissolved in water by oral route daily for 8 weeks. The ADI was calculated according to human ADI 15 and corrected for rats according to Fernstrom. 16
Body weight assessment
The individual rats in each group were weighed at the start and at the end of the experiment for determining the initial and final body weights.
Sampling
At the end of the experimental period animals were anesthetized using diethyl ether, blood samples were collected from the orbital sinus via heparinized micro-hematocrit tubes into heparinized tubes. Blood samples were centrifuged and the plasma was collected and stored at −80°C until being used for biochemical assays. Then, rats were sacrificed by head decapitation. Immediately, the hepatic tissue specimens were collected for histological and gene expression assessments. Samples for histological examination were preserved in 10% neutral buffered formalin (NBF) and those for molecular assays were kept in RNA-Later (Sigma-Aldrich, St. Louis, MO, USA) at −80°C.
Biochemical assays
Commercial diagnostic kits from Human diagnostic (GmbH-56205, Wiesbaden, Germany) were used for determination of plasma alanine aminotransferase (ALT) and alkaline phosphatase (ALP). Determination of ALT was according to Reitman and Frankel, 17 whereas ALP was determined according to Schlebusch et al. 18 Kits for assessment of Catalase and total antioxidant capacity were purchased from Biodiagnostic (Dokki, Giza, Egypt). Catalase was measured according to Aebi, 19 and the total antioxidant capacity according to Koracevic et al. 20
Analysis of genes expression
RNA extraction and cDNA synthesis
Total RNA was extracted from 100 mg of hepatic tissue sample using QIAzol lysis reagent (QIAGEN Inc., Valencia, CA, USA) according to the manufacturer’s instructions and as detailed previously. 21 Integrity of the prepared RNA was checked by electrophoresis. RNA concentration and purity were determined spectrophotometrically at 260 nm and 280 nm. For cDNA synthesis, 2 µg RNA were reverse transcribed with oligo-dT primer and Moloney murine leukaemia virus (M-MuLV) reverse transcriptase (SibEnzyme Ltd. AK, Novosibirsk, Russia) as previously described. 21 The resultant cDNA was preserved at −20°C.
Semi-quantitative PCR
The used primers were de-signed using Oligo-4 computer program (Molecular Biology Insights, Inc., Cascade, CO, USA) and nucleotide sequence published in Genbank (Table 1) and synthesized by Macrogen (Macrogen Company, GAsa-dong, Geumcheon-gu., Republic of Korea). PCR was conducted in a final volume of 25 µL consisting of 1 µL cDNA, 1 µL of 10 picomolar of each primer (forward and reverse), and 12.5 µL PCR master mix (Promega Corporation, Madison, WI, USA), the volume was brought up to 25 µL using sterilized, deionized water. PCR was carried out using a PeX 0.5 thermal Cycler (Thermo Fisher Scientific, Waltham, MA, USA) with the cycle sequence of one cycle at 94°C for 5 min, followed by 25 cycles each of which consisted of denaturation at 94°C for 1 min, annealing at the specific temperature corresponding to each primer (Table 1) and extension at 72°C for 1 min with an additional final extension for one cycle at 72°C for 5 min. As a reference, expression of glyceraldehyde-3-phosphate dehydrogenase (GAPDH) mRNA was detected using specific primers (Table 1). PCR products were electrophoresed on 1% agarose A (Bio Basic Inc., Konrad Cres, Markham, ON, Canada) gel in 1.0 X- TAE (Tris-Acetate-EDTA) buffer (Sigma-Aldrich, St. Louis, MO, USA) at 100 volts for 30 min. The gel was stained with ethidium bromide and visualized under UV light then photographed using UVP gel documentation system (UVP, Upland, CA, USA). The intensities of the bands were quantified densitometrically using Image J program version1.47 (http://rsb.info.nih.gov/ij/).
Primers and PCR conditions used for the tested genes.

Histological examination
Small specimens from the liver were fixed in 10% NBF for 24 h, then washed under running tap water and preserved in 70% ethanol. The samples were dehydrated in ascending grades of ethanol, cleared in xylene and embedded in Paraplast Plus® (Sigma-Aldrich, St. Louis, MO, USA) and sectioned at 5 μm thickness. Tissue sections were mounted on glass slides. Sections were stained with hematoxylin and eosin for studying the general histology, 22 and picrosirius red (PSR) for collagen staining. 23
Photomicrography
Photomicrographs were taken with a Leica DM LB light microscope (Leica Microsystems, Wetzlar, Germany) and digital camera (Leica EC3, Leica Microsystems Ltd., Heerbrugg, Switzerland).
Statistical analysis
Statistical analysis for the obtained results was performed using analysis of variance (ANOVA) followed by the least significant difference (LSD) test for the multiple comparisons among the groups by using SPSS software (SPSS version 13.0, IBM, Chicago, IL, USA) with P <0.05 regarded as statistically significant. Results were expressed as means ± standard errors of means (SEM).
Results
Body weight
At the end of the experiment, the final body weight was significantly lower in rats from the treated groups when compared to that from the control group (Table 2). The rats of the groups which received the high doses of AS (Asp. H and Sacch. H) displayed a significantly lower body weight gain when compared to those from the groups received the low doses (Asp. L and Sacch. L).
Effect of artificial sweeteners intake on the body weight gain.

Asp. H, four-fold ADI of aspartame; Asp. L, one-fold ADI of aspartame; Cont., control; Sacch. H, four-fold ADI of saccharin; Sacch. L, one-fold ADI of saccharin.
Values carrying different symbols are significantly different at P <0.05.
Biochemical findings
Antioxidants
Both the catalase activity (Figure 1a) and the total antioxidants concentration (TAC) (Figure 1b) in the blood plasma decreased apparently in aspartame-treated groups (Asp. L and Asp. H), compared to the control group. The catalase activity and TAC decreased significantly in saccharin-treated groups (Sacch. L and Sacch. H), compared to the control group. However, no significant differences were found among aspartame-treated (Asp. L and Asp. H) and saccharin-treated (Sacch. L and Sacch. H) groups.

Effects of artificial sweeteners intake on the antioxidants and liver enzymes activities. Notes: Values are mean ± SE (n = 5). (a) Plasma catalase activity; (b) plasma total antioxidant concentration; (c) plasma alanine aminotransferase (ALT) activity; (d) plasma alkaline phosphatase (ALP) activity. Asp. H, four-fold ADI of aspartame; Asp. L, one-fold ADI of aspartame; Cont., control; Sacch. H, four-fold ADI of saccharin; Sacch. L, one-fold ADI of saccharin. Columns carrying different letters are significantly different at P <0.05.
Liver enzymes
The plasma activities of ALT (Figure 1c) and ALP (Figure 1d) exhibited a significant elevation in all treated groups compared to the control group. Although, no significant difference was found in the ALP activities between the aspartame-treated groups (Asp. L and Asp. H), nor in the ALT activities between the saccharin-treated groups (Sacch. L and Sacch. H); there was a dose-dependent increase in ALT level in aspartame-treated rats and in ALP level in saccharin-treated rats (Figure 1a, 1b).
Molecular findings
The mRNA expression of h-Ras and P27 was investigated in the liver from the control group and all treated groups after exposure to different artificial sweeteners at different dose rates for 8 weeks. The expression of h-Ras was significantly higher in all treated rat groups compared to the control group and in a dose-dependent manner (Figure 2a). On the other hand, P27 mRNA expression was significantly downregulated in all treated groups compared to the control group and this downregulation was also dose-dependent (Figure 2b).
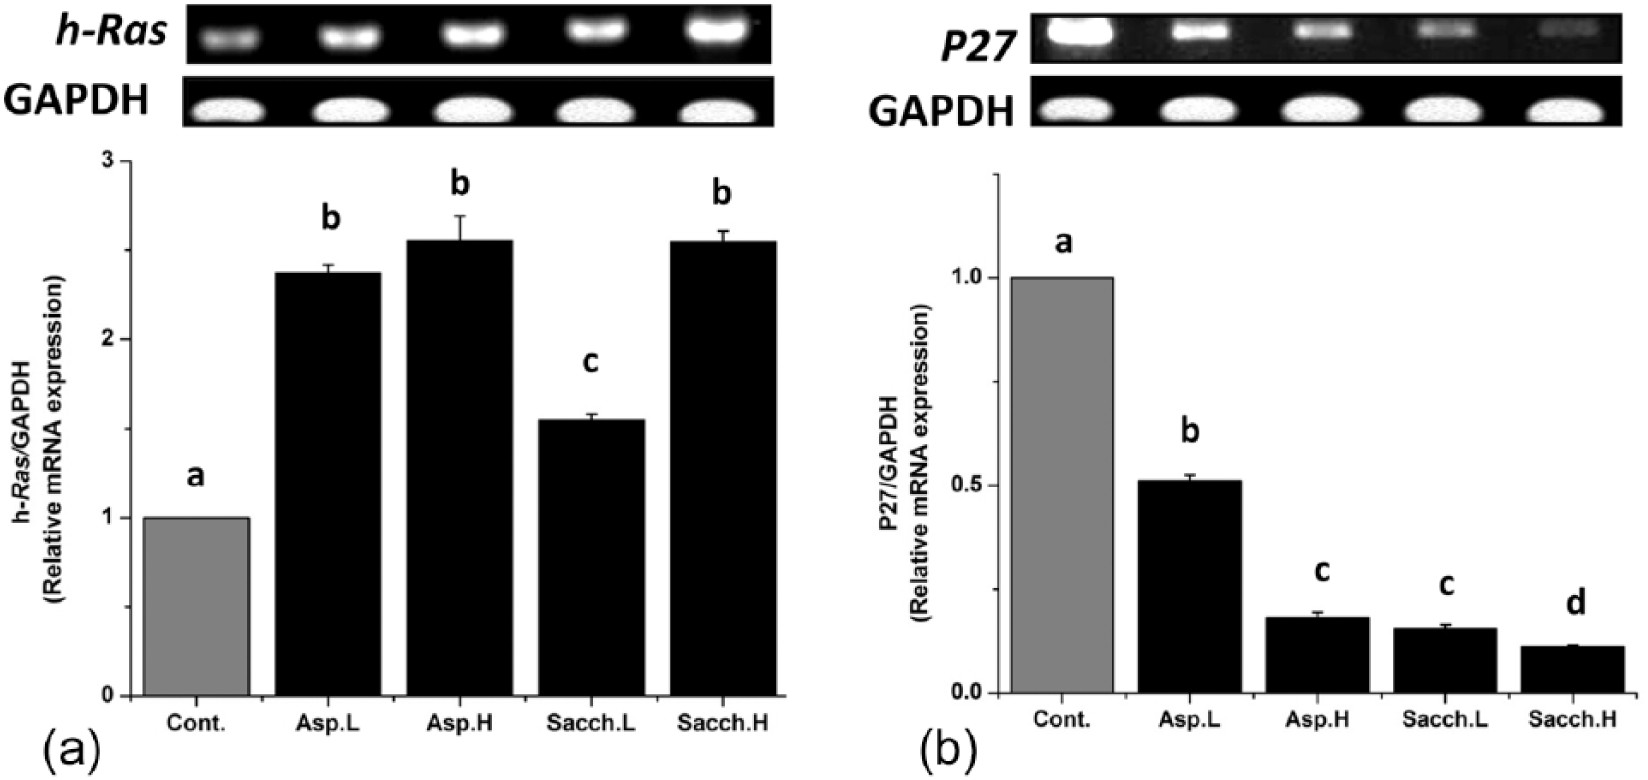
Effects of artificial sweeteners intake on h-Ras (a) and P27 (b) mRNA expression in hepatic tissue of rat. Notes: Representative blots and results of densitometric analyses of at least five independent experiments are shown. Values are means ± SE. Asp. H, four-fold ADI of aspartame; Asp. L, one-fold ADI of aspartame; Cont., control; Sacch. H, four-fold ADI of saccharin; Sacch. L, one-fold ADI of saccharin. Columns carrying different letters are significantly different at P <0.05.
Histological findings
Hematoxylin and eosin stained liver sections from control rats displayed the normal lobular pattern of central vein (CV) from which radiate the hepatic cords separated by blood sinusoids. Portal tracts were seen underlining the periphery of the hepatic lobule. Each portal tract (PT) was formed by the assembly of three consistent structures, namely branches of portal vein, hepatic artery, and bile duct. Hepatocytes were large and polyhedral in shape with slightly eosinophilic granular cytoplasm. They exhibited variable size, large rounded vesicular nuclei with prominent nucleoli, and some cells were binucleated (Figure 3a).

(a
Liver sections from rats received aspartame (Asp. L and Asp. H) showed obvious histological changes, in the form of disorganized hepatic parenchyma, dilatation, and congestion of the CV and hepatic sinusoids (HS) with proliferation of Kupffer cells. Some hepatocytes showed signs of degenerative changes in the form of cellular swelling, vacuolar cytoplasm and others were necrotic. Some sections showed focal areas of complete degeneration, diffuse and focal intralobular mononuclear cell infiltration (Figure 3b). These histological changes were more pronounced in liver sections from rats received higher doses of aspartame (Figure 3c). Liver sections from rats received saccharin (Sacch. L and Sacch. H) also showed histological changes (Figure 3d, e) similar to those recorded in sections from rats receiving aspartame.
Compared to the liver sections from the control rats (Figure 3f), the sections stained with PSR for demonstrating collagen deposition (pink colored), displayed a remarkable periportal fibrosis in all treated groups receiving aspartame (Figure 3g, h) and saccharin (Figure 3i, j). The collagen deposition was more pronounced in liver from rat groups received the higher doses of sweeteners.
Discussion
There is a great discrepancy about the efficacy of low-calorie AS in controlling the body weight. Previous studies showed that AS may trigger the secretion of glucagon-like peptide (GLP)-1 by the digestive tract, resulting in weight loss through reducing appetite and calorie intake. 24 On the contrary, other reports revealed that, AS are not effective in the induction of weight loss and may promote weight gain. 25 However, Abd Elfatah et al. 26 reported that, albino rats received aspartame showed a marked decrease in body weight compared to the control. In agreement with Brown et al. 24 and Abd Elfatah et al., 26 the present findings showed that, both aspartame and saccharin reduced the body weight.
Aspartame-induced toxicity is mainly attributed to the products resulting from its metabolism. Aspartame is a dipeptide methyl ester, which is hydrolyzed by pancreatic chymotrypsin in the upper part of the small intestine to yield phenylalanine, aspartic acid, and methanol. 27 Methanol is oxidized in the tissues by alcohol dehydrogenase to formaldehyde, which is a highly reactive intermediate product. 28 The in vitro studies on micromolar formaldehyde, a metabolite of methanol derived from aspartame, displayed that, this formaldehyde induces cytotoxicity on rat thymocytes. 29 This cytotoxic effect was represented by increased populations of shrunken cells. On the other hand, most of the ingested saccharin being rapidly excreted via kidney in an unchanged form by active tubular secretion. 30 Additionally, a previous study on rats fed 1% hydrated sodium saccharin in the diet for 2 years could not report that saccharin is metabolized by the liver. 31
The present biochemical findings indicate that, both aspartame and saccharin may induce oxidative stress on the liver cells through lowering the catalase activity and the TAC in the plasma. It is worth mentioning that, the impact of saccharin was more pronounced. Our findings go in line with previous in vitro studies reported that, aspartame induces reactive oxygen species (ROS) formation and cytotoxicity. 32 Additionally, a previous study indicated that the long-term consumption of aspartame in rats leads to an imbalance in the antioxidant/pro-oxidant status in the hepatic tissues. 7 Similarly, the significant decrease in the TAC and catalase activity in the saccharin-treated groups of our study suggests that saccharin may be a potential oxidative stress inducer. This may agree with the previous initiation-promotion study reported that sodium saccharin exhibits oxidative cytotoxic and tumor-promoting effects in rat urinary bladder. 33
In agreement with previous studies on hepatotoxic effect of aspartame in rats,7,34 and saccharin in humans 4 and rats, 9 significantly elevated activities of plasma ALT and ALP were recorded in all treated groups of the present study compared to those of the control. It is worth noting that estimation of these enzymes in the plasma is a useful quantitative indicator of the extent and type of hepatocellular damage. Thereby, the elevation in plasma ALT and ALP activities was more pronounced in groups received the higher doses (four-fold ADI of both AS). These biochemical changes were rather supported by the current histological findings that go in line with previous studies on hepatotoxic effect of aspartame7,8,26 and saccharin 9 in albino rats. The present histological findings showed that liver sections from rats received aspartame (Asp. L, Asp. H) or saccharin (Sacch. L, Sacch. H) displayed obvious histological changes, in the form of disorganized hepatic parenchyma, congestion of the CV and hepatic sinusoids (HS), mononuclear cell infiltration, periportal fibrosis, and hyperplasia of bile duct in all treated groups. It is worth noting that these changes were more pronounced in liver sections from rat groups received higher doses of sweeteners (Asp. H and Sacch. H). These findings agree with those reported in the liver of aspartame-treated rats, 7 which showed an increase in the leukocytic infiltration. This inflammatory response may be attributed to the production of ROS in the liver.
Trocho et al. 35 reported that methanol developing from aspartame plays a role in adduct formation caused by formaldehyde, resulting in DNA-protein crosslink formation. Additionally, in their short-term animal experiment, Soffritti et al. 3 detected remarkable aspartame-induced alterations in the expression of key oncogenes and tumor suppressor genes. The current molecular findings represented by overexpression of h-Ras and downregulation of P27 genes go in line with that reported in mice by Soffritti et al. 3 A previous study reported that sodium saccharin is a mutagen, which induces genetic change (K-Ras oncogene mutations) in human RSa cells in vitro. 11 Moreover, genotoxicity testing revealed that saccharin induces greater DNA damage than aspartame. 12 DNA binding properties of aspartame 13 and saccharin 14 were also reported recently, supporting the notion that both are genotoxic.
Based on the remarkable biochemical and histological changes in all treated rat groups, it could be concluded that, both aspartame and saccharin may induce a dose-dependent hepatotoxicity. Addition-ally, overexpression of the key oncogene (h-Ras) and downregulation of the tumor suppressor gene (P27) may indicate a potential risk of liver carcinogenesis particularly on long-term exposure.
Footnotes
Authors’ contributions
Mohamed E. Alkafafy conceived and designed the study, performed the experiments collected the samples, performed the histological studies, and wrote the manuscript; Zein S. Ibrahim took part in performing the experiments, in samples collection, in performing the biochemical assessments, and in drafting the manuscript; Mohamed M. Ahmed took part in samples collection and in performing the biochemical and molecular assessments, analyzed the data, and revised the manuscript; El-Shazly A. Samir took part in samples collection and in performing the biochemical and molecular assessments. All authors read and approved the final manuscript.
Declaration of conflicting interests
The author(s) declared no potential conflicts of interest with respect to the research, authorship, and/or publication of this article.
Funding
This work has been done under the financial support of Taif University, Saudi Arabia (Grant No. 434/2514).