
Abstract
To date, the minimum centrifugation times of microhematocrit tubes of blood to generate accurate PCV and total solids (TS) results have not been validated in veterinary medicine. We collected blood samples from 44 donkeys, 43 dogs, 61 sheep, and 40 cattle. We centrifuged microhematocrit tubes for 1, 2, 3, 5, and 15 min in donkeys and dogs, and 1.5, 3, 5, 10, and 15 min in ruminants. We evaluated the agreements between PCV and TS values at each time of centrifugation with the reference values at 15 min using intra-class coefficients of correlation and linear regressions. Finally, we considered the symmetrical distribution of differences between results obtained at each time of centrifugation and the reference values. We found that microhematocrit tubes centrifuged for a minimum of 3 min in donkeys and dogs, 10 min in sheep, and 5 min in cattle gave PCV and TS results in agreement with the values obtained after 15 min of centrifugation. The centrifugation time for cattle was shorter than currently advised. However, because PCV values of all cattle and most donkeys enrolled were within RIs and because no polycythemic animals were included, validation of these times may be warranted.
The PCV and total protein concentration in serum or plasma are important parameters to assess in critical cases, such as anemic or dehydrated patients. Rapidly obtaining test values is desirable for appropriate decision-making. In veterinary hospitals, the PCV of patients can be obtained by centrifugation of microhematocrit tubes and direct reading on triangulation-type hematocrit reader cards. Total solids (TS) are routinely used to estimate the total proteins and can be measured in plasma using a refractometer. To get accurate results, the Clinical and Laboratory Standards Institute (CLSI) and World Health Organization (WHO) have published guidelines of specifications for the microhematocrit centrifuge, including radius, relative centrifugal field (RCF; 10,000–15,000 × g), temperature, and time.3,17 Although performed routinely, to date, the minimum times for centrifugation of microhematocrit tubes to obtain accurate results of PCV and TS in veterinary species have not been validated. In 2025, at the Clinical Pathology Laboratory of Cornell University College of Veterinary Medicine (Ithaca, NY, USA), the centrifugation times arbitrarily used were 3 min for all species except for ruminants, for which 10 min is used. 4 Furthermore, it is not uncommon to centrifuge the sample for 5 min for any species (authors’ experience). We retrieved no report on the minimal time for centrifugation to obtain accurate results in veterinary medicine in a search of PubMed, Europe PMC, CAB Direct, and Google Scholar using the search terms “minimal”, “time”, “centrifugation”, “microhematocrit”, “veterinary”.
We hypothesized that the minimum centrifugation times of microhematocrit tubes to obtain accurate PCV and TS results in donkeys, dogs, sheep, and cattle are different from the ones commonly assumed. 4
Materials and methods
To determine the minimum centrifugation time for blood samples from donkeys, dogs, sheep, and cattle, we centrifuged samples for different times and compared the results of PCV and TS with the values obtained after 15 min of centrifugation.
Animals
At least 40 animals should be used to compare results obtained from different methods in clinical pathology.1,8 We used blood samples from 44 castrated adult male Caribbean donkeys, 61 castrated or intact crossbred adult male sheep, and 40 non-pregnant crossbred adult cows from the teaching herd of the Ross University School of Veterinary Medicine (RUSVM; Saint Kitts, West Indies). We used samples from 43 dogs of various breeds, any age or sex, at a community outreach event hosted by RUSVM Volunteers for Intercultural and Definitive Adventures (VIDA); the event provided a routine health check and administered preventive medicine to pets, as well as educated community members about pet care. All animals sampled were deemed healthy based on physical examination at the time of blood collection. The blood samples used were obtained from venipunctures performed for purposes unrelated to our study.
Sample source and preparation
Blood was collected from donkeys and sheep as pre-operative bloodwork by veterinary students participating in surgery laboratories at the RUSVM. The collections were approved by the Institutional Animal Care and Use Committee (IACUC) at RUSVM (20.10.26, 17.09.38, 17.08.35, 17.09.42). Investigators supervised the blood collection from a jugular vein, using heparinized blood collection tubes (Vacutainer; BD) and a 20-G needle.
Blood was collected from cows as venipuncture training in a clinical skills laboratory for veterinary students at the RUSVM. The collection was approved by the IACUC at RUSVM (21.05.16). The laboratory instructor supervised the blood collection from the coccygeal vein, using heparinized Vacutainer tubes and 20-G needles.
Blood was collected from dogs to run an ELISA for vector-borne pathogens. An attending veterinarian supervised the blood collection from either a jugular or cephalic vein, with 3-mL syringes, mounted with either 20- or 22-G needles, and placed in EDTA tubes.
Immediately after collection, the tubes were manually inverted at least 3 times; in donkeys, dogs, and sheep, blood necessary for the main purpose of the venipuncture was harvested. In donkeys and ruminants, the leftover blood was stored at room temperature on a blood tube rocker (T400110; Thermo Scientific) until processed within 3 h of sampling. In dogs, the leftover blood was stored in a cooler until transported to the RUSVM laboratory. Samples were allowed to equilibrate at room temperature on a blood tube rocker and were processed within 6 h of sampling, complying with WHO recommendations. 17
We included individual blood samples if the tubes were appropriately filled (i.e., each heparinized tube was allowed to fill completely at the time of collection, or enough blood was in the syringe to fill the EDTA tubes). For each time of centrifugation, we filled by capillarity 2 heparinized microhematocrit tubes (J-543; Jorgensen). We sealed the tubes at the filled end with wax sealant. We spun the tubes at a RCF of 14,972 × g, per the manufacturer’s instructions, using a microhematocrit centrifuge (LWS-M24; LW Scientific). The times of centrifugation were 1, 2, 3, 5, and 15 min for donkeys and dogs, and 1.5, 3, 5, 10, and 15 min for ruminants. These times were based on a pilot study (unpublished data), knowing that ruminant erythrocytes sediment more slowly than those of dogs or horses.12,13 Once these centrifugation times had elapsed, we turned off the timer switch of the centrifuge and activated the brake to stop the rotor.
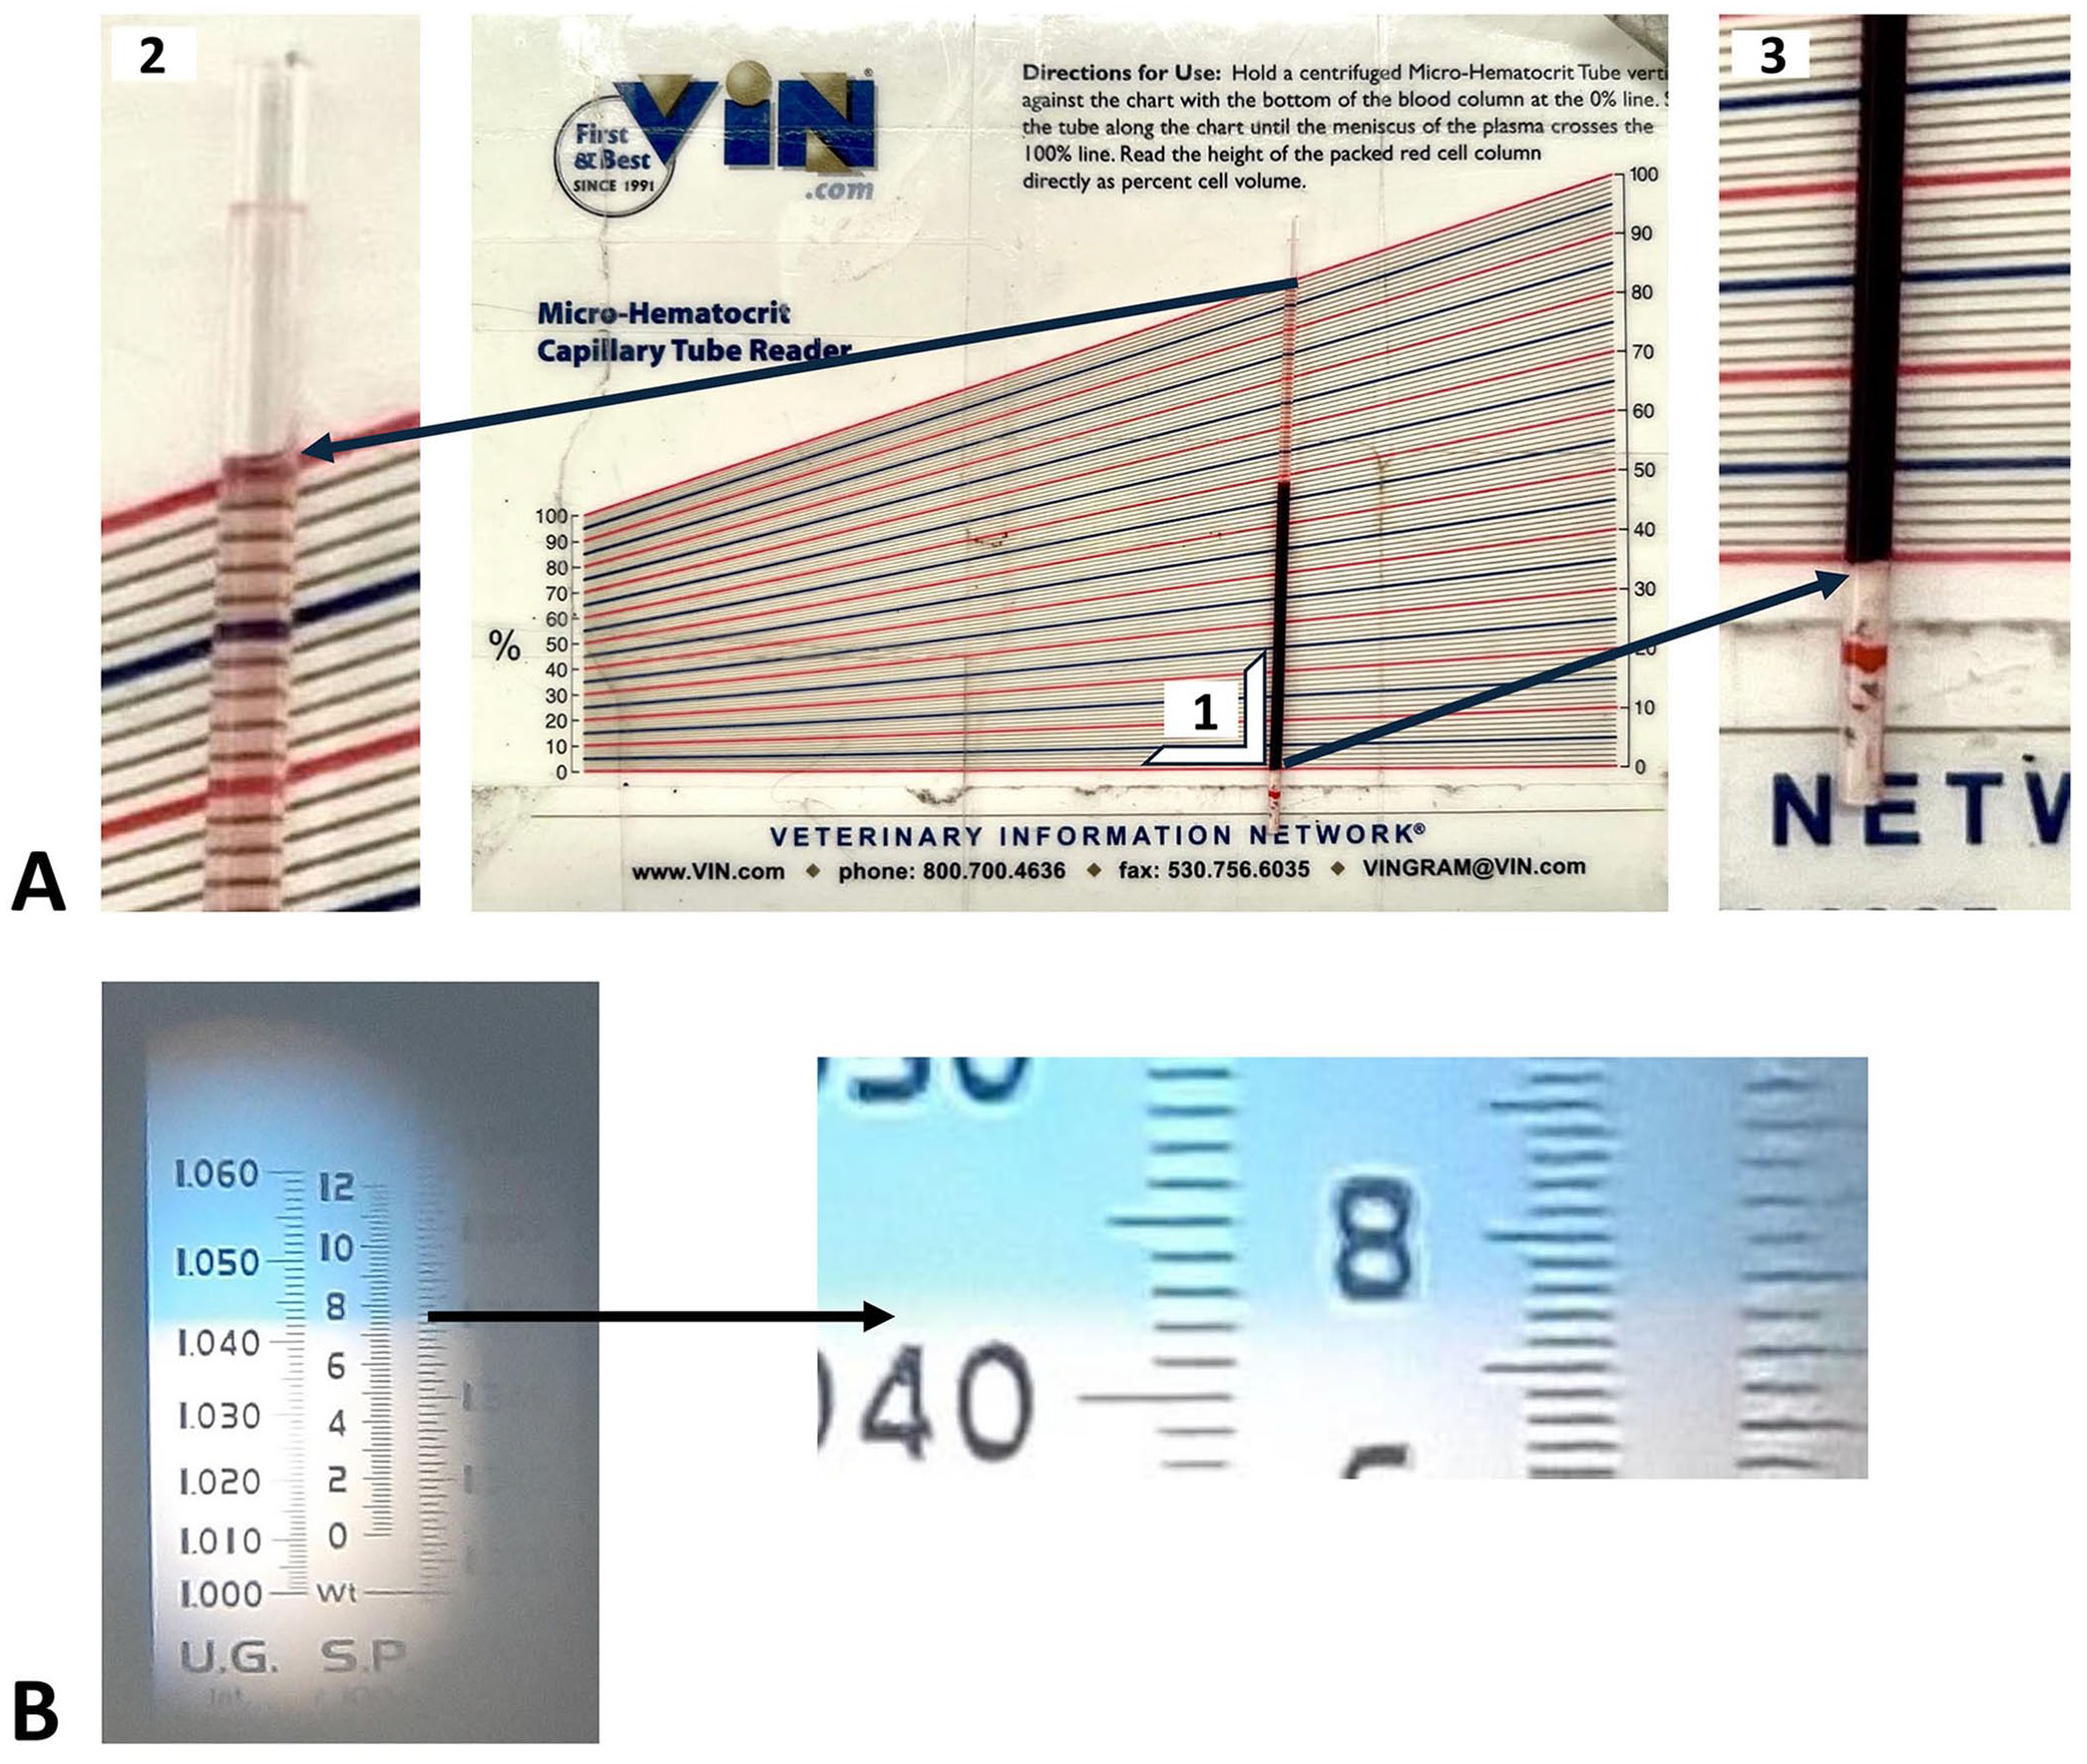
For PCVs, one investigator read each microhematocrit tube immediately after centrifugation using triangulation-type hematocrit reader cards (Micro-hematocrit capillary tube reader, VIN; Fig. 1A) and reported the results to the nearest 0.01 L/L or 1% (result in L/L can be expressed in % by multiplying by 100%). If a tube broke or emptied during centrifugation, the 2 investigators read the remaining single tube. When visible, we excluded the buffy coat from the reading. We used the average of the 2 results for the final analysis. Then we broke 1 of the 2 microhematocrit tubes and transferred the supernatant plasma to a handheld refractometer window with 2- g/L graduations (Master-SUR/NM, Atago; Fig. 1B). Two investigators read the result and agreed on the value to record.
Data analysis
We considered the results obtained after 15 min of centrifugation as the reference values for each animal. We used the RIs used by the RUSVM laboratory. For PCV, RIs were 0.23–0.39 L/L for donkeys, 10 0.37–0.55 L/L for dogs, 5 0.27–0.45 L/L for sheep, 5 and 0.24–0.46 L/L for cattle. 5 For TS, we used plasma protein RIs, which were 53–67 g/L for donkeys, 10 60–75 g/L for dogs and sheep, 5 and 60–80 g/L for cattle. 5
For both PCV and TS, we calculated the differences between the results at each centrifugation time and the reference values at 15 min. We used descriptive statistics to determine the means of the differences and to create dot diagrams (Fig. 2) and difference (Bland–Altman) plots (Suppl. material) to present the distribution of the differences for each centrifugation time (Prism 10 for macOS, v.10.2.3 [347]; GraphPad). We used the Shapiro–Wilk test (v.2023.06.1+524; RStudio) to assess if the differences were normally distributed at each time of centrifugation, with p ≤0.05 considered significant.
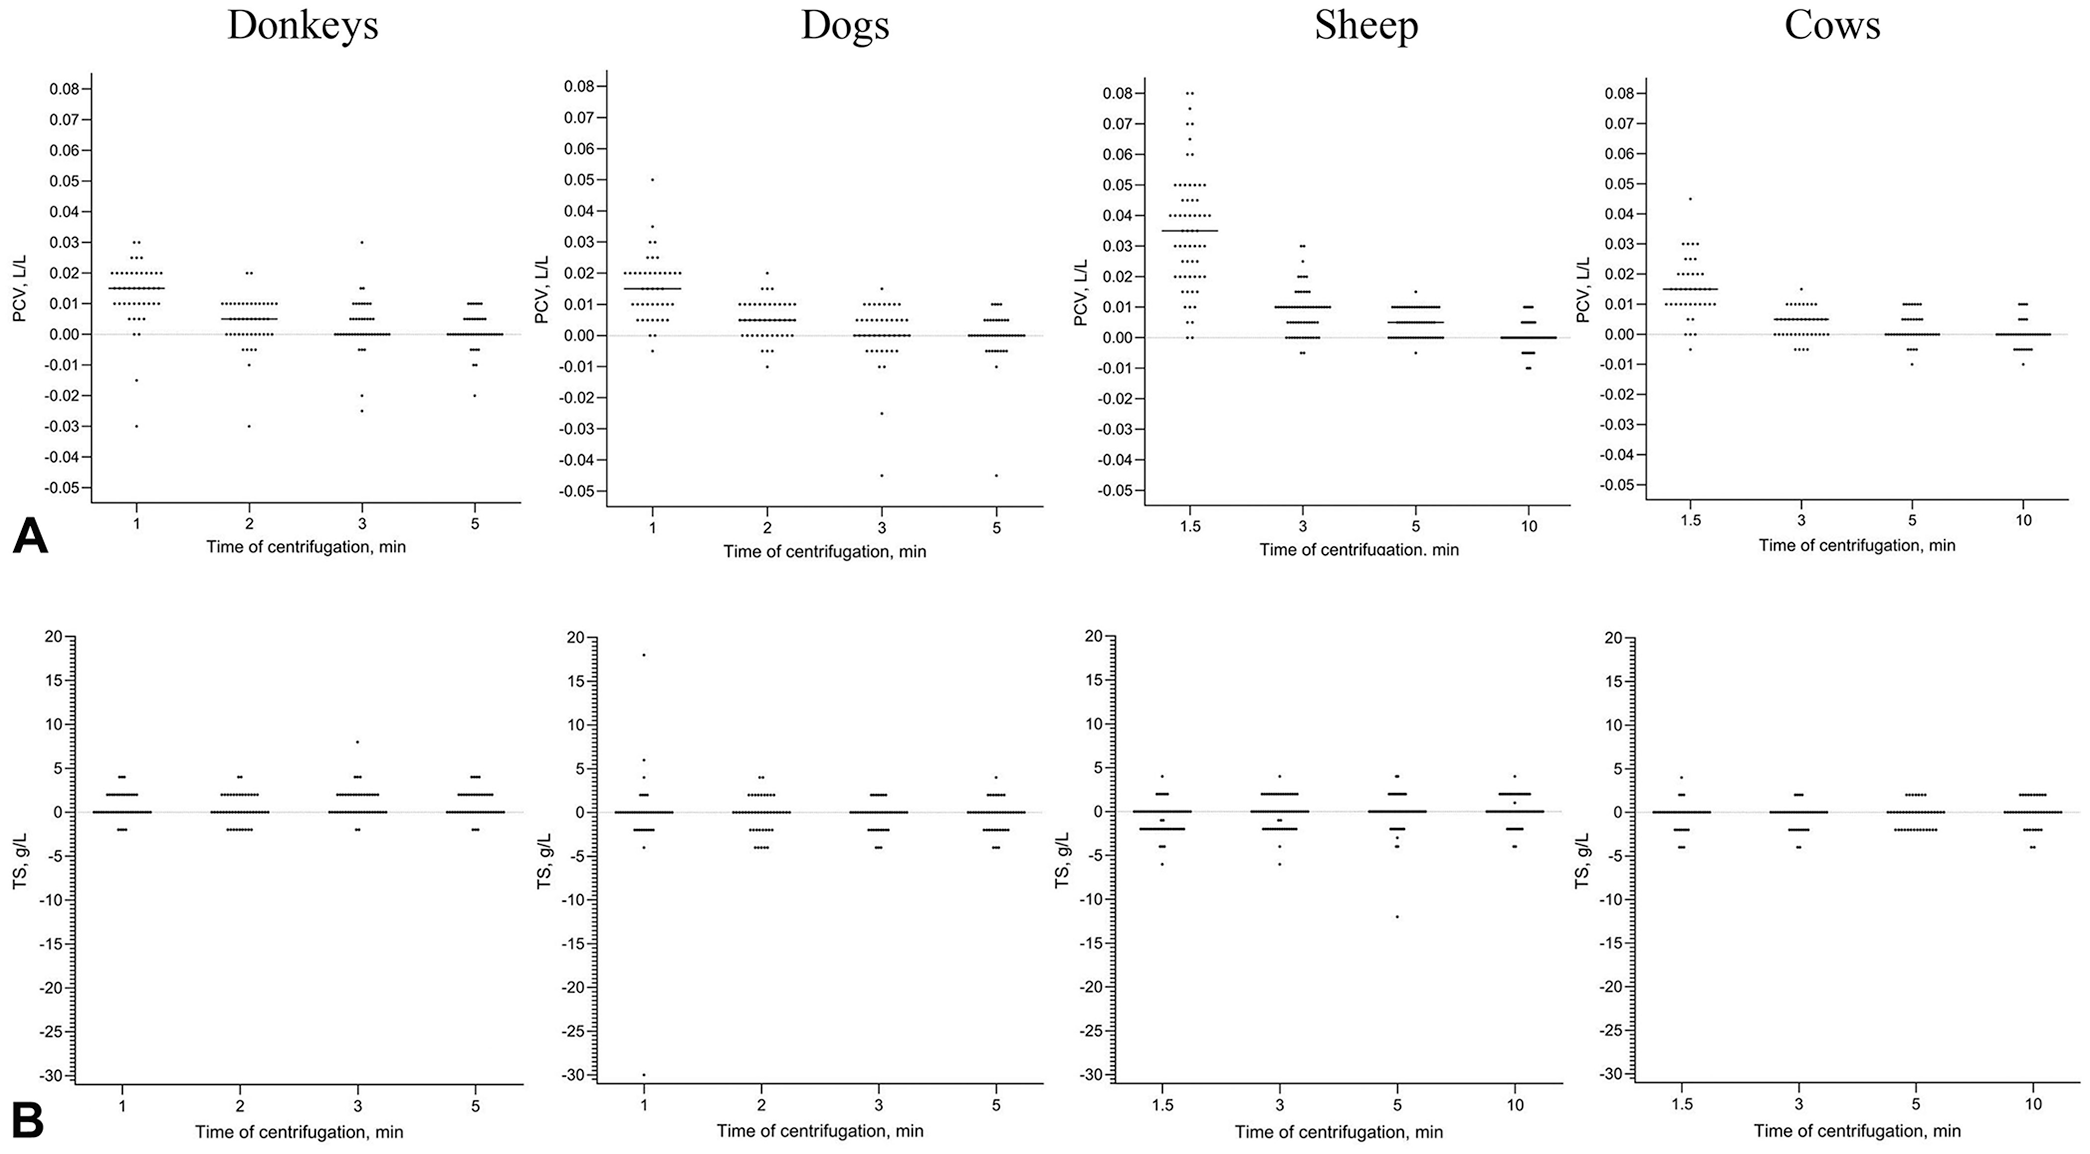
If the differences between the results for each time of centrifugation and the reference values at 15 min were normally distributed, we estimated the agreement using the limits of agreement of the Bland–Altman plot.6,15 If one or more differences were not normally distributed, we determined intra-class coefficients of correlation (ICCs) and linear regression. We calculated the ICC using a “one-way” model and “agreement” type. Correlation of the PCV or TS values at each centrifugation time with the reference values was considered poor for ICC <0.50, moderate for ICC of 0.50–0.75, good for ICC >0.75–0.90, and excellent for ICC >0.90, as described previously. 9 We created scatter plots for linear regressions for each time of centrifugation (y-axis) compared to 15 min (x-axis). We analyzed the obtained regression results for the presence of constant and/or proportional bias, using the slope (a) and the intercept (b) values, respectively, in the regression equation y = ax + b. Perfect agreement was defined as a null intercept for the line of linear regression and a gradient of 1. 15 Finally, we assessed visually the distribution of difference between results obtained at each time of centrifugation and the reference values on the dot diagrams (Fig. 2). For each species, we determined the best centrifugation time as the best combination of ICC value, linear regression equation, and visual symmetrical distribution on difference plots to get accurate values of PCV, and we confirmed if the values of TS obtained were acceptable for clinical decision-making.
Results
For PCV values, the mean of the differences between the readings of the 2 investigators was 0.00 L/L with maximum differences of 0.02 L/L for donkeys (except one difference at 0.04 L/L), and 0.01 L/L for all of the other species (except for 1 difference at 0.02 L/L for each species). The differences between the results of PCV or TS were not normally distributed, except for the differences of PCV results at 1.5 min of centrifugation in sheep and cattle (Tables 1–4). Therefore, we interpreted agreements using ICC and linear regressions; it was not possible to generate agreement limits in Bland–Altman difference plots (Suppl. tables).
Summary of the comparisons of PCV results obtained after different times of centrifugation with PCV results obtained after 15 min of centrifugation in 44 adult donkeys and 43 adult dogs.
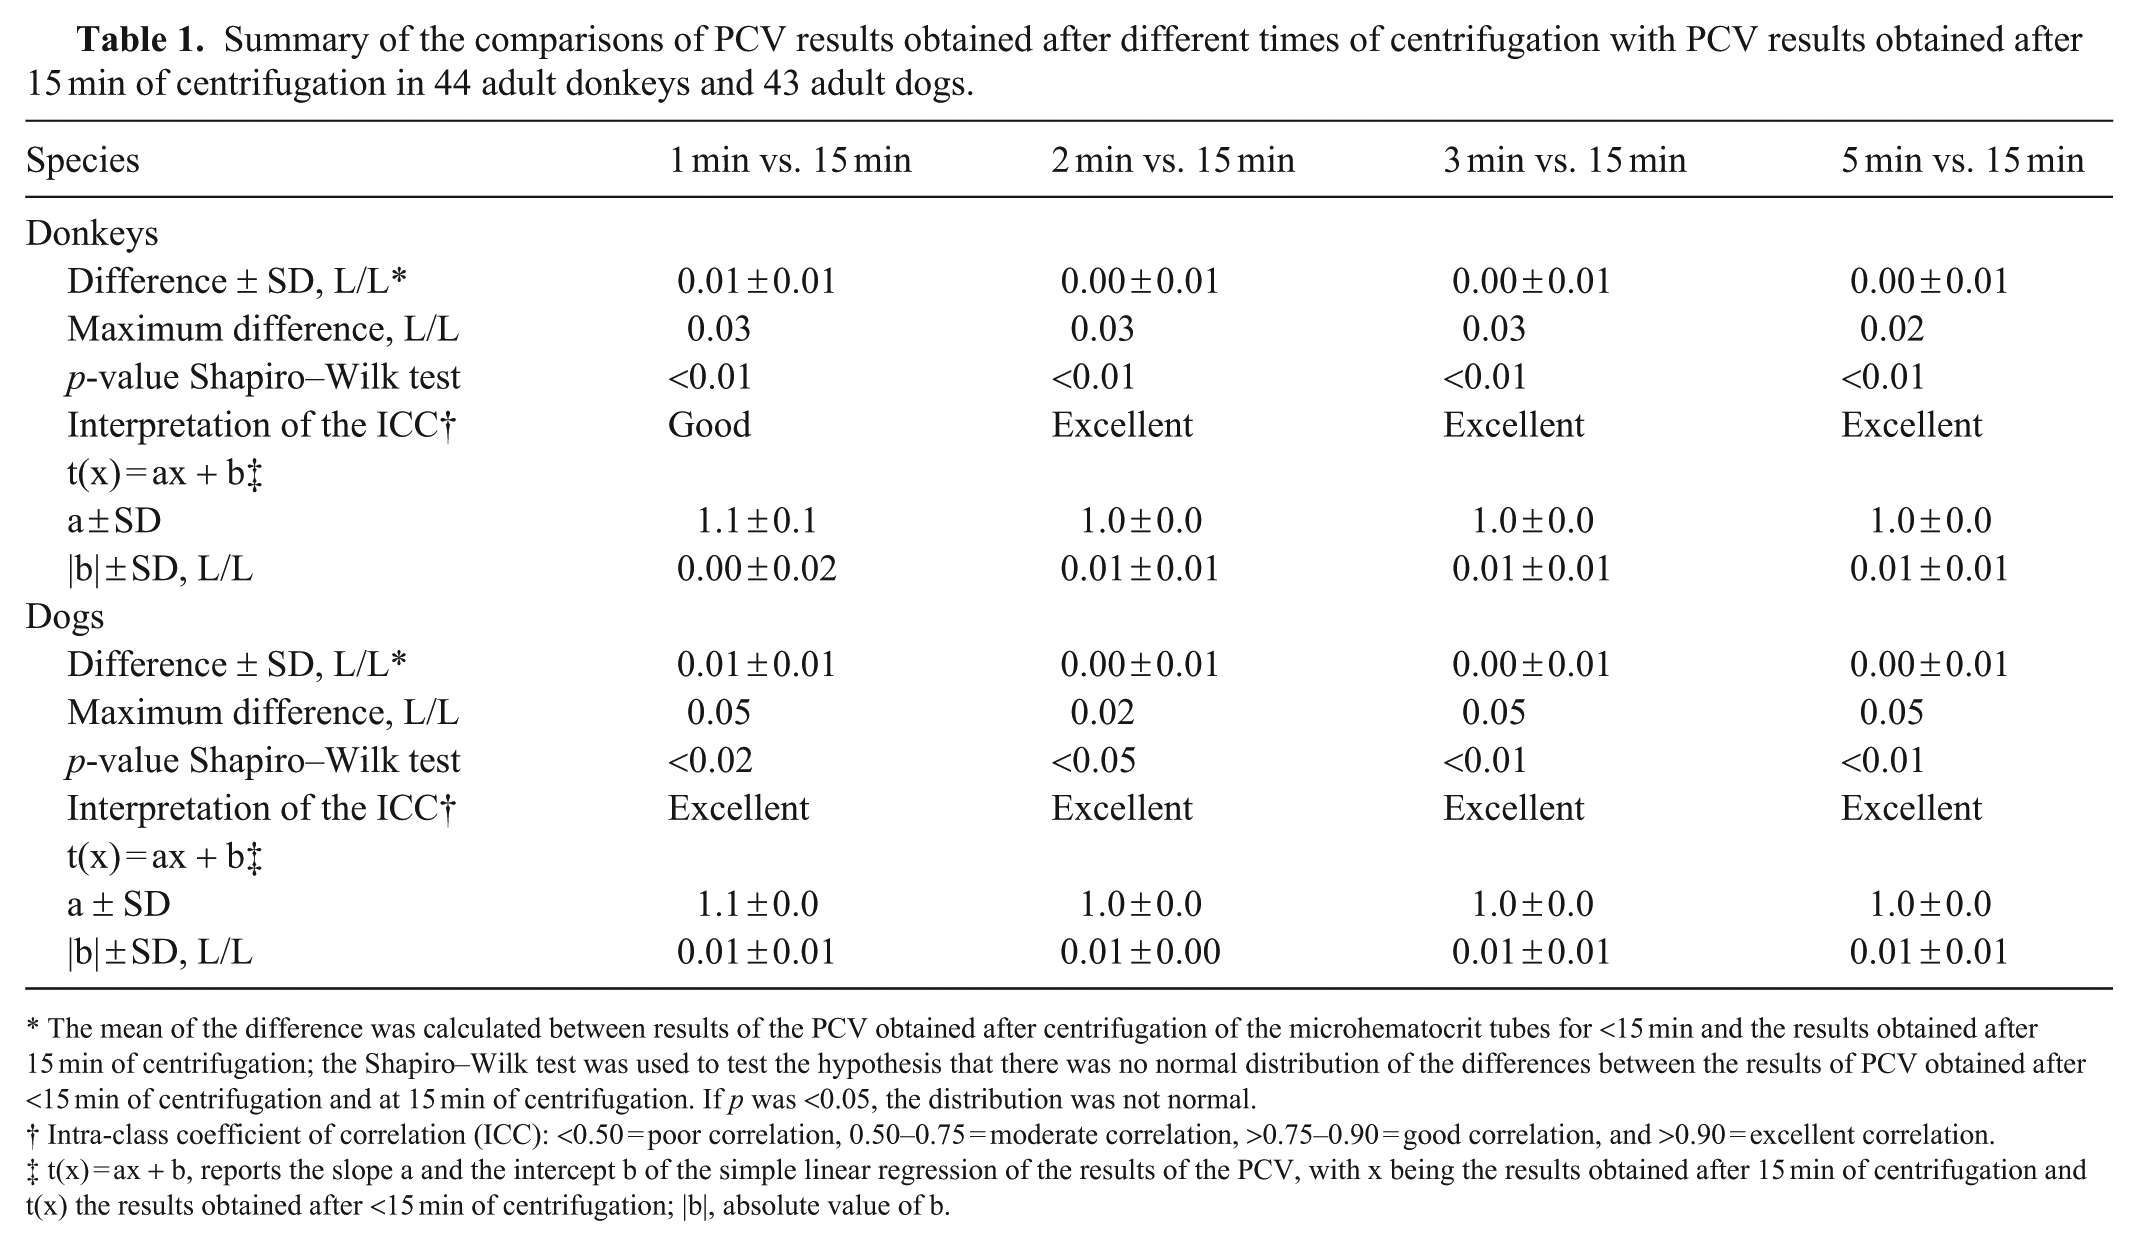
The mean of the difference was calculated between results of the PCV obtained after centrifugation of the microhematocrit tubes for <15 min and the results obtained after 15 min of centrifugation; the Shapiro–Wilk test was used to test the hypothesis that there was no normal distribution of the differences between the results of PCV obtained after <15 min of centrifugation and at 15 min of centrifugation. If p was <0.05, the distribution was not normal.
Intra-class coefficient of correlation (ICC): <0.50 = poor correlation, 0.50–0.75 = moderate correlation, >0.75–0.90 = good correlation, and >0.90 = excellent correlation.
t(x) = ax + b, reports the slope a and the intercept b of the simple linear regression of the results of the PCV, with x being the results obtained after 15 min of centrifugation and t(x) the results obtained after <15 min of centrifugation; |b|, absolute value of b.
Summary of the comparisons of PCV results obtained after different times of centrifugation with PCV results obtained after 15 min of centrifugation in 61 adult sheep and 40 adult cows.
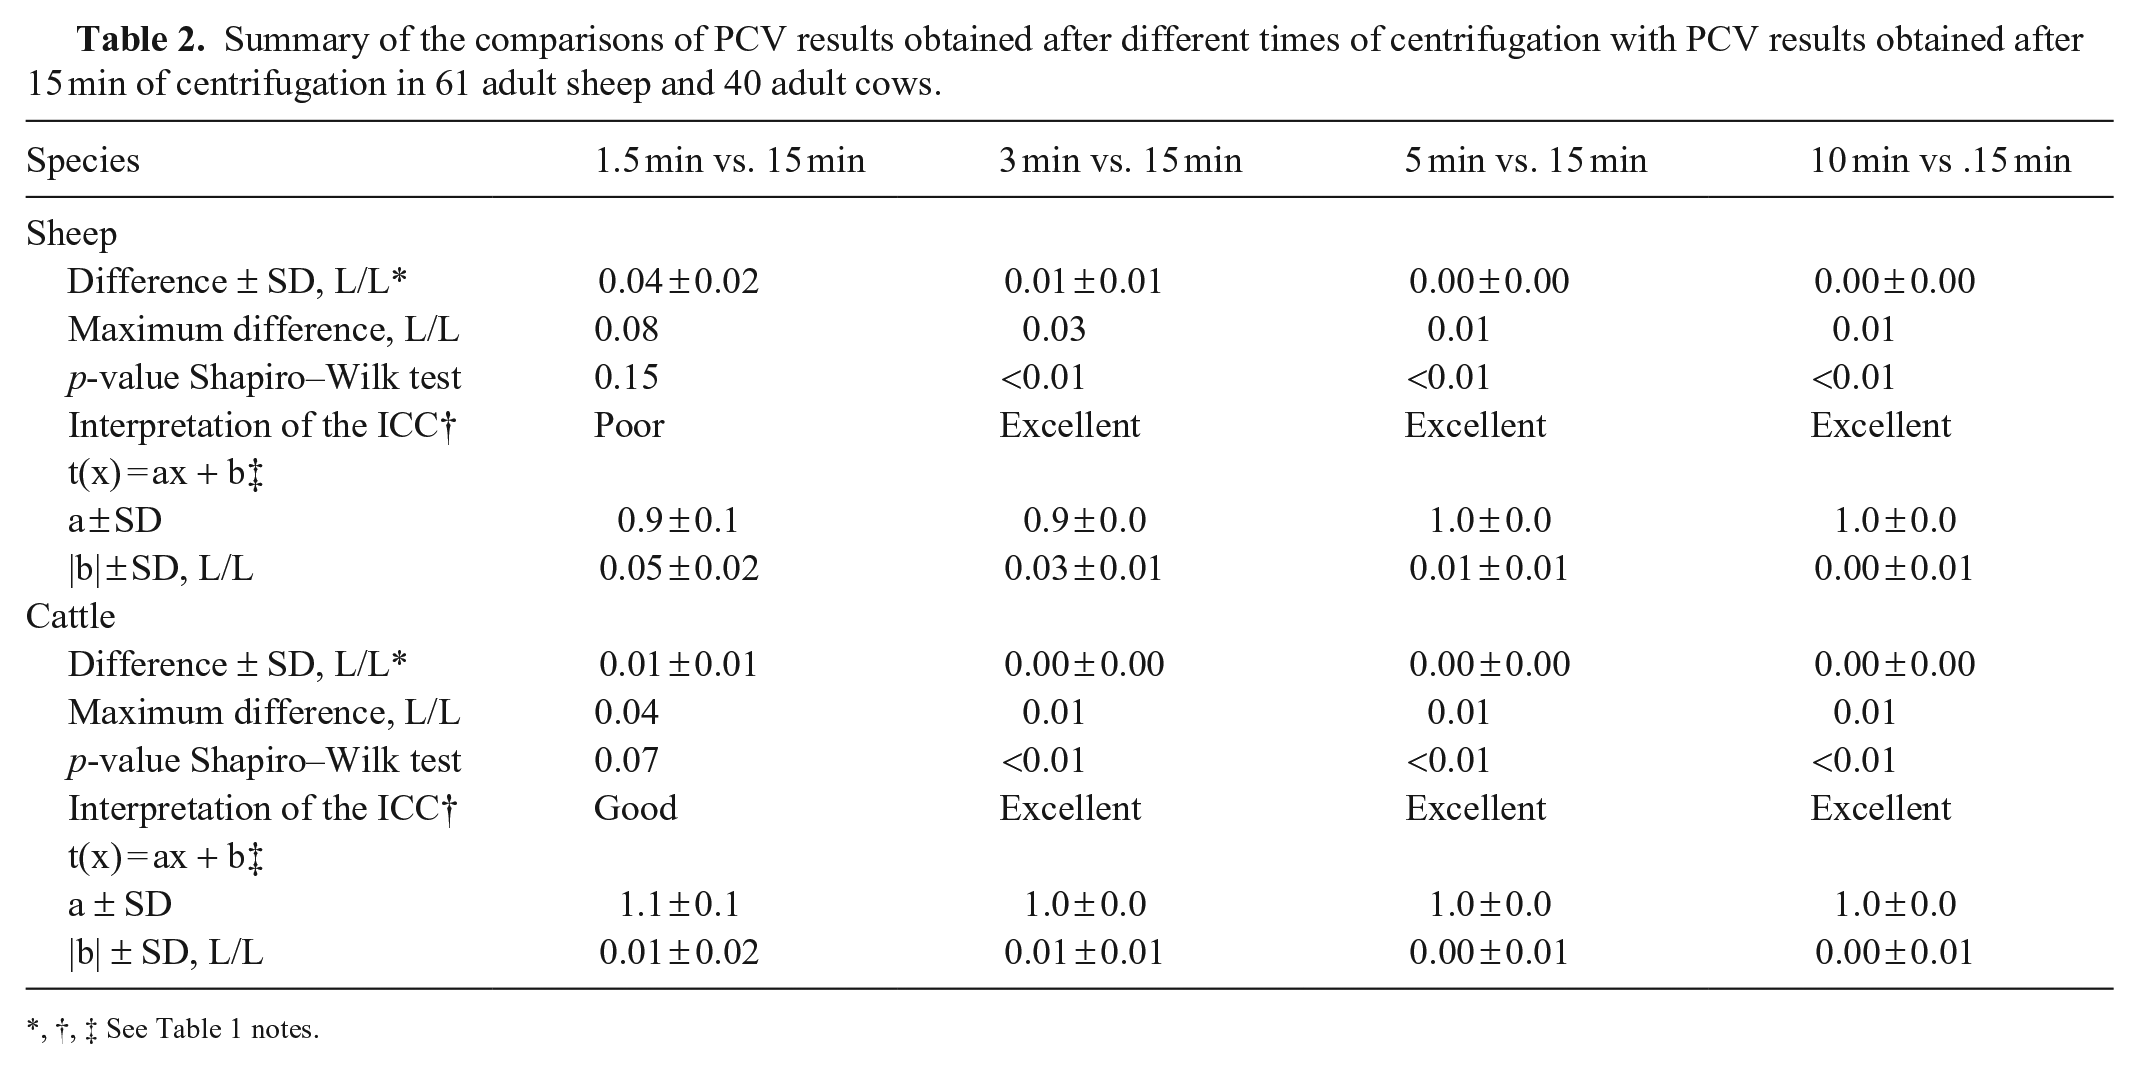
,†, ‡ See Table 1 notes.
Summary of the comparisons of total solids (TS) results obtained after different times of centrifugation with TS results obtained after 15 min of centrifugation in 44 adult donkeys and 43 adult dogs.
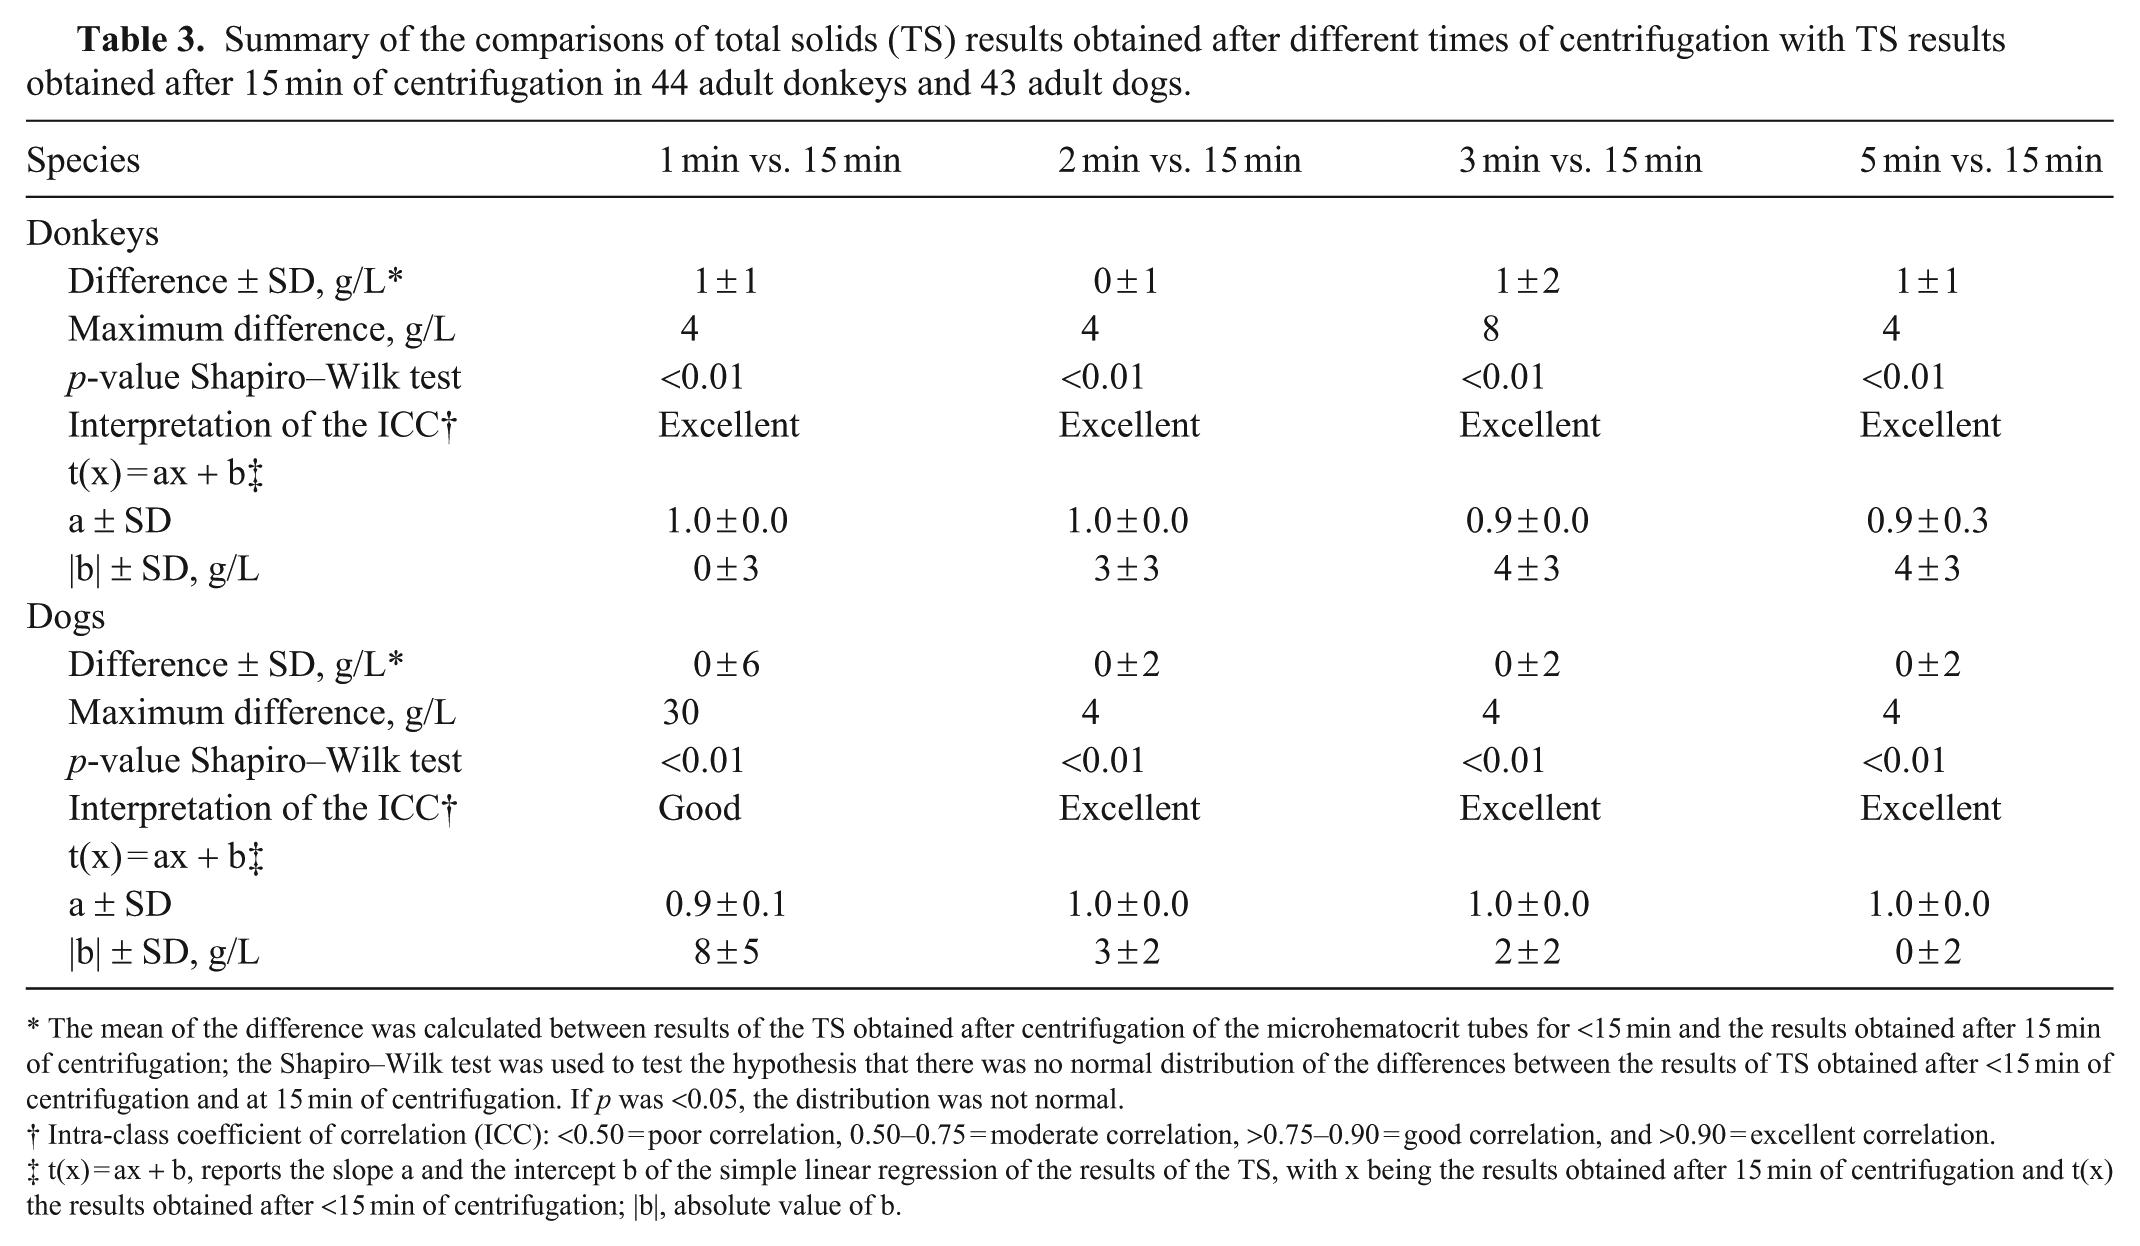
The mean of the difference was calculated between results of the TS obtained after centrifugation of the microhematocrit tubes for <15 min and the results obtained after 15 min of centrifugation; the Shapiro–Wilk test was used to test the hypothesis that there was no normal distribution of the differences between the results of TS obtained after <15 min of centrifugation and at 15 min of centrifugation. If p was <0.05, the distribution was not normal.
Intra-class coefficient of correlation (ICC): <0.50 = poor correlation, 0.50–0.75 = moderate correlation, >0.75–0.90 = good correlation, and >0.90 = excellent correlation.
t(x) = ax + b, reports the slope a and the intercept b of the simple linear regression of the results of the TS, with x being the results obtained after 15 min of centrifugation and t(x) the results obtained after <15 min of centrifugation; |b|, absolute value of b.
Summary of the comparisons of total solids (TS) results obtained after different times of centrifugation with TS results obtained after 15 min of centrifugation in 61 adult sheep and 40 adult cows.
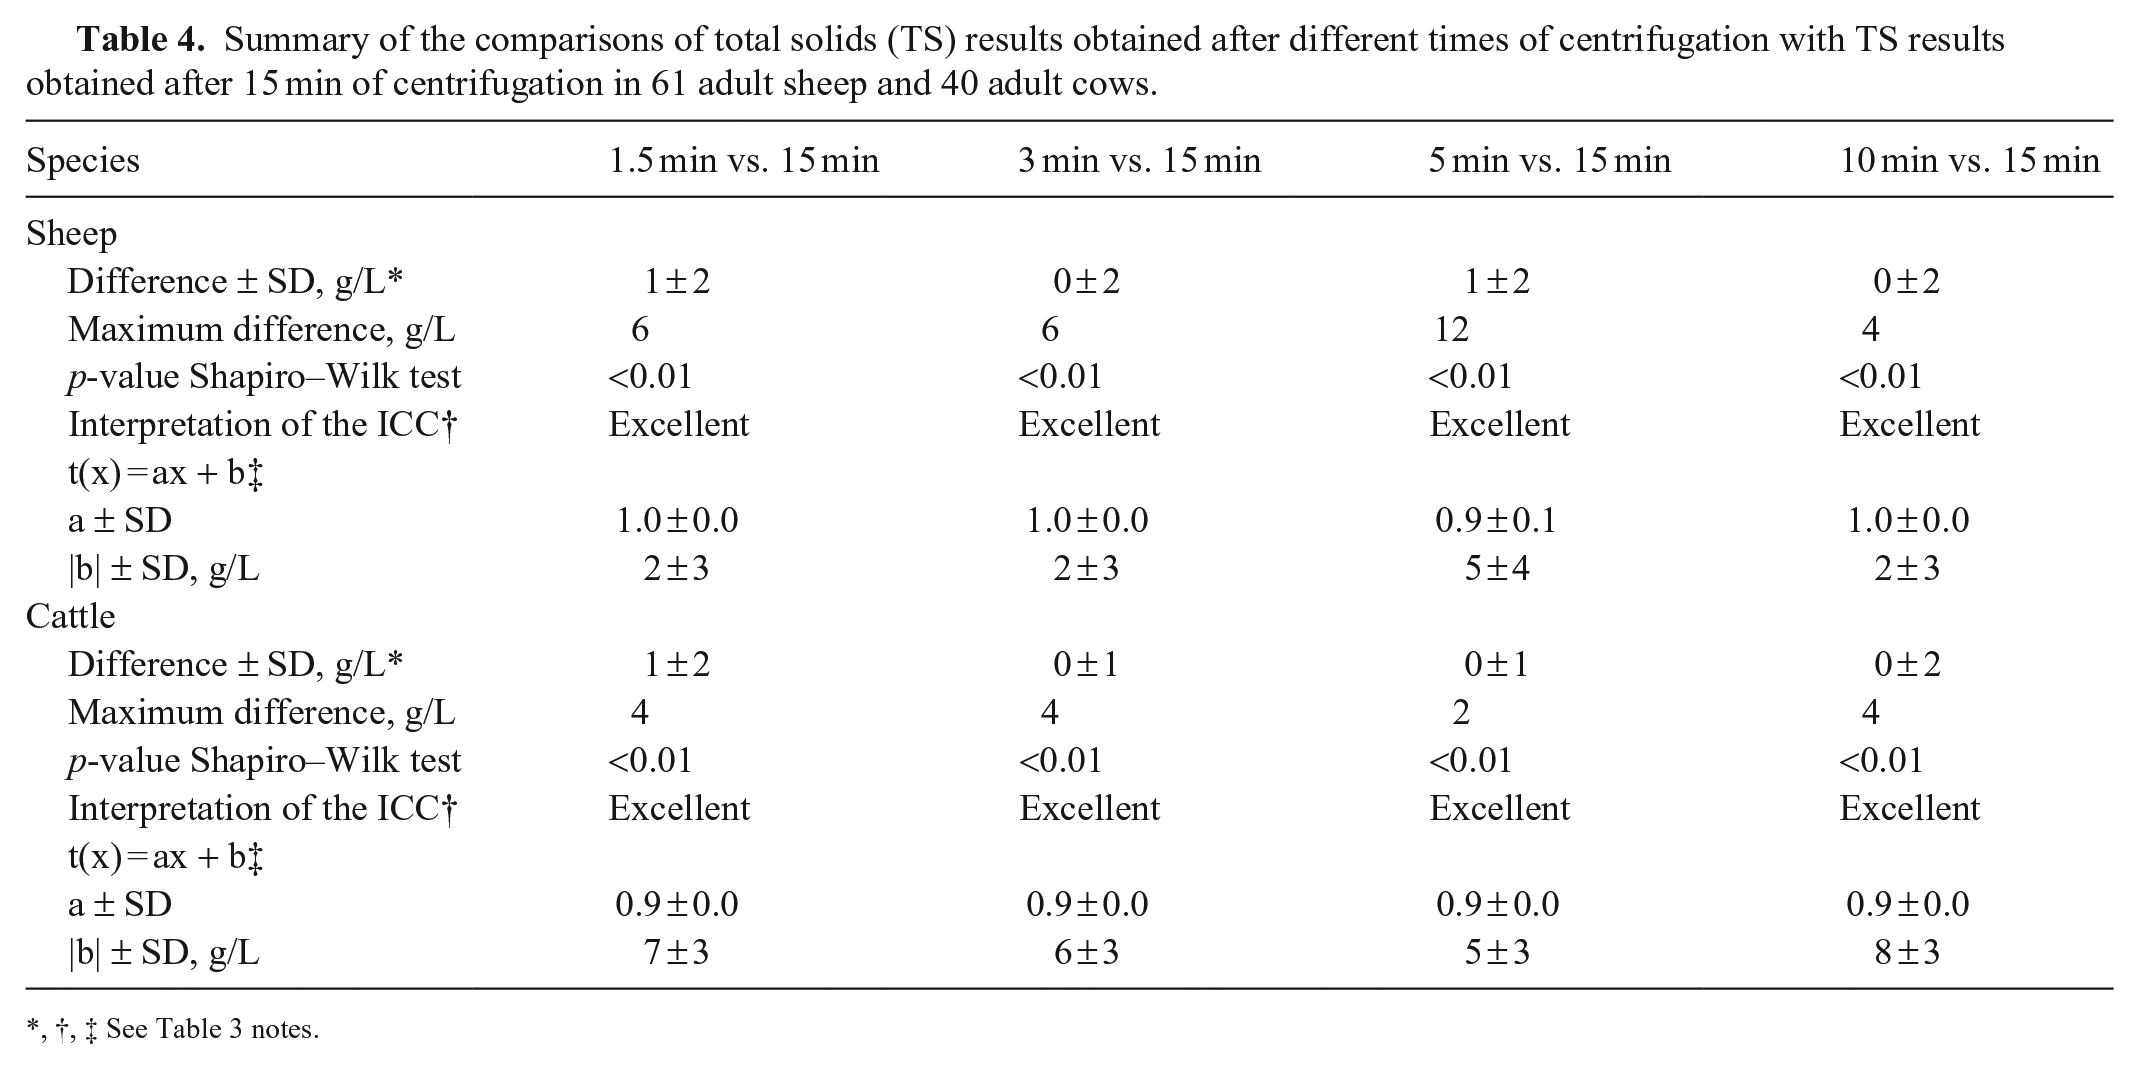
,†, ‡ See Table 3 notes.
For donkeys, 3 microhematocrit tubes broke or emptied during centrifugation. One donkey had a PCV reference value greater than the RI (0.41 L/L), and 7 donkeys had reference values of TS above the RI, with a maximum of 80 g/L (Suppl. Table 1). For PCV results, we found excellent ICC and a slope of 1 for the linear regression from 2 min; however, the intercept was 0.01 L/L (Table 1; Suppl. Table 1.1). Finally, we visualized a symmetrical distribution of differences between results obtained at each time of centrifugation and the reference values from 3 min (Fig. 2). For TS results, after 1 min of centrifugation, while we found excellent ICC and perfect agreement for the linear regression, the mean of the difference was 1 g/L. Centrifuging the samples for a longer time improved the mean of the difference only for 2 min, but intercepts deteriorated (Table 3; Suppl. Table 1.2). Finally, we visualized a symmetrical distribution of differences between results obtained at each time of centrifugation and the reference values from 1 min (Fig. 2).
For dogs, 5 microhematocrit tubes broke or emptied during centrifugation. Nineteen dogs had PCV values below the RI, with a minimum value of 0.28 L/L, and 22 dogs had TS values outside the RI, with a minimum of 58 g/L and a maximum of 108 g/L (Suppl. Table 2). For PCV results, we found excellent ICC and a slope of 1 for the linear regression from 2 min; however, the intercept remained at 0.01 L/L (Table 1; Suppl. Table 2.1). Finally, we visualized a symmetrical distribution of differences between results obtained at each time of centrifugation and the reference values from 3 min (Fig. 2). For TS results, after 2 min of centrifugation, we found excellent ICC and a slope of 1 for the linear regression; however, the intercept was 3 g/L. Centrifuging the samples for a longer time improved the intercept, and we found perfect agreement after 5 min of centrifugation (Table 3). Finally, we visualized a symmetrical distribution of differences between results obtained at each time of centrifugation and the reference values from 1 min (Fig. 2).
For sheep, 10 microhematocrit tubes broke or emptied during centrifugation. Thirty-two sheep had PCV values below the RI, with a minimum of 0.19 L/L, and 9 sheep had TS values above the RI, with a maximum of 82 g/L (Suppl. Table 3). For PCV results, we found excellent ICC and perfect agreement for the linear regression, and we visualized symmetrical distribution of differences between results obtained at each time of centrifugation and the reference values at 10 min (Table 2; Fig. 2; Suppl. Table 3.1). For TS results, after 1.5 min of centrifugation, we found excellent ICC and a slope of 1 for the linear regression; however, the intercept was 2 g/L. Interestingly, at 5 min of centrifugation only, these parameters deteriorated (Table 4; Suppl. Table 3.2). Finally, we visualized a symmetrical distribution of differences between results obtained at each time of centrifugation and the reference values at 3 and 10 min (Fig. 2).
For cows, a single microhematocrit tube emptied during centrifugation. All of the PCV values were within the RI; 3 cows had TS values above the RI, with a maximal value of 84 g/L (Suppl. Table 4). For PCV results, we found excellent ICC and perfect agreement for the linear regression from 5 min (Table 2; Suppl. Table 4.1). Finally, we visualized a symmetrical distribution of differences between results obtained at each time of centrifugation and the reference values from 5 min (Fig. 2). For TS results, we found an excellent ICC from 1.5 min; however, we did not find perfect agreement at any time of centrifugation. The slope was 0.9 for every time point, and intercepts were 5–8 g/L. After 5 min of centrifugation, we found an intercept of 5 g/L, which is the minimum value among all the times of centrifugation (Table 4; Suppl. Table 4.2). Finally, we visualized a symmetrical distribution of differences between results obtained at each time of centrifugation and the reference values from 3 min (Fig. 2).
Discussion
Combining ICC values, linear regressions, and visual assessment of the symmetry of difference plots, we estimate that a minimum of 3 min of centrifugation of blood for donkeys and dogs, 10 min for sheep, and 5 min for cattle give PCV and TS results in agreement with the values obtained after 15 min of centrifugation. Noteworthy, other statistical approaches can be used to compare methods; for instance, the American Society for Veterinary Clinical Pathology recommends the use of the Pearson correlation coefficient (r) to choose the statistical regression method to estimate bias. 1 Namely, for r >0.99, linear regression is recommended, whereas for r <0.975, a paired t-test is recommended (if there is no proportional error) or, alternatively, other types of regressions (Passing–Bablok or Deming) can be used. We reported Pearson correlation coefficients (Suppl. Tables 1–4).
While perfect agreement may be ideal, some limited error (imprecision and/or bias) may be acceptable for proper clinical decision-making. We did not quantify imprecision (intra- and inter-operator variabilities) of the PCV in our study; however, the readings by the operators differed by a maximum of 0.02 L/L for all except one sample, which is within acceptable variation for clinical decision-making. 2 The PCV result read on the card can differ between measurements if the tube is not placed strictly perpendicular to the bottom line of the reader, if the top part of the wax in the microhematocrit tube is not strictly perpendicular to the tube, and if the meniscus is not correctly placed, which can be difficult to identify when a buffy coat is present. Noteworthy, the quality requirement consensus in veterinary medicine for PCV is an observed total error (TEo) lower than a total allowable error (TEa) of 10%. 11 The TEo can be calculated as 2CV + bias, with CV (%) = (SD/meantarget) × 100% and bias (%) = [(meantarget – meanmeasured)/meantarget] × 100%, 11 where SD is the SD of the difference between the duplicate PCV measurements, meantarget is the mean of the reference values at 15 min, and meanmeasured is the mean of the duplicate of PCV for each animal, at each time of centrifugation. In our study, we found all TEo <10% except for the donkeys at 1 min and for the sheep at 1.5 min (Suppl. Table 5).
Overall, the centrifugation times appear to be consistent with the sedimentation rates reported for these species.12,13 In addition, using the RIs of the RUSVM laboratory, the mean corpuscular volumes of the RBCs are, in decreasing order, 60–70 fL in dogs, 40–60 fL in cows, 37–59 fL in donkeys, and 28–40 fL in sheep. Considering that equid blood forms rouleaux and rouleaux are bigger than RBCs alone, it seems that the smaller the RBCs are, the longer the centrifugation time. Further studies are warranted to confirm this observation.
We did not quantify imprecision of the TS in our study, but when investigators agreed on TS values, if a difference was initially present, it was consistent with inter-operator variability previously reported. 14 We found perfect agreement with excellent ICC only in donkeys after 1 min of centrifugation. However, on the refractometer, the graduations are in 2-g/L increments, and the line of reading is blurry, so we considered that a variation of ±2 g/L is acceptable. Therefore, providing an excellent ICC and a slope of 1, we can accept an intercept of 2 g/L to determine the appropriate centrifugation time for TS measurement. The conditions were reached at 3 min in dogs and sheep. In cattle, we never found a slope of 1 on the linear regression. After 5 min of centrifugation, despite an intercept of 5 g/L, the maximum difference was 2 g/L. These may be acceptable variations for clinical decisions, considering that patient management should not be based solely on one parameter of blood analysis. Further validation is desirable in this species. In addition, for donkeys and cattle, with longer centrifugation times, slope and intercepts of the linear regression deteriorated. While this makes no sense scientifically, these variations may reflect the few animals with values outside the RI in the population enrolled (see comment in the limitation paragraph). The measures of PCV and TS are rarely performed independently; therefore, the longer centrifugation time between PCV and TS should be used (i.e., 3 min in dogs and donkeys, 10 min in sheep, and 5 min in cows). Noteworthy, while there is no quality requirement consensus in veterinary medicine for TS, the requirement for total proteins, analyzed with automatic analyzers, is a TEo lower than a TEa of 10%. 7 Further studies are desirable to determine TEa, TEo, bias, imprecision, and intra- and inter-observer in veterinary medicine for TS measured by refractometry.
We found no reports of maximum or minimum time of centrifugation to obtain an accurate PCV measurement in veterinary medicine in a search of PubMed, Europe PMC, CAB Direct, and Google Scholar using the search terms “minimal”, “maximum”, “time”, “centrifugation”, “microhematocrit”, “veterinary”. Therefore, we arbitrarily used 15 min as our reference value. In humans, lysis and alteration of RBC mechanical properties occurred with RCF as low as 900 × g. 16 Noteworthy, increasing pressure applied to blood samples decreased the MCV, but increasing the RCF increased the MCV. 16 Therefore, using the results of PCV and TS after 15 min of centrifugation, at <14,972 × g, as reference values warrants further investigation. In addition, there was no guideline regarding how many microhematocrit tubes should be read for measuring the PCV in veterinary medicine. In human medicine, the CLSI and WHO recommend reading 2 tubes, and the difference between the results should be <0.005 L/L.3,17 This increment is not applicable to the triangulation-type hematocrit reader cards that we used. Precise guidelines on methods to read PCV in veterinary medicine warrant further investigation; however, reading 2 hematocrit tubes by 2 different readers and averaging the result was specific for our protocol and we do not recommend doing this in a clinical context.
Importantly, we focused our study on centrifugation time; however, several other parameters are involved in the centrifugation process, such as the radius of the centrifuge rotor and the RCF. Other parameters, such as medium density and particle size and density, are also involved, although these may be considered approximately constant in blood for a given species. Because the necessary time to achieve maximal packing may vary by centrifuge model and manufacturer, the CLSI and WHO recommend calibrating the revolutions, timer, and time to maximal packing of cells for the individual centrifuge. They also recommend using a centrifuge rotor with a radius >8 cm, capable of reaching maximum revolution in 30 s and sustaining a RCF of 10,000–15,000 × g for at least 5 min without the temperature of the rotor exceeding 45°C.3,17 The CLSI does not recommend the use of centrifuges that operate outside of this range but states that most commercial centrifuges produce acceptable results. 3 The impact of such parameters has not been investigated for each individual species in veterinary medicine and warrants further study. However, based on the manufacturer’s specification of the microhematocrit centrifuge that we used, while the time to reach maximum revolutions and the temperature of the rotor were not reported, the other WHO and CLSI recommendations on centrifuge specification (i.e., radius and RCF) were met. Therefore, our findings should be reproducible with centrifuges fulfilling the same requirements, which should represent most of the microhematocrit centrifuges on the market. Further studies are warranted on the use of different centrifuges.
In human medicine, the WHO recommends an annual determination of centrifugation time for each individual centrifuge by spinning samples from normal and polycythemic blood (PCV > 0.50 L/L) in 30-s increments until a plateau in PCV is reached. 17 The accuracy of this method for animal samples has not been investigated. Such investigation could complete the findings of our study and allow each veterinary practice to determine accurate centrifugation times. However, sourcing polycythemic blood may be challenging, especially in clinics in which dehydrated patients are not commonly presented. Sample dilution and concentration can be performed for quality control, but are time-consuming and require trained staff as well as a well-designed protocol. 11 It might be doable to perform a similar calibration study aiming for a PCV plateau with normocythemic samples.
There were several limitations to our study. Investigators were not blinded to the samples used or the results reported by the other investigator at the time of reading of microhematocrit tubes. In addition, only one tube was used to read the TS to ensure timely processing of samples after collection. This method is also consistent with our clinical experience. Another limitation may be the lack of strict adherence to the WHO guidelines for handling blood samples used for PCV. 17 Although the tubes were inverted at least 3 times after blood collection, the WHO recommends inverting tubes 8–10 times, which might not have occurred for some samples in our study. While we did not detect blood clots in any samples, it is unknown how this could affect our findings. In addition, the WHO recommends filling the microhematocrit tubes for two-thirds to three-quarters of their length. Filling was performed by capillary action, and while no tubes were underfilled, some tubes might have been overfilled as tubes lacked graduations. However, this should have little impact on the final measurement of PCV. 2 Additionally, recommendations for human samples have not been validated for animal samples, and further investigation is warranted to provide evidence-based guidelines for handling animal samples to determine PCV and TS. Finally, although we aimed to include healthy animals with PCV and TS values within the RIs, we included all samples to reach the minimum number of 40 animals. Indeed, sourcing animals was difficult due to the global COVID-19 pandemic restrictions when we conducted our study.
Finally, for the comparison of PCV values obtained at different centrifugation times, the animals enrolled had a narrow range, as the PCVs at 15 min of all cattle and most donkeys enrolled were within RIs, and no polycythemic animals were included. Enrolling a broader population for each species would improve the results of a study. 1 Further studies are warranted to confirm that our findings are applicable regardless of the anticoagulant used, patient health status, and all other parameters discussed.
Supplemental Material
sj-pdf-1-vdi-10.1177_10406387251362461 – Supplemental material for Estimation of minimum centrifugation time of microhematocrit tubes to obtain accurate results of packed cell volume and total solids in donkeys, dogs, sheep, and cows
Supplemental material, sj-pdf-1-vdi-10.1177_10406387251362461 for Estimation of minimum centrifugation time of microhematocrit tubes to obtain accurate results of packed cell volume and total solids in donkeys, dogs, sheep, and cows by Dreyton Oliva, Hélène Lardé, Juliette Bouillon, Ronan Whiston, Andrea Peda, Patricia Dowling and Ronan J. J. Chapuis in Journal of Veterinary Diagnostic Investigation
Footnotes
Acknowledgements
We thank Dr. Anne Conan, Centre de coopération international pour la Recherche agronomique et le development (Cirad), for her assistance in designing the study; Dr. Valerie Morales Coll, for her assistance in the writing of the grant request; the European Buiatric Congress held in Nantes in 2025 for accepting the abstract for poster presentation entitled “Estimation of minimum centrifugation time of microhematocrit tubes to obtain accurate values of packed cell volume and total solids in ruminants”; Dr. Patrice Lepelletier, Innovation Territoire, Agriculture & Agroindustrie, Connaissance et Technologie (InTerACT, UniLaSalle, Rouen/Beauvais) for his review of the PCV imprecision; and Dr. Margot Michaud for her assistance in the design of the figures.
Declaration of conflicting interests
The authors declared no potential conflicts of interest with respect to the research, authorship, and/or publication of this article.
Funding
The RUSVM funded the study under intramural grant 42015-2021.
Supplemental material
Supplemental material for this article is available online.
References
Supplementary Material
Please find the following supplemental material available below.
For Open Access articles published under a Creative Commons License, all supplemental material carries the same license as the article it is associated with.
For non-Open Access articles published, all supplemental material carries a non-exclusive license, and permission requests for re-use of supplemental material or any part of supplemental material shall be sent directly to the copyright owner as specified in the copyright notice associated with the article.