
Abstract
To expand surveillance testing capacity through sample pooling, a thorough understanding is needed of how sample dilution through pooling affects the sensitivity of candidate assays. We validated a robust and representative framework for assessing the dilution effect of sample pooling using duplex rtPCR surveillance of Theileria orientalis and Anaplasma marginale, both of which are causative agents of severe anemia in cattle and a serious threat to the cattle industry in Virginia and many other states. We used 200 known-positive samples with Ct values representative of typical surveillance results in a series of pools in which we re-tested each sample individually, followed by each sample diluted in equal volumes with negative samples to make pools of 2, 4, 6, 8, and 10 total samples. We compared the Ct values of the individual positives with the Ct values of each pool size to determine if Ct values increase past the limit of detection in the 45-cycle assay. We observed a maximum of 2% sensitivity loss (no more than 2 of 100 samples returned a false-negative result) for both T. orientalis and A. marginale during the pooling series, with lower-than-expected average Ct increase and sensitivity loss. We conclude that pooling up to 10 samples would be acceptable for regional surveillance of T. orientalis and A. marginale using our rtPCR assay. The described strategy is applicable to validate pooling for a wide range of single and duplex rtPCR assays, which could expand efficient disease surveillance.
Surveillance testing is critical for understanding and controlling the spread of pathogens, but can consume significant laboratory resources, personnel, equipment, and time. 10 Pooling samples to test low-prevalence populations enables more samples to be tested while using fewer reagents and laboratory consumables, and is less time-intensive for laboratory personnel.1,2,11 Sample pooling has been used to enhance testing capacity since the 1940s, 9 which consisted of the combination of blood samples to be examined as a group, with individuals in negative groups presumed negative, and individuals in positive groups being re-tested, reducing the number of tests required compared to all samples being tested individually. Since then, many sample pooling strategies have been developed to increase testing economy over different sample groups and testing scenarios in both human and veterinary disease surveillance.7,8,15,16,18,19,23,28,29
Testing economy can be maximized when a wide range of pool sizes can be used and assigned to the optimal prevalence condition. 28 However, to pool samples for testing, the dilution effect of negative samples on positive samples and resulting assay sensitivity must first be determined to avoid introducing bias into surveillance testing through false-negatives.5,27,30 Many studies used various dilution methods and pool sizes to test the dilution effect of sample pooling to accommodate high testing demand and supply chain shortages during the COVID-19 pandemic.2,4 –6,29 Having adequate pooling protocols allows laboratories to expand surveillance testing capacity despite limited high-throughput capabilities, 29 which would be especially advantageous for the routine surveillance required for disease management within herds as well as on larger scales.
Theileria orientalis is an emerging tick-borne parasite causing anemic disease in cattle on the east coast of the United States, where surveillance testing is critical for management.13,21 While severe infection with T. orientalis can result in death, infections can also persist subclinically, and would only be identified through surveillance testing.12,20,26 Anaplasma marginale is endemic in the same geographic area and causes similar disease, but is treatable with antibiotics whereas theileriosis is not.3,22
Because anaplasmosis and theileriosis share similar presentation, regional overlap, and can be coinfections, we developed a duplex real-time PCR (rtPCR) assay to test for both A. marginale and T. orientalis. 22 Our assay has 100% relative diagnostic sensitivity (DSe) and diagnostic specificity (DSp) for T. orientalis at 45 cycles, and 97% relative DSe and 100% relative DSp for A. marginale at 38 cycles, as determined previously. 22 Specificity is typically considered to be constant when pooling samples; 27 however, the dilution effect of sample pooling on DSe must be determined to implement sample pooling in surveillance testing and improve the extent and cost-effectiveness of surveillance for these pathogens.
A robust assessment of the dilution effect using samples typical of surveillance, which are often low-grade infections, as opposed to clinical samples, is critical for the introduction of pooling protocols in any surveillance program. We aimed to validate a framework to determine the dilution effect when developing pooling protocols for rtPCR assays by determining sensitivity loss incurred over a range of pool sizes for T. orientalis and A. marginale duplex rtPCR surveillance testing.
Materials and methods
Historical surveillance Ct distribution
To assess assay sensitivity in increasing pooling sizes, we used whole-blood EDTA samples that had been submitted for surveillance testing from Virginia and surrounding states in 2018–2022. All samples had been tested upon receipt at the laboratory using our duplex rtPCR assay and stored at 4°C. The distribution of Ct values from the most-recent 1,000 T. orientalis–positive and 300 A. marginale–positive samples was determined using the average of duplicate Ct values for each sample. The distributions of 1,000 and 300 samples were subsampled by averaged Ct value to yield 100 T. orientalis–positive and 100 A. marginale–positive samples considered representative of typical surveillance results to develop a series of pools to assess the dilution effect on assay sensitivity. Of the samples selected for the pooling series, 33 had tested positive for both A. marginale and T. orientalis and were used in both subsampled groups for a total of 167 unique blood samples to replicate 200 results (100 T. orientalis and 100 A. marginale).
Pooling series
For each positive blood sample, DNA extraction and duplex rtPCR were performed to assess a possible increase in Ct value due to sample degradation over time and establish a starting (undiluted) Ct value. Ct values of 2 replicate rtPCR reactions were averaged for each sample and subsequent pools. Re-tested individual samples with an averaged Ct value >2 away from its original test results were excluded, and this process was repeated for another sample with a similar Ct average to maintain the 100-sample distribution. A portion of each positive sample was diluted with equal volumes of 1, 3, 5, 7, and 9 other whole-blood samples that had tested negative for both A. marginale and T. orientalis using our duplex rtPCR assay for a total volume of 150 µL, creating pool sizes of 2, 4, 6, 8, and 10 samples (Fig. 1). All samples were inverted several times at room temperature to evenly distribute contents before pooling. We selected 10-sample pools as the upper limit because it was previously estimated to maintain assay DSe for both T. orientalis and A. marginale using our duplex rtPCR assay. 28
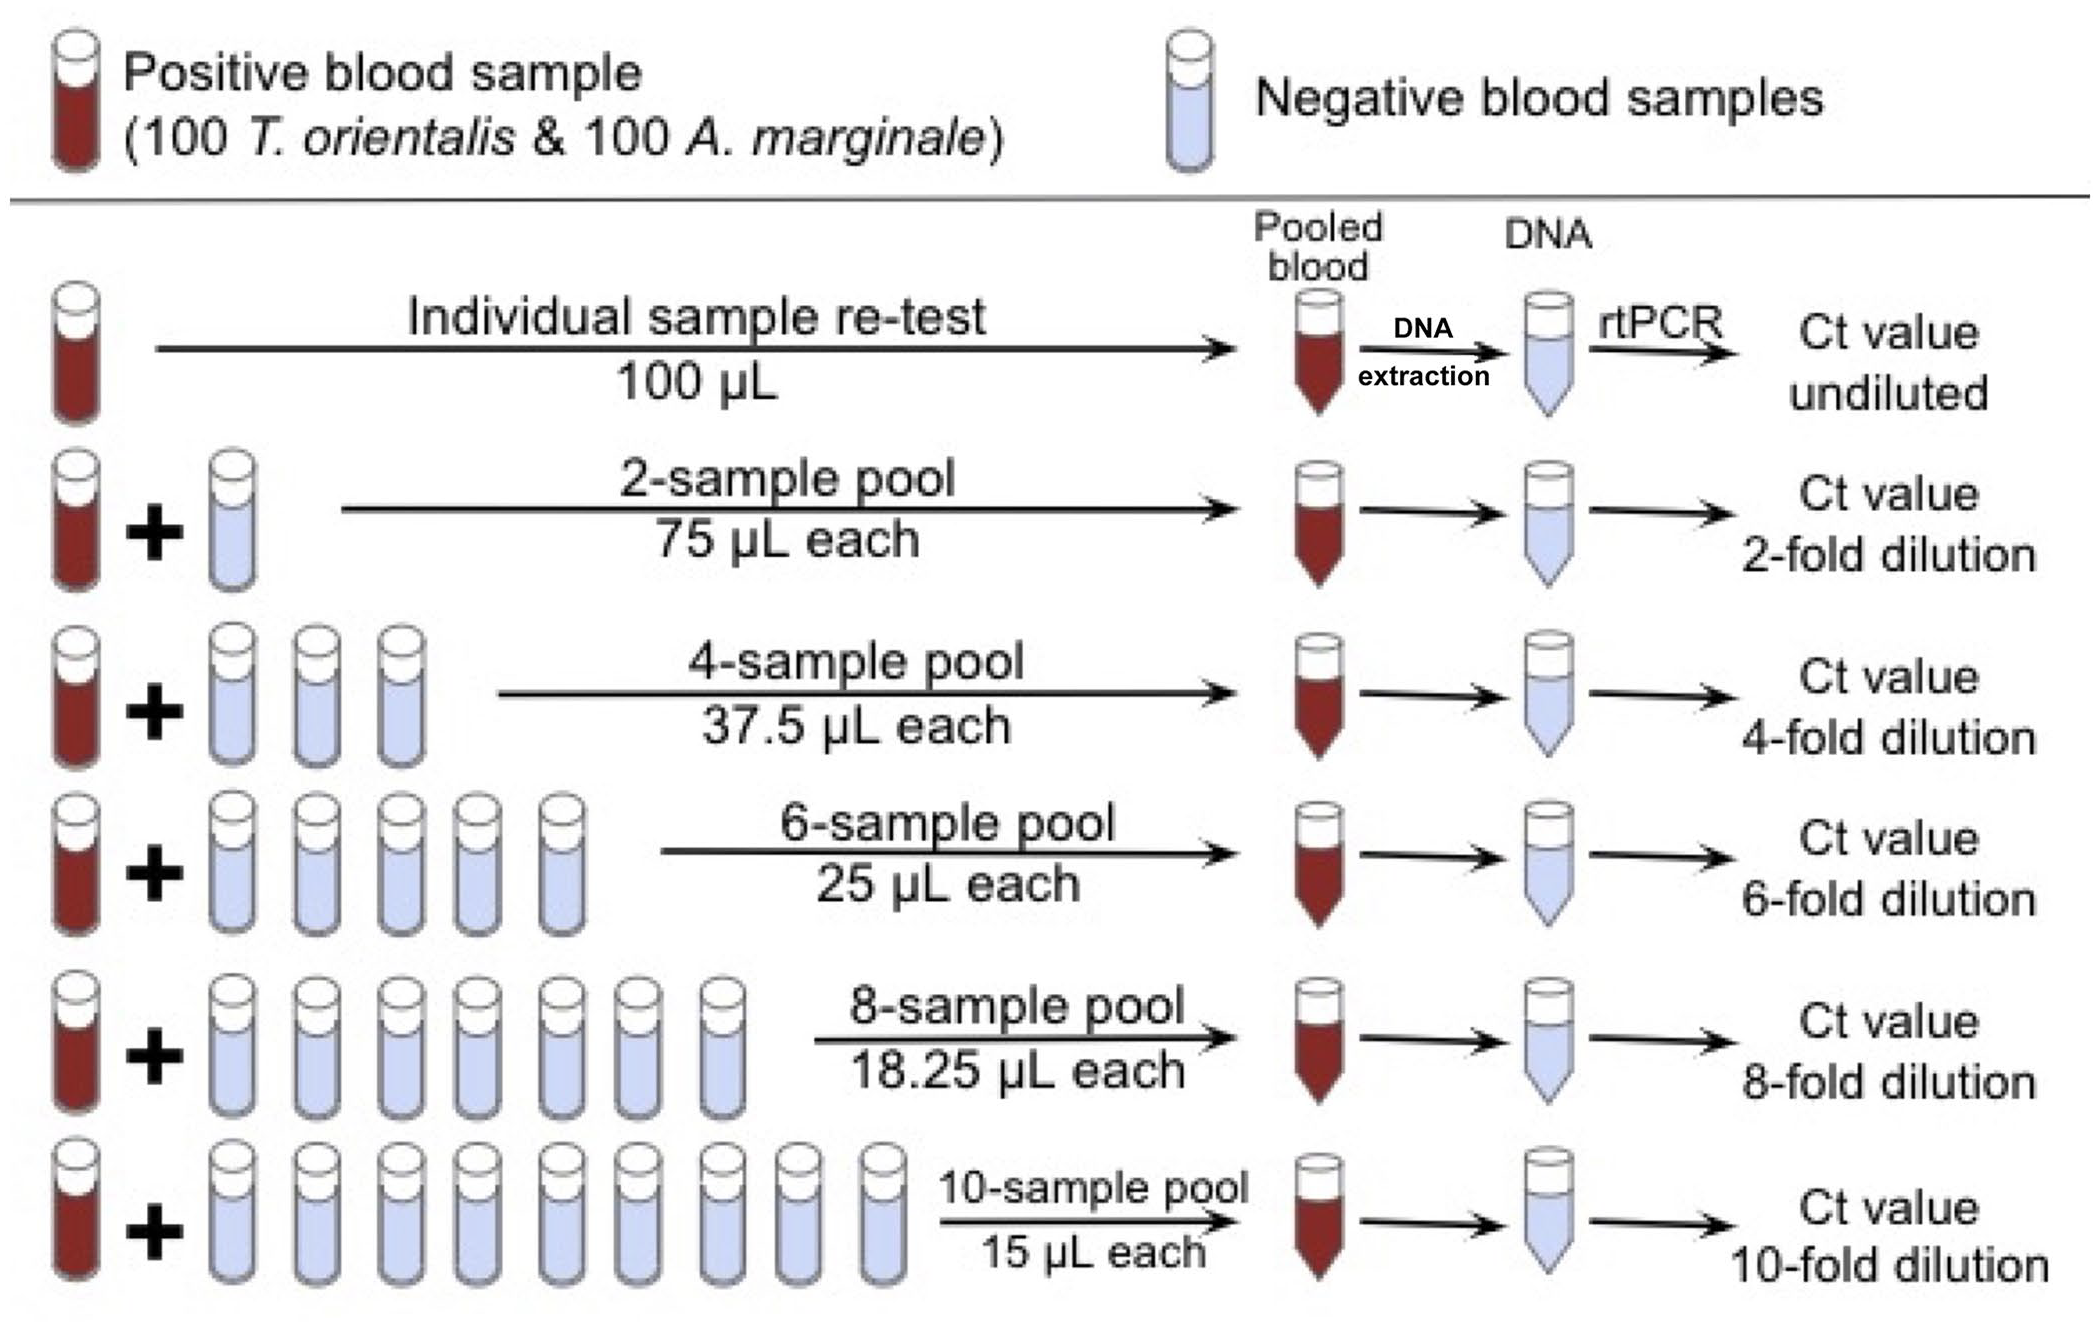
Pooling series method to test dilution effect using historical whole-blood samples. We re-tested each sample selected for the pooling series via DNA extraction and rtPCR as an individual, undiluted sample to establish a starting Ct. Each positive sample was then incorporated into 2, 4, 6, 8, and 10 sample pools by combining it with equal volumes of negative whole-blood sample(s) to a final volume of 150 µL for DNA extraction and rtPCR to compare pooled Ct results to individual Ct results for each positive sample.
DNA extraction and duplex rtPCR
DNA was extracted from 100 µL of each pool (DNeasy blood and tissue kit; Qiagen) using the nonnucleated blood protocol with minor alterations as described previously. 22 The T. orientalis and A. marginale duplex rtPCR assay was performed as described previously. 22 A pool was considered positive if at least one duplicate registered a Ct value within the 45-cycle assay. Pools that did not register a Ct value in either duplicate within the 45-cycle assay were considered false-negatives. All samples were run in duplicate, and the Ct values of both duplicates were averaged for analysis.
Analysis
The distributions of the 1,000 T. orientalis and 300 A. marginale samples and their corresponding 100 sample subsets were tested for normality using a Shapiro–Wilk test, as well as skewness and kurtosis. Ct average for each pool was compared to the corresponding undiluted (pool size = 1) Ct average to determine the Ct increase over increasing pool size for each positive sample. Average Ct increase and SD for all 100 positive samples was determined for each pool size for both T. orientalis and A. marginale. Samples that increased in Ct beyond the 45-cycle cutoff for both replicates (false negatives) represented a loss in DSe. Sensitivity with exact 95% CI was calculated for each pool size. Mean differences of Ct values between pool sizes were determined by one-way ANOVA and Tukey HSD post-hoc pairwise comparison. Assuming 100% assay efficiency, a 1 Ct increase was expected for each 2-fold dilution (2-sample increase in pool size). 17 Observed Ct increase for each pool size was compared with expected Ct increase and tested for significance using a Wilcoxon signed-rank paired t-test, with p ≤ 0.05 considered significant. Analyses were performed using Excel (v.16.77; Microsoft), R (https://www.r-project.org/), and packages within Tidyverse (https://www.tidyverse.org/). Plots were generated with ggplot2 (https://ggplot2.tidyverse.org/).
Results
Ct distribution
The mean Ct values for the 1,000-sample T. orientalis distribution (Fig. 2A) and the 300-sample A. marginale distribution (Fig. 2B) were 27.4 and 31.2, respectively, with 27.5 and 31.2 being the mean Ct values of the 100-sample distributions used for the pooling series (Fig. 2A, 2B). We found all 4 distributions to not be normally distributed (skewed ~0.55 to the right for T. orientalis; skewed −0.55 to the left for A. marginale). Throughout the pooling series, T. orientalis maintained an average skew of 0.58 towards lower Ct values, and A. marginale maintained an average −0.40 skew towards higher Ct values (Fig. 3A, 3B).
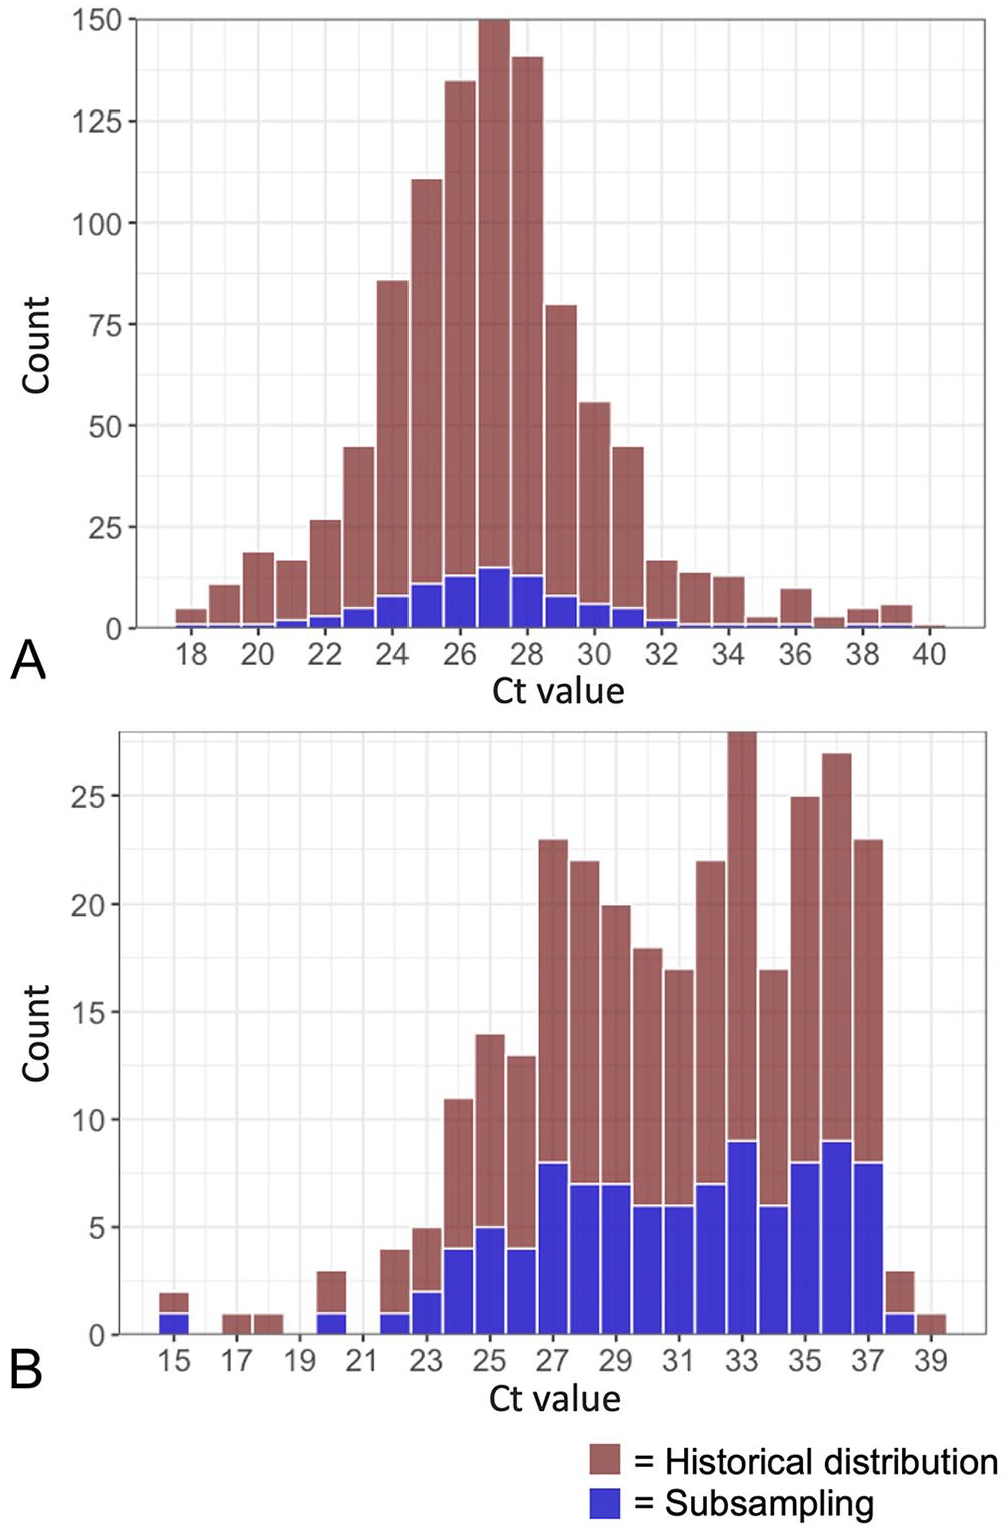
Distributions of positive historical surveillance Ct values with subsampling of results to be incorporated into pooling series. The distribution of Ct values from historical surveillance samples of cattle from Virginia and neighboring states submitted in 2018–2022 was determined for
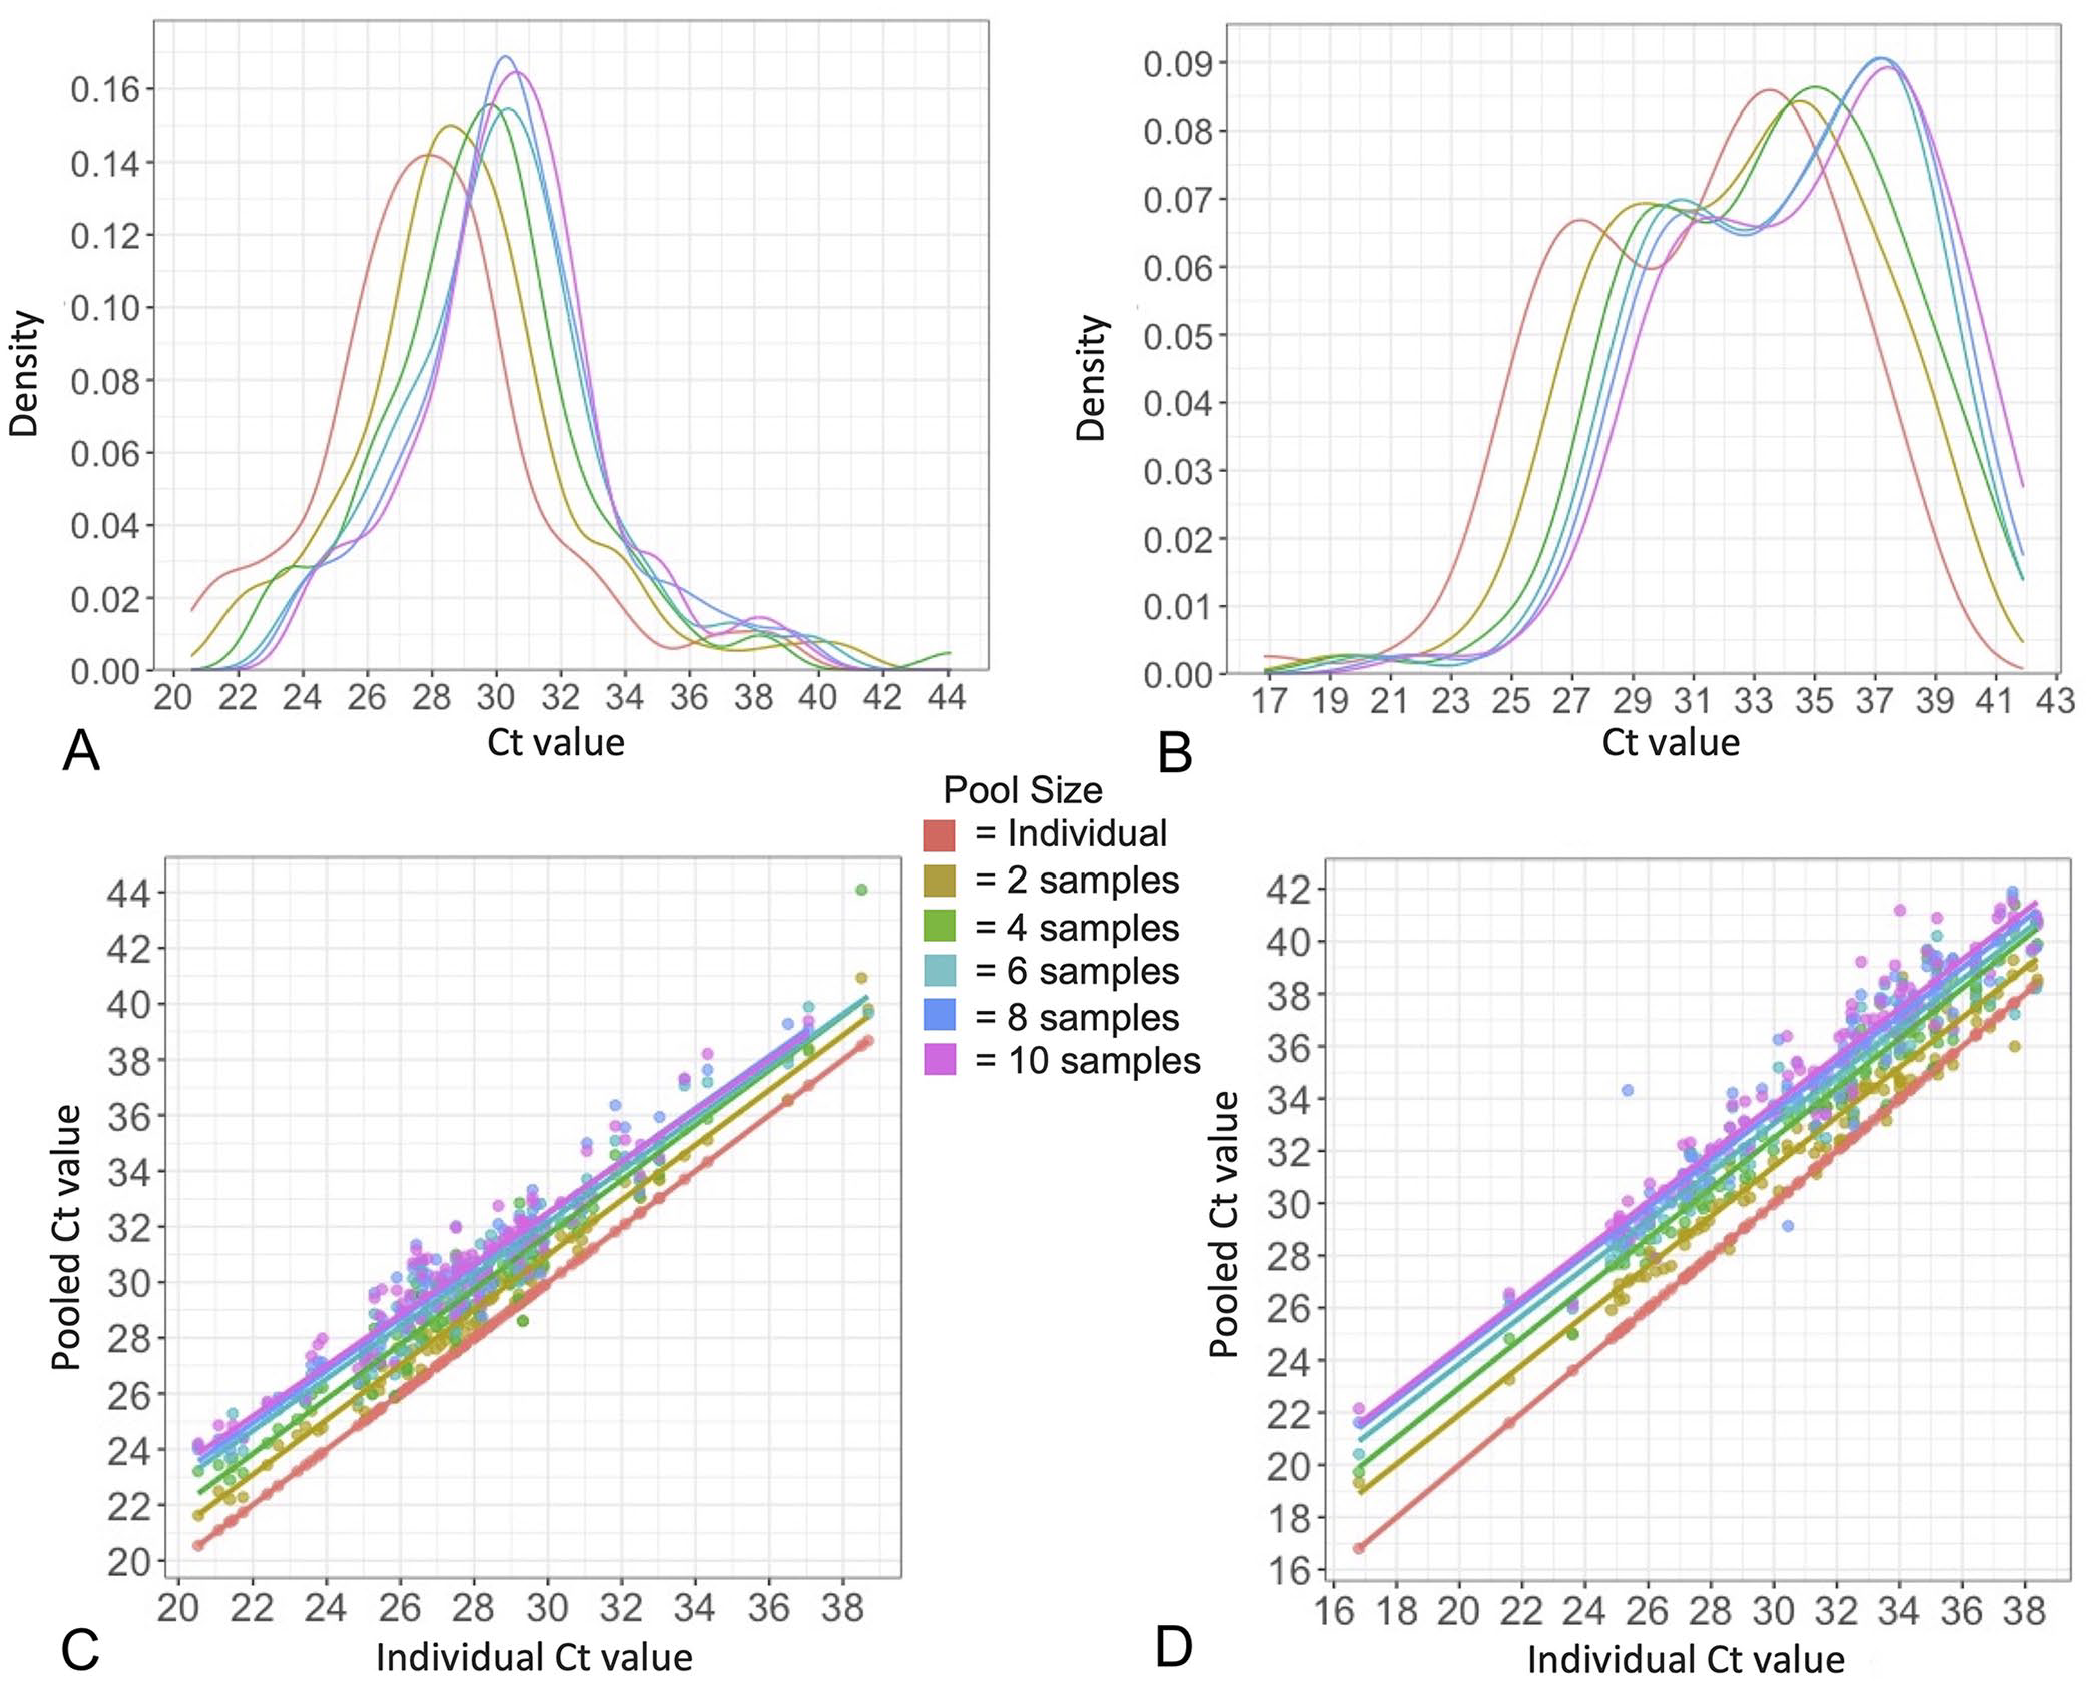
Distribution shift of Ct results and change in average Ct value with increasing pool size over pooling series. The distribution of Ct values for individual undiluted samples is in red with each pool size (color indicated in legend) overlapped to show Ct distribution shift with increasing pool size for
Increase in Ct values
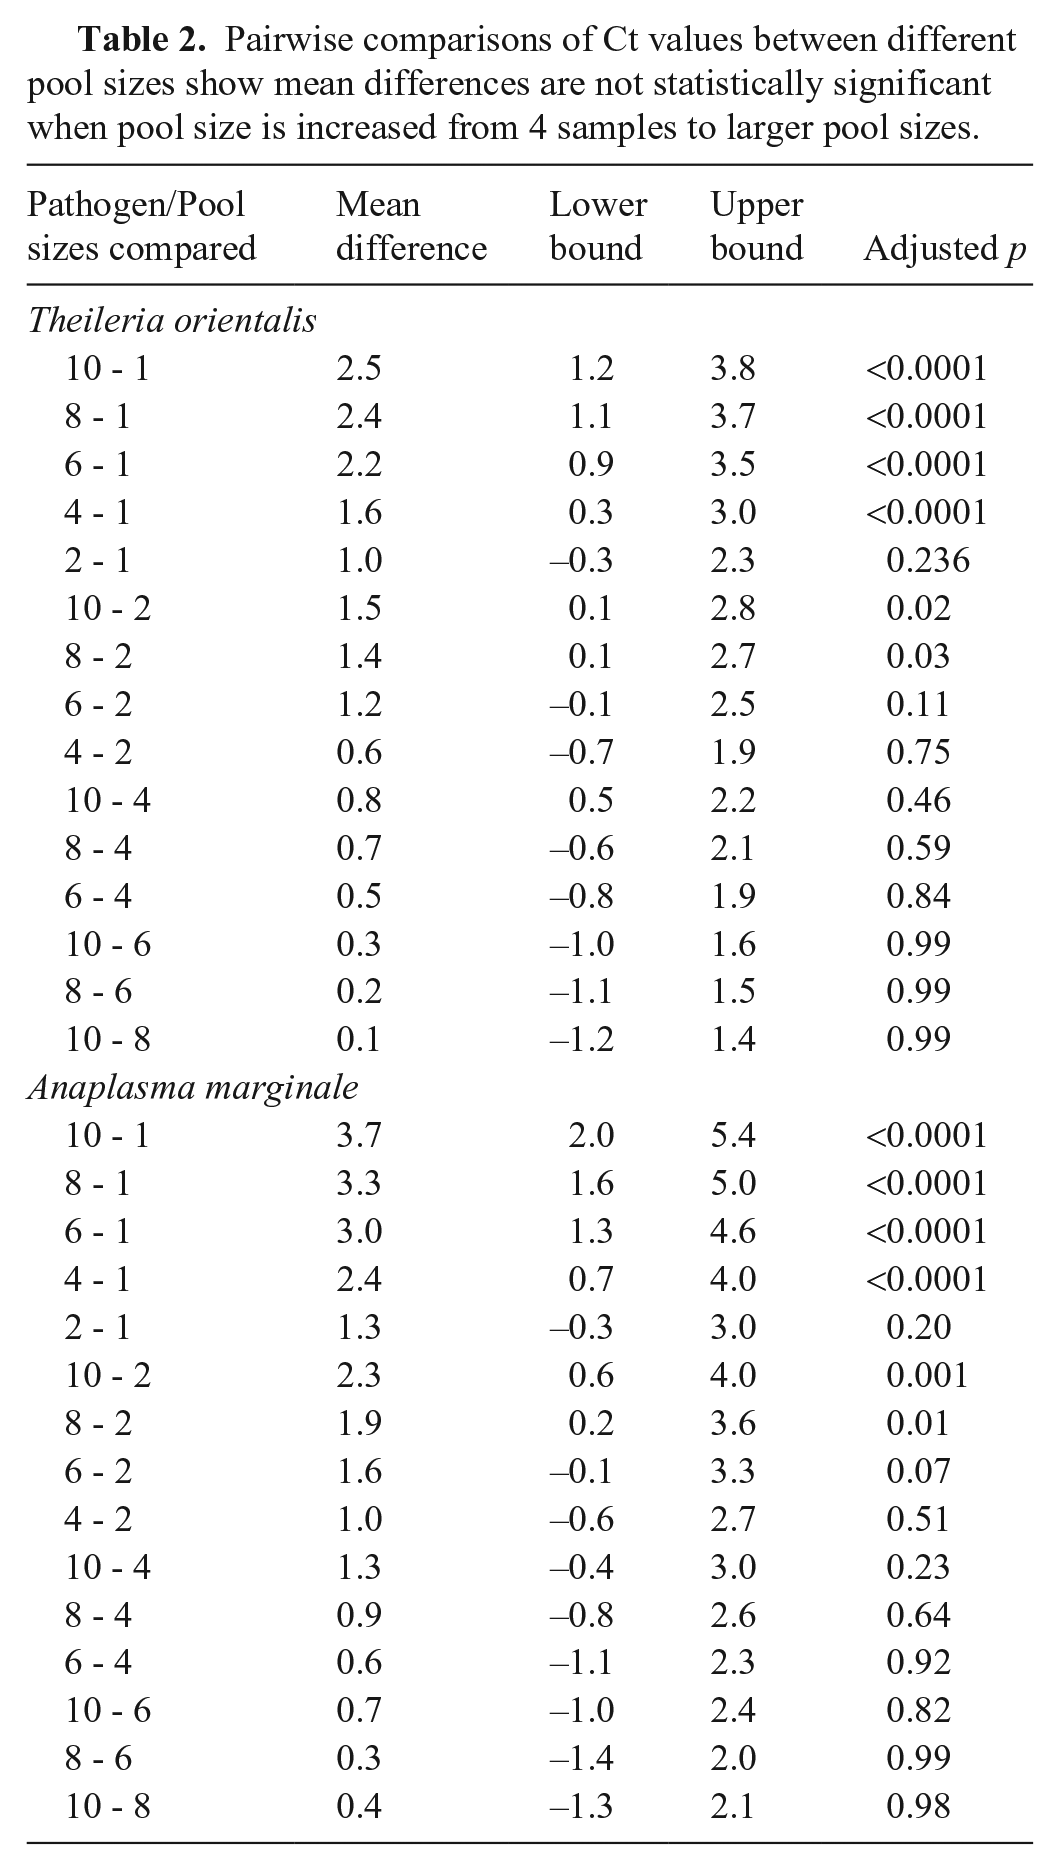
In generating all pooling series, unpooled starting Ct values >2 above or below the original test results were observed in 27 series and 3 series, respectively. These series were excluded from further dilution analysis and repeated using other samples with comparable original testing Ct to maintain the 100 T. orientalis and 100 A. marginale result distributions. Overall, there was a significant effect of pool size on Ct value with each increase in pool size, resulting in the Ct value distributions shifting to the right towards higher values (Fig. 3A, 3B, p ≤ 0.0001 for both; Table 1). Change in Ct value of each positive sample from individual sample to each increasing pool size is shown for T. orientalis (Fig. 3C; Table 2) and A. marginale (Fig. 3D; Table 2). Observed Ct increase at the largest pool size (10) was found to be significantly lower (p ≤ 0.0001) than expected for both T. orientalis and A. marginale (Fig. 4A, 4B), although differences between observed and expected Cts throughout the series varied between the 2 pathogens. There was no significant difference between observed and expected Ct increase in T. orientalis at 2-fold dilution, but Ct increase became significantly lower (p ≤ 0.001) than expected beginning at 4-fold dilution and was maintained from 6- to 10-fold dilution (p ≤ 0.0001; Fig. 4A). Observed Ct increase was significantly higher (p ≤ 0.0001) than expected for A. marginale in the 2- and 4-fold dilutions, with no statistically significant difference in the 6-fold dilution, and significantly lower (p ≤ 0.0001) than expected in the 8- and 10-fold dilutions (Fig. 4B).
Increase in average Ct value and observed sensitivity show minimal sensitivity loss with increasing pool size.

Pairwise comparisons of Ct values between different pool sizes show mean differences are not statistically significant when pool size is increased from 4 samples to larger pool sizes.
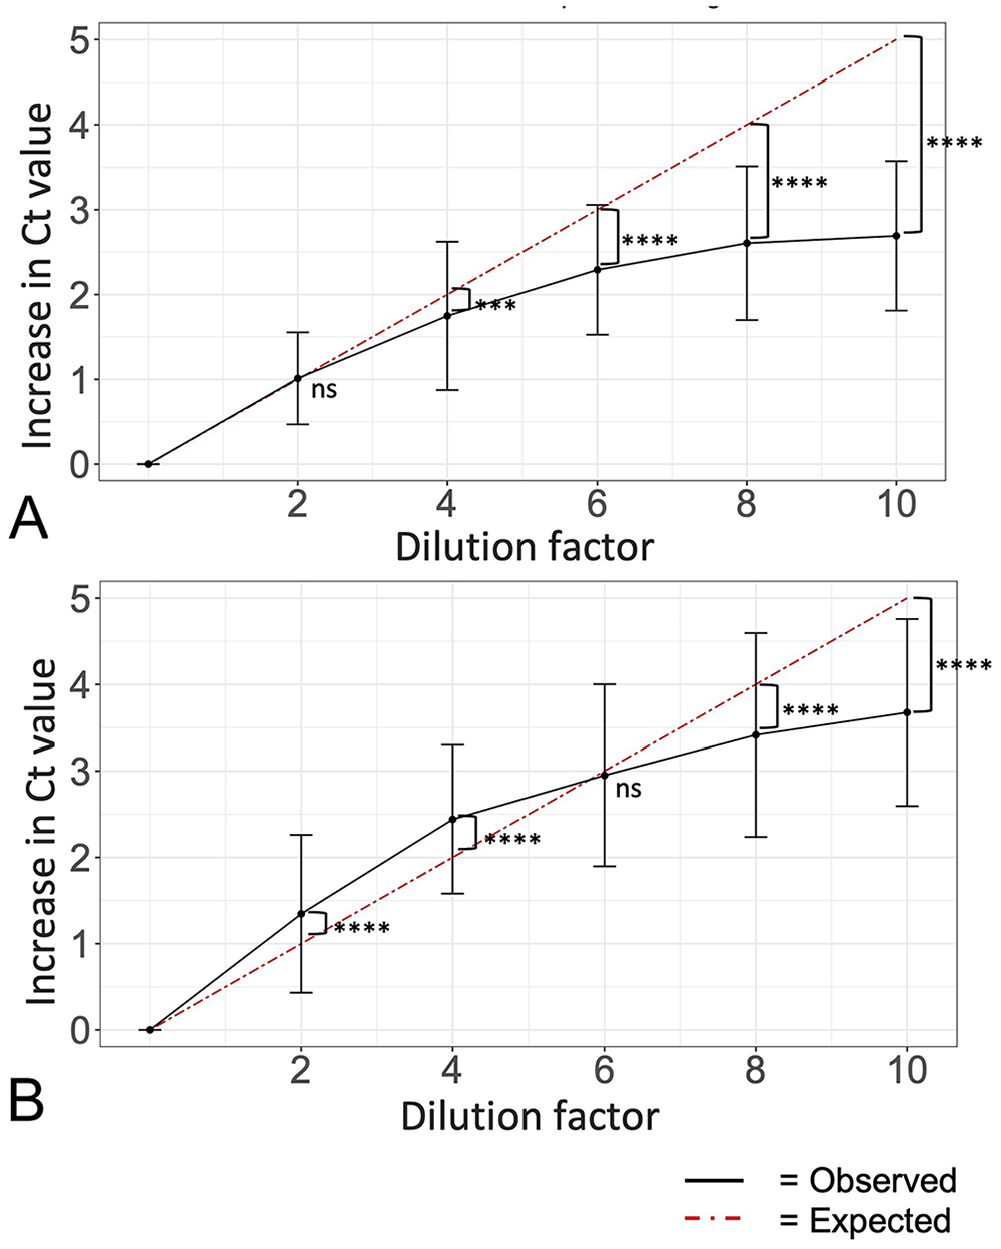
Average observed Ct increase was lower than expected when pooling up to 10 samples. Average Ct increase (± SD) for each pool size (n = 100) from undiluted Ct over increasing dilution factor for
Sensitivity loss
Of the 100 T. orientalis and A. marginale samples that we used for pooling series, only 4 samples (2 T. orientalis, 2 A. marginale) became undetectable (false-negative [FN]; Table 3). All 4 samples had original Ct values at the upper limit of detection and are rarely seen in surveillance testing (37.5–39.5; Table 3). We observed 100% sensitivity for both T. orientalis and A. marginale in the individual re-testing and 2-sample pool (Table 1). Sensitivity loss was first observed in 4-sample pools when the pools for positive sample FN1 and FN2 became undetectable for T. orientalis and A. marginale, respectively, resulting in a 1% sensitivity loss. Both FN1 and FN2 regained detection in the 6-sample pool, but the 1% sensitivity loss was maintained for T. orientalis through the detection loss of FN3. FN1 and FN3 both remained undetected in the 8- and 10-sample pools, resulting in a 2% sensitivity loss for T. orientalis; FN2 and FN4 were undetectable in only the 8-sample pool, resulting in a 2% sensitivity loss for A. marginale in 8-sample pools, but 100% sensitivity was regained in the 10-sample pools (Table 3).
Average Ct results of all Theileria orientalis and Anaplasma marginale false-negative (FN) samples over the pooling series represent a low risk to biasing sample pooling due to the low frequency of equal or greater Ct values among historical positive samples.
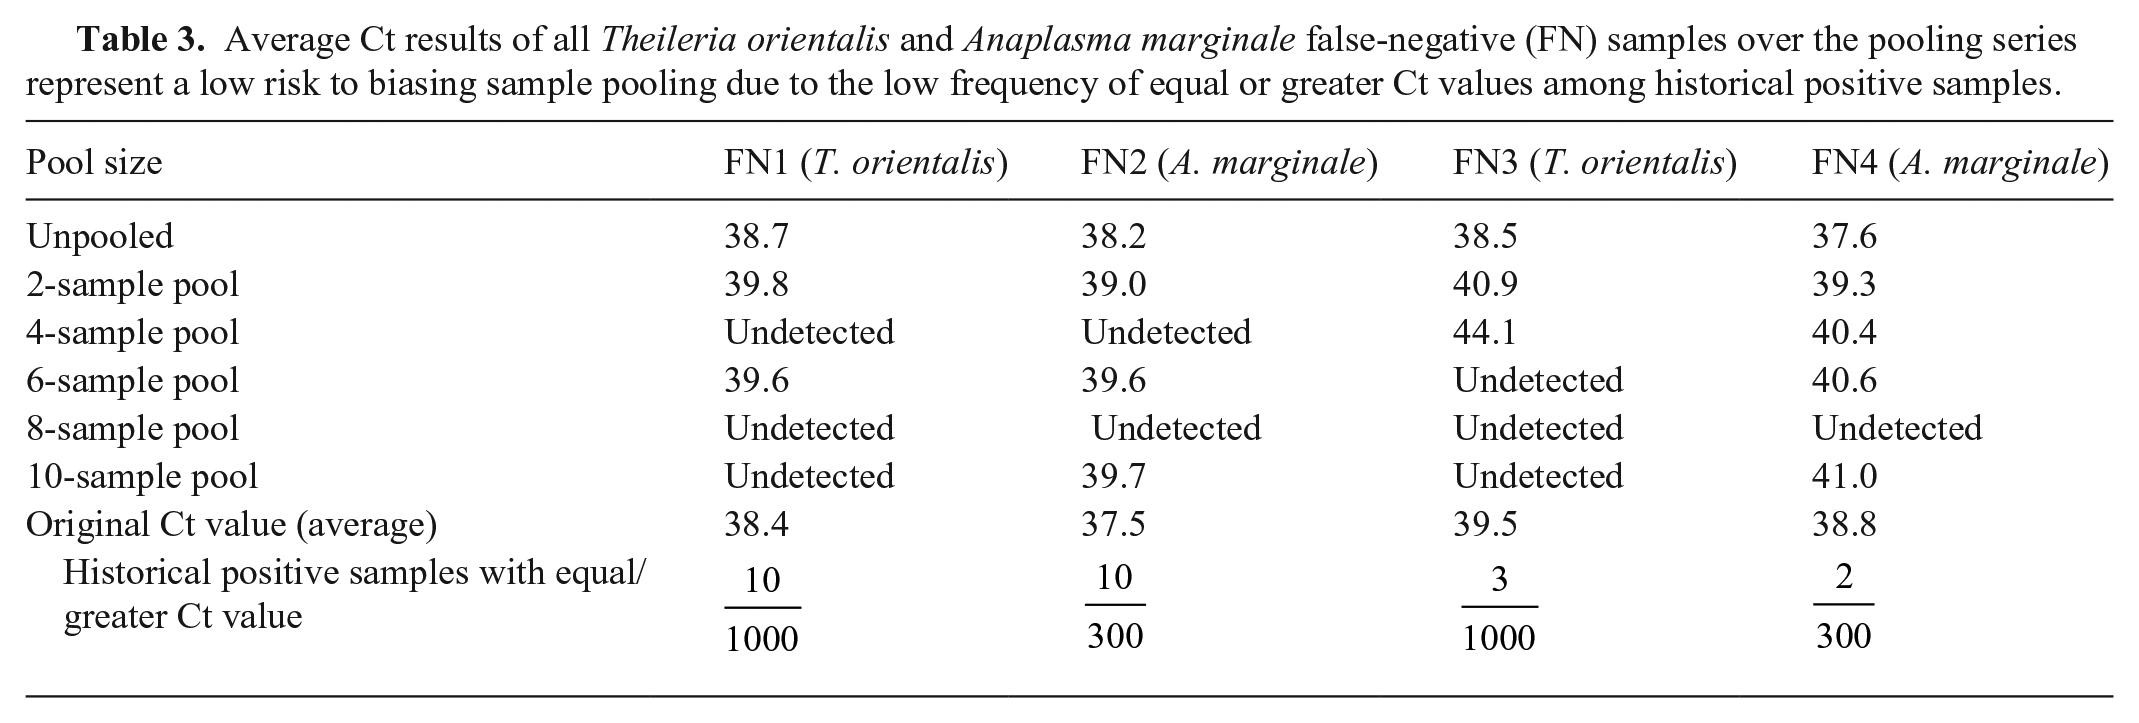
Although amplification is possible in up to 45 cycles, it is rarely seen beyond 42 cycles. Using an expected cutoff of 42 cycles for a pool to register a Ct value, and the expected 1 Ct increase per 2-fold dilution, we expected to see a 1% sensitivity loss beginning with the 6-sample pool, and a 2% sensitivity loss with the 8- and 10-sample pools for T. orientalis, and a 1% sensitivity loss beginning at the 8-sample pool, increasing to 9% in the 10-sample pool for A. marginale. Both pathogens had 1% sensitivity loss earlier than expected, beginning at the 4-sample pools, but maintained sensitivity as well as (T. orientalis), or better (A. marginale), than expected during the remainder of the pooling series. All 4 samples that became undetectable in this experiment had historical Ct values of 38.4 and 39.5 for T. orientalis, and 37.5 and 38.8 for A. marginale, with equal or greater Ct values, and similar risk of detection loss, seen in surveillance testing up to 1% and 3% of the time, respectively (Table 3).
Discussion
Given the low DSe lost, pooling up to 10 samples did not indicate an unacceptable loss in sensitivity for our surveillance program for both pathogens. The cycle cutoff for a positive pool was extended from individual testing parameters to 45 cycles for 1 replicate, which likely contributed to pools maintaining high sensitivity. Sensitivity loss did not exceed 2%, and only samples with the highest Ct values historically observed in surveillance were lost. Under our study conditions, this sensitivity loss was observed when one sample positive for one pathogen was included in a pool of negative samples. When pooling unknown samples for surveillance testing, multiple samples could be positive for either or both pathogens in the same pool, increasing the likelihood of high Ct positives being detected upon individual re-testing, which would help retain pooling sensitivity. Although this condition is dependent on prevalence patterns of the target pathogen(s), it is especially likely given that prevalence for T. orientalis within a herd is high in areas endemic for its tick vector, 25 which is the case for much of the eastern United States, including our target surveillance region.
Lower-than-expected average Ct increases occurred for both T. orientalis and A. marginale over the entire pooling series. This is likely due to the dilution of an inhibiting factor, for example, non-target DNA that inhibits more efficient target DNA interaction with primers.14,17,24 Our results demonstrate the need to precisely determine how Ct values, and consequently sensitivity, will be affected by dilution when pooling samples.
Although the DNA in the samples that we used were relatively stable during storage, allowing sample DNA to be preserved, this use of historical samples to develop pooling protocols may not be easily adopted by surveillance programs in which the target material easily degrades (e.g., RNA). Additionally, any surveillance program adopting this approach to develop pooling protocols should carefully consider the specific characteristics of the target pathogen, assay, and risks and consequences of false-negative samples when determining if any sensitivity loss associated with a particular pool size is acceptable. Finally, to apply the resulting range of pool sizes from our approach, consideration must be made for how the optimal pool size for a given disease prevalence can be identified to achieve maximal testing economy through sample pooling.
Footnotes
Acknowledgements
We thank the laboratory technicians who contributed significantly to our surveillance testing program, including Amanda Carbonello and Alphonce Assenga. Samples were provided by the Virginia Department of Agriculture and Consumer Services staff, as well as faculty and students of the Production Management Medicine Services at Virginia Maryland College of Veterinary Medicine, notably, Drs. Sierra Guynn and John Currin. Early findings of our study were presented virtually at the 2022 AAVLD-USAHA Annual Meeting (Oct 6–12; Minneapolis, MN).
Data availability
The data presented in our study are available on request from the corresponding author. The data are not publicly available due to privacy concerns.
Declaration of conflicting interests
The authors declared no potential conflicts of interest with respect to the research, authorship, and/or publication of this article.
Funding
Our research was funded by USDA-APHIS “Theileria orientalis Ikeda Surveillance,” USDA-ARS “Development of control strategies for T. orientalis,” and USDA-NIFA Animal Health “Host-Pathogen-Environment Interactions: Impact on Animal Health and Disease in Virginia.”