
Abstract
We optimized and verified a single-spot solid-phase competitive ELISA (ss-SPCE) to detect antibodies against structural proteins of Southern African Territories (SAT) serotypes of foot-and-mouth disease virus (FMDV) in small ruminants. Sera from goats vaccinated and experimentally challenged with a SAT1 FMDV pool were tested in duplicate at 4 dilutions (1:10, 1:15, 1:22.5, 1:33.8) to optimize the assay. To assess the performance of the assay in naturally infected animals, we evaluated 316 goat and sheep field sera collected during active SAT2 outbreaks. Relative to results of the virus neutralization test, the optimal serum dilution and cutoff percentage inhibition (PI) were 1:15 and 50%, respectively. At these values, the Spearman rank correlation coefficient was 0.85 (p < 0.001), and the sensitivity and specificity (95% CI) were 80.3% (72.6, 87.2) and 91.1% (84.1, 95.9), respectively. Relative to the liquid-phase blocking ELISA and the nonstructural protein ELISA, the ss-SPCE exhibited divergent performance characteristics between the goat and sheep field sera. Repeatability was better for goats, but the correlation and agreement among all 3 assays were better for the sheep sera. The prevalence of SAT2 FMDV infection in the sampled sheep was 23.6%; sampled goats were seemingly FMDV-free. The ss-SPCE is an appropriate FMDV detection tool to investigate the role of small ruminants in the epidemiology of FMD in Africa.
Foot-and-mouth disease (FMD) is a highly contagious and economically important disease of cloven-hooved animals, including goats, sheep, cattle, pigs, and ~70 wildlife species. 15 FMD is caused by infection with the FMD virus (FMDV; Picornaviridae, Aphthovirus). The FMDV single-stranded, positive-sense RNA viral genome is encapsulated in an icosahedral viral particle. This infectious RNA encodes a single polyprotein that is translated into mature structural and nonstructural proteins. 11 FMDV is classified into 7 serologically distinct serotypes, namely Southern African Territories 1, 2, and 3 (SAT1–3), A, O, C, and Asia1. 11 Serotype C was last reported in 2004.28,31,32 The SAT serotypes are mainly restricted to sub-Saharan Africa, although incursions into the Middle East, North Africa, and Greece have been reported.1,19
The most common clinical signs of FMD are pyrexia, lameness, drooling, and vesiculation.7,16,17,38 The disease can be less apparent in small ruminants than in cattle and pigs, often causing mild or subclinical infection. 14 The extent of clinical disease in goats and sheep is dependent on virus strain and breed of the small ruminant. 18 Upon experimental intra-dermolingual infection of indigenous South African goats with a pool of SAT1 viruses, secondary lesions, fever, drooling, and virus shedding were recorded. 20 Intra-dermolingual inoculation of Indian goat and sheep breeds with a serotype O virus caused subclinical infection, although infectious virus could be isolated from the blood for up to 10 d post-challenge. 25 Goats and sheep that had been inoculated via the coronary band route within the same study developed fever, lameness, inappetence, and vesiculation.
Goats and sheep have been implicated in the transmission of FMDV,14,18 which is likely to occur during acute infection even in the absence of clinical signs. 2 Although it has not been proven unequivocally, the strong correlation between seropositive small ruminants and cattle in the same location might indicate cross-species transmission. 23 Goat and sheep serum samples have been seropositive following outbreaks in which communal farming of cattle and small ruminants is practiced,2,34 even in the absence of clinical signs of infection. 3 With evidence of small ruminants as possible sources of FMDV infection, there is a need to include these species in surveillance activities for effective FMD control.
Laboratory diagnosis of FMD involves the detection and identification of viral agents or antibodies against FMDV. 35 Viral agents are detected by virus isolation, antigen ELISA, complement fixation, and molecular tests. Serologic assays are employed to detect antibodies against either the structural or nonstructural proteins of FMDV. These assays include the nonstructural protein ELISA (NSPE), virus neutralization test (VNT), liquid-phase blocking ELISA (LPBE), and solid-phase competitive ELISA (SPCE). 35 The NSPE is a serotype-independent assay that can differentiate animals exposed to viral infection from those vaccinated with a purified FMDV vaccine. 34 For the detection and quantification of structural antibodies against FMDV, the World Organisation for Animal Health (WOAH) recommends the VNT as the gold standard method because of its superior test characteristics. 10 However, the VNT is inappropriate for routine use because it is laborious, requires the use of high-containment facilities, and results are highly variable. 35 An alternative serologic test is the LPBE,8,13 which has less variability, is quicker, more sensitive, and has better reproducibility than the VNT; LPBE results are correlated positively with VNT findings.12,13 However, a disadvantage is that the LPBE has low diagnostic specificity (DSp). 6 The SPCE was developed to retain the diagnostic sensitivity (DSe) of the LPBE while improving its robustness and DSp.21,22,33 Our aim was the optimization and verification of an established single-spot solid-phase competitive ELISA (ss-SPCE) to detect antibodies against SAT serotypes of FMDV in goats and sheep in South Africa.
Materials and methods
Study design
Serum samples obtained from goats experimentally infected with FMDV SAT1 and subsequently vaccinated with a pentavalent FMDV vaccine containing SAT1–3 viruses were used to optimize a ss-SPCE. The sera were tested in duplicate at 4 dilutions, and the data obtained were used to establish an optimal working dilution and the cutoff percentage inhibition (PI) value of the optimized assay. Serum samples of goat and sheep origin collected during SAT2 outbreaks were used for field evaluation of the assay. Laboratory work was performed at the Agricultural Research Council–Onderstepoort Veterinary Research (ARC-OVR) Transboundary Animal Diseases Program (TADP) research facilities in South Africa. Ethical clearance for this study was obtained from the University of Pretoria (UP, REC095-19), and the Onderstepoort Veterinary Research facility (OVR, AEC.19.6). Permission was granted by the Department of Agriculture, Land Reform and Rural Development under Section 20 of the Animal Diseases Act (1984) of the Republic of South Africa (clearance 12/11:1:1).
Study samples
Experimental serum samples
In a previous experimental study, 40 goats were obtained from the FMD-free zone of South Africa and screened for FMDV exposure using LPBE prior to vaccination on day 0 using a pentavalent vaccine containing SAT1 (SAR/09/81/1, BOT/01/106/1), SAT2 (KNP/01/10/2, SAR/03/04/2), and SAT3 (KNP/10/90/3) FMDV strains, and revaccinated on day 20. 20 Forty-one days after initial vaccination, goats were challenged with a pool of SAT1 viruses either by intra-dermolingual inoculation or by natural in-contact transmission. We used the 227 sera collected at day 0, 14 d post-vaccination (dpv), 20 dpv, 34 dpv, 41 dpv (day of SAT1 challenge), and 55 dpv (14 d post-challenge) to optimize the ss-SPCE.
Field serum samples
During surveillance exercises in 2019 in the Limpopo Province of South Africa, 199 small ruminant sera (172 goats, 27 sheep) were collected. Fifty goats and sheep were targeted from each of 4 SAT2 serotype–affected villages using convenience sampling of flocks in close proximity to confirmed-positive cattle herds. In September 2020, 120 small ruminants (15 goats, 105 sheep) were sampled from 4 flocks in Limpopo. Using convenience sampling, the small ruminants were selected from farms in which cattle had tested positive for FMDV during the outbreak. In both years, sampling occurred during active SAT2 outbreaks, and no FMDV vaccination of small ruminants had ever been performed in the study areas.
Serologic testing
The SAT1 ss-SPCE was optimized by testing 227 experimental goat serum samples at 4 serum dilutions (1:10, 1:15, 1:22.5, 1:33.8) and the results compared to the gold standard SAT1 VNT. The SAT2 ss-SPCE assay was evaluated using 319 goat and sheep field serum samples collected during a SAT2 outbreak. Comparative analysis of the SAT2 ss-SPCE results was performed with SAT2 LPBE and NSPE.
Single-spot solid-phase competitive ELISA
The FMDV ss-SPCE procedure was performed as described previously 25 and had been fully validated in cattle sera in the ARC-OVR TADP research facility. Microtiter plates (NUNC MaxiSorp; MilliporeSigma) were coated overnight with a pre-determined dilution of SAT1 capture antibody in carbonate buffer. The following day, the pre-coated plates were washed 3 times with PBS (pH 7.4), containing 0.5% Tween 20 (PBST), then stored at −20°C until use. On the day of the test, SAT1-specific antigen was diluted to the appropriate concentration before adding to the defrosted, pre-coated plates and incubated for 1 h at 37°C. The plates were washed as before and blotted dry on absorbent paper. To optimize the assay, 1.5-fold serial dilutions of the 227 experimental goat serum samples were performed in duplicate to produce serum dilutions of 1:10–1:33.8. To evaluate field serum samples, SAT2 reagents were used, and samples were also tested in duplicate at the optimal working dilution. Negative and strong-positive sera were added at 1:10 dilutions to the sample buffer in duplicate and titrated 2-fold to 1:80. The antigen (non-inhibition) control contained only the sample buffer (ODmax). Detecting antibody, homologous to the capture antibody, was diluted to a predetermined dilution and immediately mixed with the samples and controls. After 1 h of incubation at 37°C and subsequent washing, horseradish peroxidase (HRP), conjugated to goat anti–guinea pig immunoglobulins, was added followed by another 1-h incubation and wash step. Lastly, the plates were incubated with tetramethylbenzidine (TMB) substrate at room temperature. After 10 min of color development, the reaction was stopped with 2 M sulfuric acid. The OD of each well was read at a wavelength of 450 nm (Multiskan spectrophotometer plate reader; Thermo Fisher). Using the measured ODs, the PI for each well was expressed as 100 − [OD test or control/median OD max] × 100%. Positive results were classified as PI ≥ 50%, and samples were classified as negative when the PI was <50%, as established previously by the laboratory protocol. The acceptance criteria of the assay were: OD of the antigen control in the range 0.8–1.4, strong-positive control serum titer of ≥2 log10, and negative control serum titer of <1.6 log10. The log antibody titer of the positive and negative control sera was calculated using the Spearman–Kärber formula:

PI i refers to the PI calculated for every dilution of the control; a refers to the serial dilution factor used; and b represents the inverse of the starting final serum dilution.
Liquid-phase blocking ELISA
The LPBE had been established previously in the ARC-OVR TADP research facility, and the standard operating protocol followed a published procedure. 12 Briefly, in a U-bottomed microtiter plate, 2-fold titrations of serum samples were performed from 1:10 to 1:80. FMDV SAT2 antigen homologous to the capture antibody was diluted to a pre-determined concentration and mixed with the sera, producing final dilutions of 1:20–1:160. The plate was incubated at 37°C for 1 h. The serum-antigen mixture was transferred to corresponding wells of microtiter plates pre-coated with SAT2 capture antibody and incubated again. After washing the plates 3 times with PBST as described for the SPCE above, SAT2 detecting antibody homologous to the capture antibody was diluted and added to the plates. The incubation and wash steps were repeated, after which HRP conjugated to goat anti–guinea pig immunoglobulins was added, followed by a final 1-h incubation and wash step. Last, the plates were incubated for 10 min with TMB substrate. The reactions were stopped with 2 M sulfuric acid, and the OD of each well was read at 450 nm on a plate reader (Multiskan spectrophotometer). The log serum titers for the samples and controls were calculated using the Spearman–Kärber formula as described previously. Positive results were classified as log serum titer ≥1.6 and negative when the log titer was <1.6. 35 The acceptance criteria of the assay were: OD of the antigen control in the range 0.8–1.4, strong-positive control log serum titer of ≥2.0, and negative control log serum titer of <1.6.
Virus neutralization test
The VNT was carried out following an established method.10,35 Test sera were titrated 2-fold across tissue-grade microtiter plates in duplicate. SAR/09/81 (SAT1) virus culture was titrated separately and then added onto the sera at a multiplicity of infection (MOI) of 2.3 before 1-h incubation at 37°C in a carbon dioxide incubator. Porcine kidney (IB-RS-2) cell suspensions were added to the serum-virus mixture and returned to the incubator for 72 h. The cells in the plates were fixed and stained with methylene stain to facilitate reading of the results. The final serum titers were expressed as the final dilution of antibodies present in the serum-virus mixture in which 50% of wells did not have a cytopathic effect (CPE). A serum titer ≤1:45 (1.65 log10) was considered negative; titers >1:45 were recorded as positive. 35
Nonstructural protein ELISA
Serum samples were tested in duplicate for the presence of antibodies against the FMDV nonstructural protein 3ABC (PrioCHECK FMDV NS antibody ELISA kit; Prionics), per the manufacturer’s instructions. Briefly, serum samples were added to coated ELISA plates in duplicate and incubated overnight at room temperature. The plates were washed 6 times with washing fluid, and HRP conjugate was added. Following 1-h incubation at room temperature, the plates were washed as before and incubated for 20 min with chromogen substrate. The reaction was stopped with stop solution. The OD of the plate was read at 450 nm, and the raw ODs were used to calculate the PI as described previously. Samples with PI < 50 were categorized as negative and PI ≥ 50 as positive, per the manufacturer’s recommendations.
Data analysis
Optimal serum dilution determination
Experimental goat serum samples (n = 227) were used to optimize the SAT1-specific ss-SPCE assay. The average PI was calculated from the duplicates of each sample at the 4 dilutions (1:10, 1:15, 1:22.5, 1:33.8) and compared to the VNT serum titers as the reference standard. The ss-SPCE intra-assay repeatability was evaluated by calculating the CV for within-plate duplicates. The CV was calculated as the ratio of the SD to the x– of the replicates and expressed as a percentage. Spearman rank correlation coefficient (rho [ρ]) was calculated to measure the correlation between SPCE and VNT. Potential cutoff values were evaluated for each dilution using receiver-operating characteristics (ROC) analysis. Specificity and sensitivity of the ss-SPCE were calculated relative to VNT results as the reference standard. The Youden index (sensitivity + specificity – 1 = J) was calculated for each possible cutoff value, and the maximum J was selected as the optimal cutoff value for the respective dilution. The measurement of agreement between the VNT and ss-SPCE at the chosen cutoff was evaluated using the kappa coefficient. Where applicable, 95% CIs were calculated. Data analysis was performed using SPSS Statistics v.28 (IBM) and R (https://www.R-project.org/).
Field evaluation of the optimized assay
Upon establishment of the optimal working dilution and the cutoff PI value, the optimized ss-SPCE was evaluated on field samples on 3 testing days. Because the surveillance samples were collected during a SAT2 outbreak, they were tested on ss-SPCE using SAT2 reagents. Of the 319 field sera tested, 3 had insufficient volume to perform all of the replicates and thus 316 serum samples (184 goats, 132 sheep) were examined by SAT2 ss-SPCE, NSPE, and SAT2 LPBE. Bivariate correlations of the 3 tests were determined using the Spearman rank correlation coefficient. The measure of agreement between the SAT2 ss-SPCE and the other tests was evaluated using the kappa coefficient. The ss-SPCE repeatability was evaluated by assessing the CV of the intra-assay (within-plate) and inter-assay (among days) variations for each sample. Inter-assay variation was determined by assessing the sample replicates across different assay runs. Data analysis was stratified by species (goat, sheep). The apparent prevalence for each species was calculated using the formula:

True prevalence was estimated using the following formula 30 :

The 95% CI for the true prevalence was calculated as described previously 29 :

in which, p refers to the apparent prevalence; q is 1 − p; n is total number of samples; and J is the Youden index.
Results
Optimization of ss-SPCE working serum dilution
The ss-SPCE within-plate repeatability had median CV < 6% and <8% for the OD and PI duplicates, respectively (Fig. 1). The median CVs (IQR) for the ODs were 5.1% (2.3, 9.8%), 3.8% (1.28, 7.2%), 4.2% (2.1, 8.3%), and 4.8% (2.0, 8.7%) for 1:10, 1:15, 1:22.5, and 1:33.8 dilutions, respectively. The median CVs (IQR) for the PI duplicates were 3.0% (1.0, 13.3%), 3.0% (1.0, 10.0%), 5.0% (2.0, 14.3%), and 7.0% (2.0, 18.0%) for 1:10, 1:15, 1:22.5, and 1:33.8 dilutions, respectively. The scatterplots between ss-SPCE PI and VNT log10 titers indicated that the relationship between the 2 variables increased monotonically (Fig. 2). The Spearman rank correlation coefficient was 0.85 (p < 0.001) at 1:10 dilution, 0.85 (p < 0.001) at the 1:15 dilution, 0.85 (p < 0.001) at the 1:22 dilution, and 0.83 (p < 0.001) at the 1:33 dilution. The area under the ROC curves (Table 1) was 0.90–0.94 across all 4 dilutions. The highest J value (Table 1; Fig. 3) occurred at the 1:15 dilution (73.9) with an optimal cutoff PI value of 47%. This was followed by a Youden index of 72.5 for the 1:10 dilution with a 58.6% cutoff point. At the optimal cutoff PI for the 1:10 dilution, the kappa coefficient between ss-SPCE and VNT log titers was 0.69 (95% CI: 0.58, 0.78) and 0.72 (95% CI: 0.63, 0.81) for the 1:15 dilution at the 47% cutoff. The 1:15 dilution at a rounded 50% PI cutoff value was selected because of the maximum Youden index and similarity to the typical cutoff of the assay. The sensitivity and specificity of the optimized assay at 1:15 dilution relative to the VNT were 80.3% (95% CI: 72.6, 87.2) and 91.1% (95% CI: 84.1, 95.9), respectively (Table 1).
Within-plate repeatability measured as CV for the raw optical density (OD) and the calculated percentage inhibition (PI) of duplicate foot-and-mouth disease virus (FMDV) Southern African Territories (SAT)1 single-spot solid-phase competitive ELISA (ss-SPCE) results for 4 serum dilutions of 227 sera sampled from 39 South African goats vaccinated and thereafter experimentally infected with a pool of SAT1 viruses.
The relationship between the mean percentage inhibition (PI) of the single-spot solid-phase competition ELISA (ss-SPCE) and the log10 titers of the virus neutralization test (VNT) at 4 serum dilutions when testing 227 sera sampled from 39 South African goats vaccinated and thereafter experimentally infected with a pool of foot-and-mouth disease virus (FMDV) Southern African Territories (SAT)1 viruses. Each panel represents the correlation of the 2 tests for the different ss-SPCE serum dilutions. The horizontal dotted line is the cutoff titer for the VNT (1.65 log10), and the vertical dotted line is the cutoff PI for the ss-SPCE (50%).
Optimization of the foot-and-mouth disease virus SAT1 single-spot solid-phase competitive ELISA at 4 serum dilutions of 227 sera sampled from 39 South African goats vaccinated and thereafter experimentally infected with a pool of SAT1 viruses.
AUC = area under the curve.
Two-graph receiver operating characteristic (ROC) curves of the Youden index for distinct serum dilutions of 227 sera sampled from 39 South African goats vaccinated and thereafter experimentally infected with a pool of foot-and-mouth disease virus (FMDV) Southern African Territories (SAT)1 viruses tested on SAT1 single-spot solid-phase competition ELISA (ss-SPCE).
Field evaluation
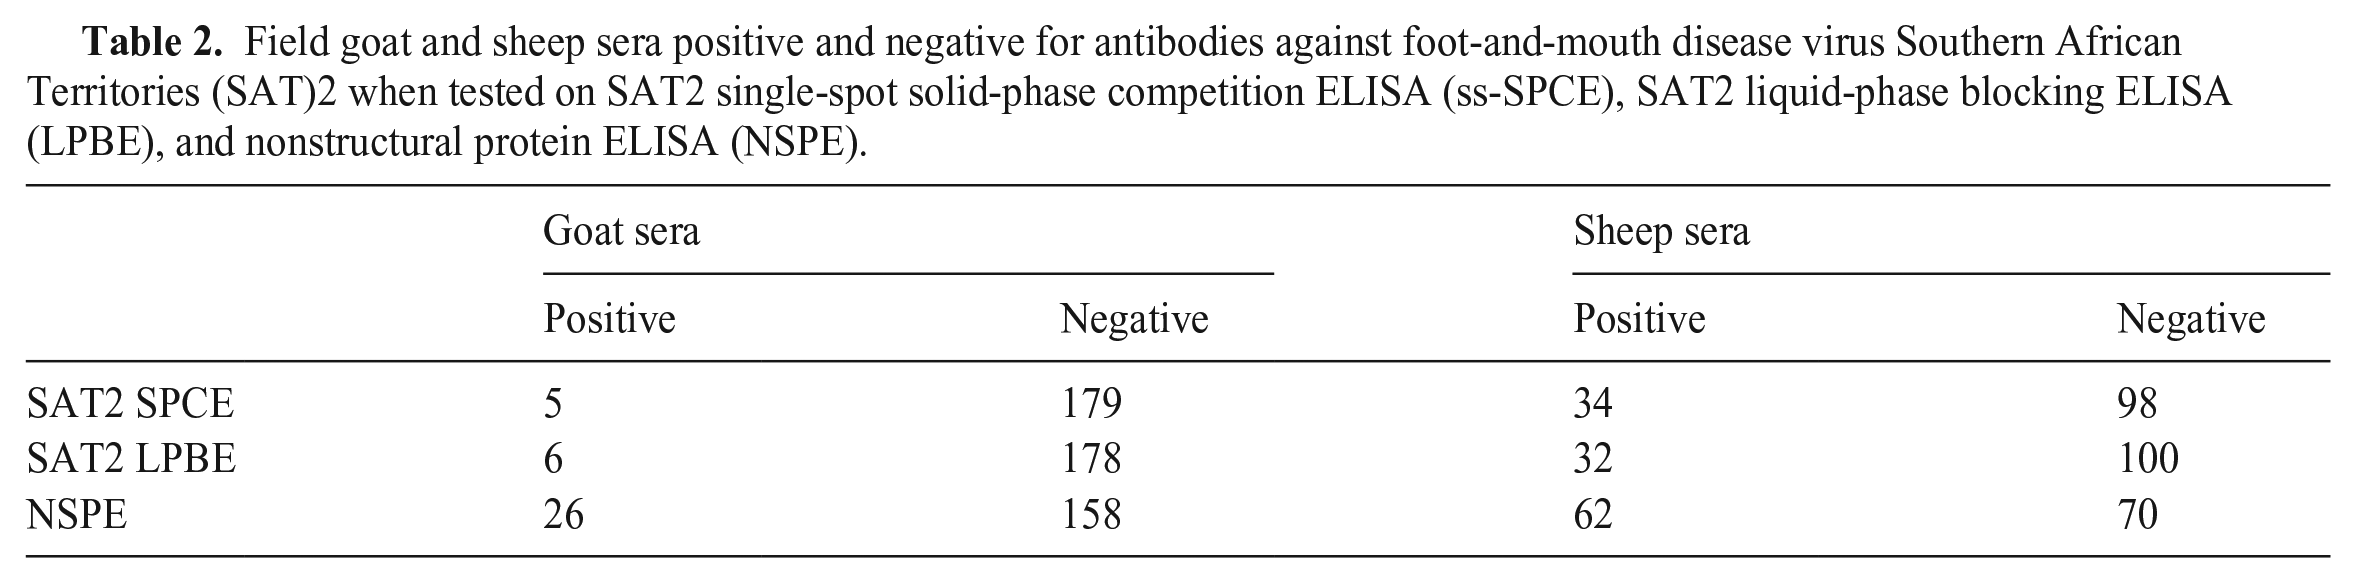
A SAT1 outbreak was not detected during our study period, and we therefore assumed that the serum dilution and cutoff value derived from the optimization of SAT1 ss-SPCE would be similarly appropriate for SAT2. The goat sera median (IQR) CVs of the intra-assay repeatability were 13.1% (9.2, 18.0%) for the OD and 75.7% (37.1, 193.1%) for the PI (Figs. 4, 5). This was in comparison to median CVs (IQR) of 30.9% (12.2, 44.9%) for the OD and 52.5% (25.8, 69.5%) for the PI of the sheep sera. The inter-assay variation for the goat sera had median CVs (IQR) of 9.3% (6.2, 12.5%) for the OD and 24.2% (4.3, 64.9%) for the PI. For the sheep sera, the median CVs (IQR) were 25.7% (9.3, 34.7%) for the OD and 24.1% (10.9, 43.9%) for the PI. For both species, the repeatability varied depending on the antibody response level (Fig. 6), and more goat specimens tended to be within the low end of the testing range. Serologically positive results on the ss-SPCE, LPBE, and NSPE were more common in field-tested sheep compared to goats (Table 2). Spearman rank correlation coefficients between ss-SPCE and LPBE for goat specimens were 0.19 (p = 0.010), and 0.26 (p < 0.001) between ss-SPCE and NSPE, respectively (Fig. 7). The kappa coefficients between ss-SPCE and LPBE at the established cutoffs in goat samples was 0.2 (95% CI: –0.2, 0.5), and 0.3 (95% CI: 0.1, 0.5) between ss-SPCE and NSPE, respectively. For the sheep samples, the correlation between ss-SPCE and LPBE was 0.74 (p < 0.001), and 0.75 (p < 0.001) between ss-SPCE and NSPE, respectively (Figs. 8, 9). The agreement between ss-SPCE and LPBE in sheep samples was 0.4 (95% CI: 0.3, 0.6), and 0.5 (95% CI: 0.4, 0.6) between ss-SPCE and NSPE, respectively. Of the 184 goat sera evaluated, 5 (2.7%, 95% CI: 0.9, 6.2%) tested positive on SAT2 ss-SPCE, 6 (3.3%, 95% CI: 1.2, 7.0%) on SAT2 LPBE, and 26 (14.1%, 95% CI: 9.4, 20.0%) on NSPE. In contrast, the apparent prevalence of SAT2 FMDV in the sampled sheep was 25.8% (95% CI: 18.5, 34.1%) by ss-SPCE, 24.2% (95% CI:17.2, 32.5%) for LPBE, and 47% (95% CI: 38.2, 55.9%) by NSPE. Using sensitivity and specificity of 80.3% and 91.1% respectively (optimization samples relative to VNT), the true prevalence of FMDV in sheep samples tested was 23.6% (95% CI: 13.8, 35.1%); the calculated value for goats was negative, suggesting no FMDV in the sample population.
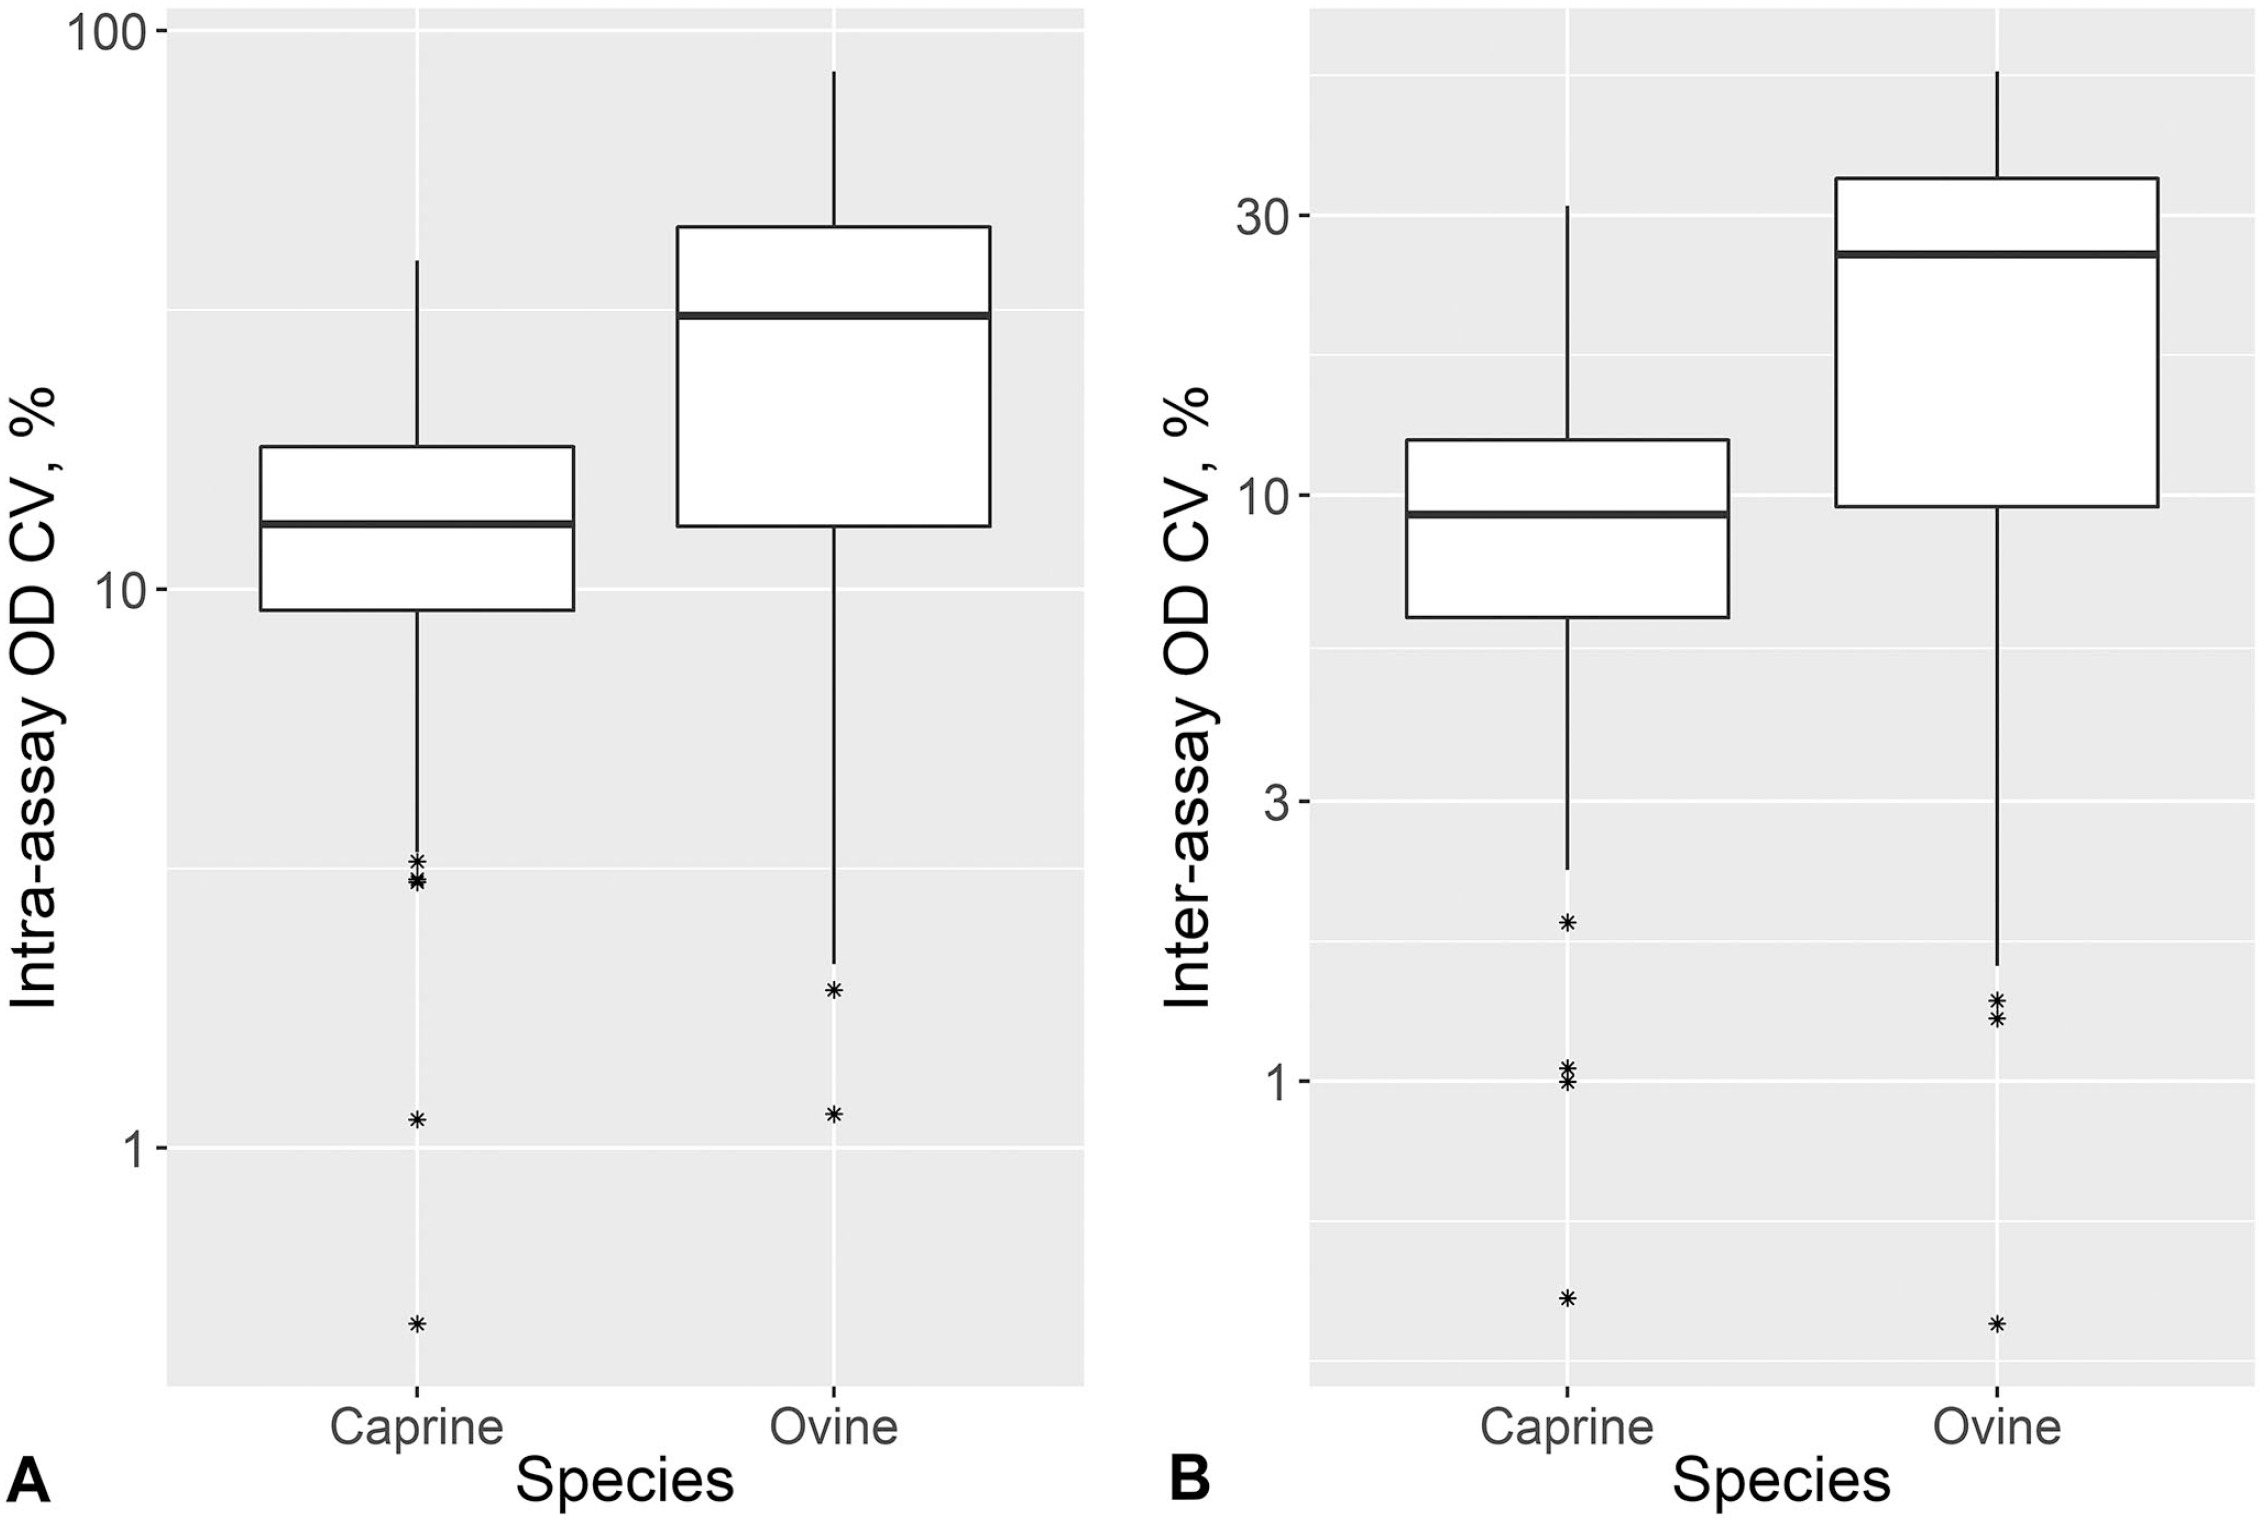
The CV for the raw optical density (OD) obtained from within and between runs of 184 goats and 132 sheep sera collected during active foot-and-mouth disease virus (FMDV) Southern African Territories (SAT)2 outbreaks in Limpopo, South Africa and tested on the SAT2 single-spot solid-phase competition ELISA (ss-SPCE).
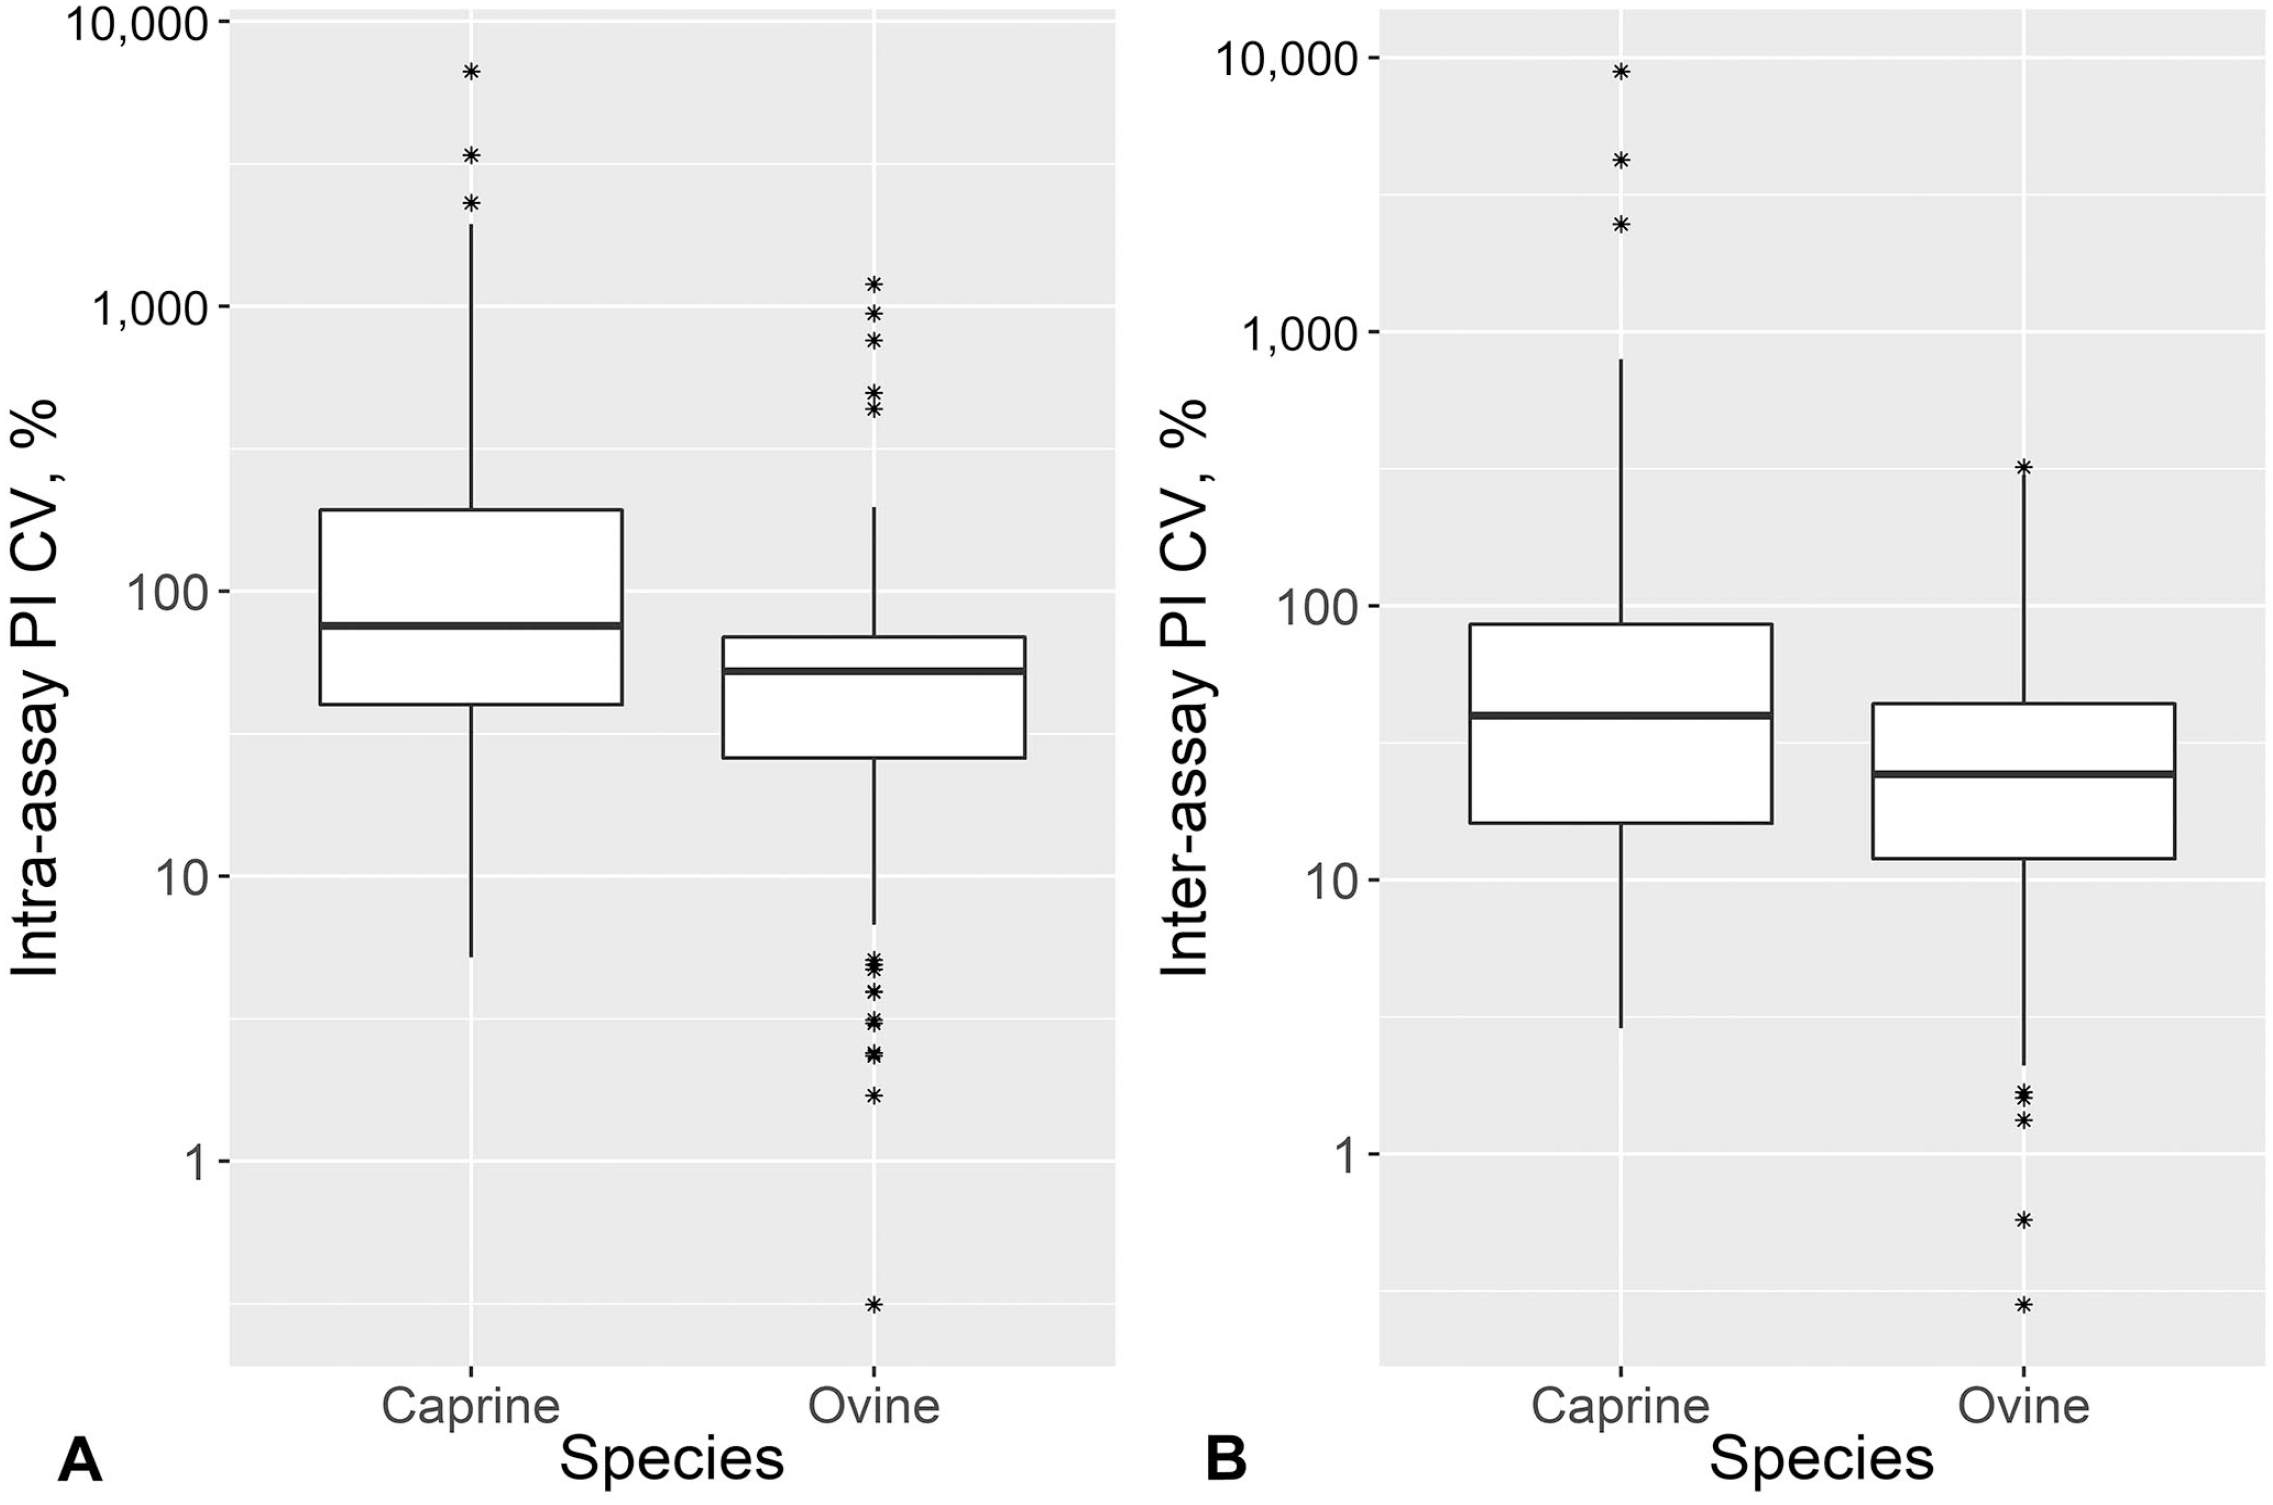
The coefficient of variation (CV) for the percentage inhibition (PI) obtained from within and between runs of 184 goats and 132 sheep sera collected during active foot-and-mouth disease virus (FMDV) Southern African Territories (SAT)2 outbreaks in Limpopo, South Africa and tested on the SAT2 single-spot solid-phase competition ELISA (ss-SPCE).
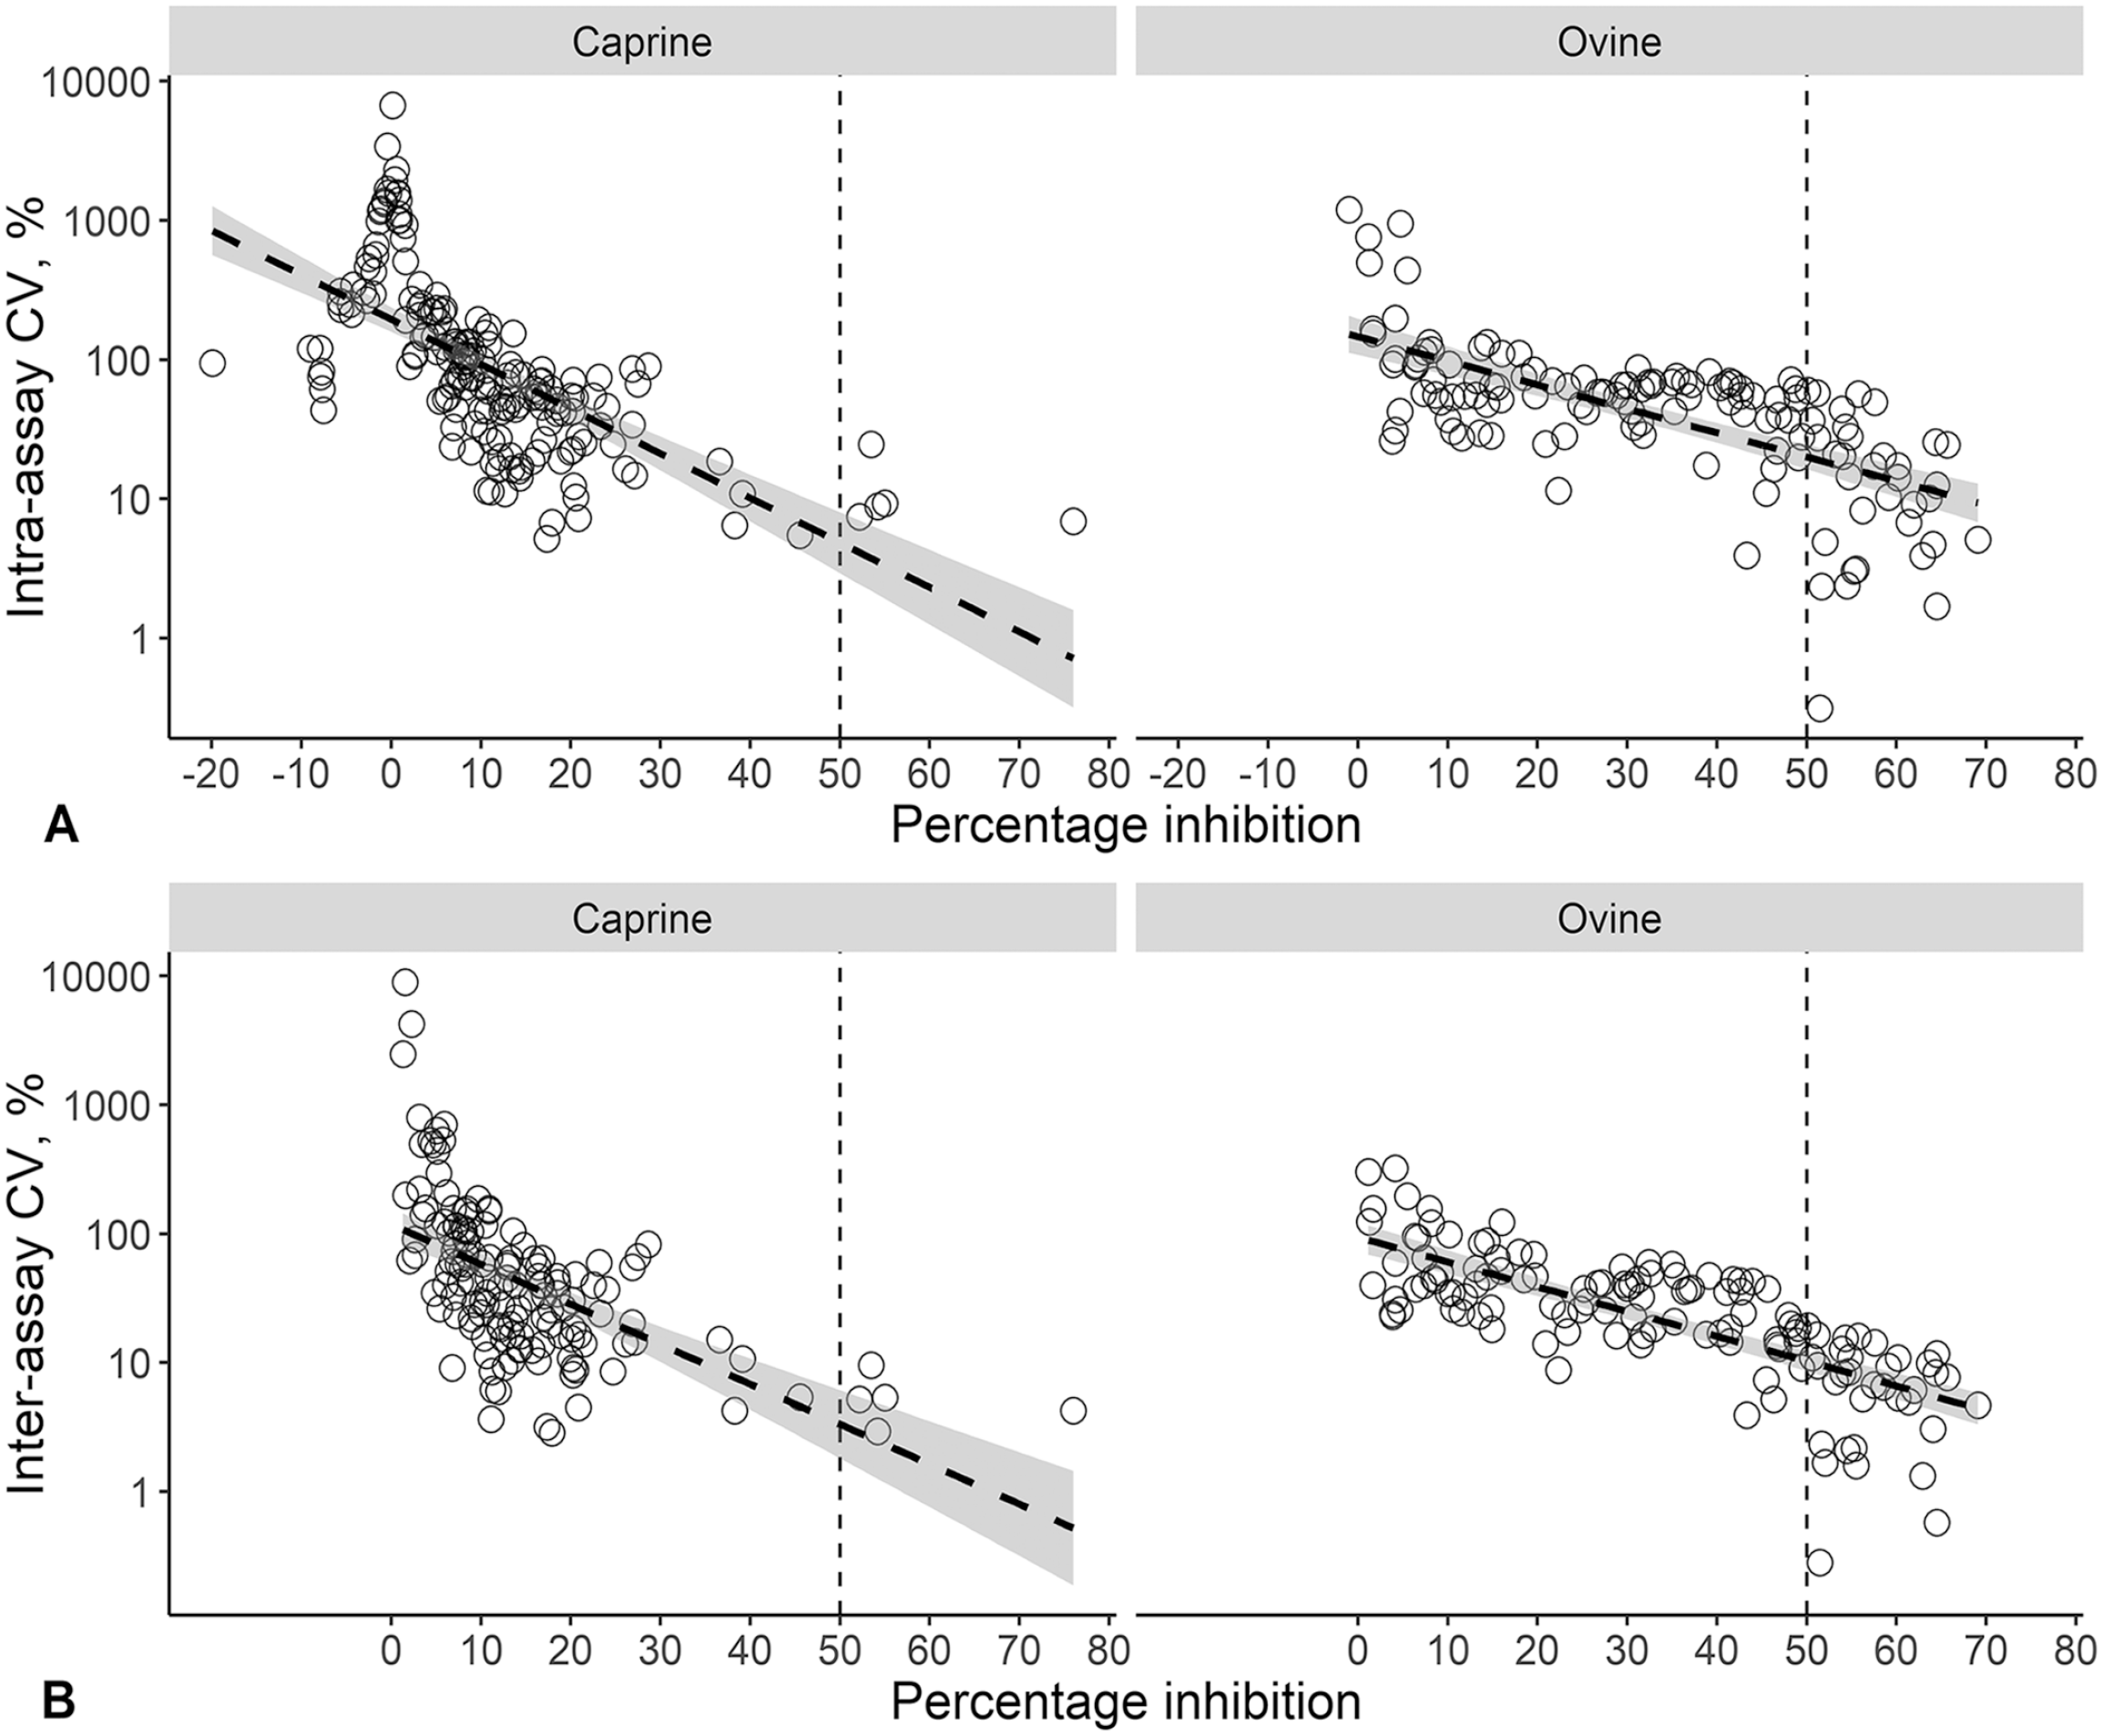
Scatterplots of the relationship between the CV and the calculated percentage inhibition (PI) of 184 goats and 132 sheep sera collected during active foot-and-mouth disease virus (FMDV) Southern African Territories (SAT)2 outbreaks in Limpopo, South Africa and tested on the SAT2 single-spot solid-phase competition ELISA (ss-SPCE).
Field goat and sheep sera positive and negative for antibodies against foot-and-mouth disease virus Southern African Territories (SAT)2 when tested on SAT2 single-spot solid-phase competition ELISA (ss-SPCE), SAT2 liquid-phase blocking ELISA (LPBE), and nonstructural protein ELISA (NSPE).
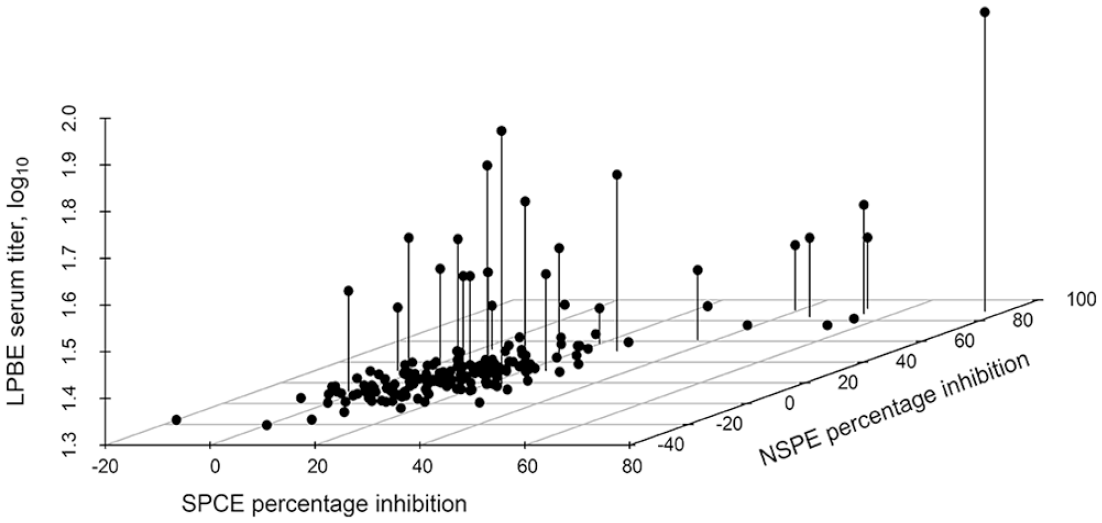
Three-dimensional scatterplot of the relationship of the calculated percentage inhibition (PI) of 184 goat serum samples collected during active foot-and-mouth disease virus (FMDV) Southern African Territories (SAT)2 outbreaks in Limpopo, South Africa tested on the SAT2 single-spot solid-phase competitive ELISA (ss-SPCE) relative to the PI of the FMDV nonstructural protein ELISA (NSPE) and the FMDV SAT2 liquid-phase blocking ELISA (LPBE).
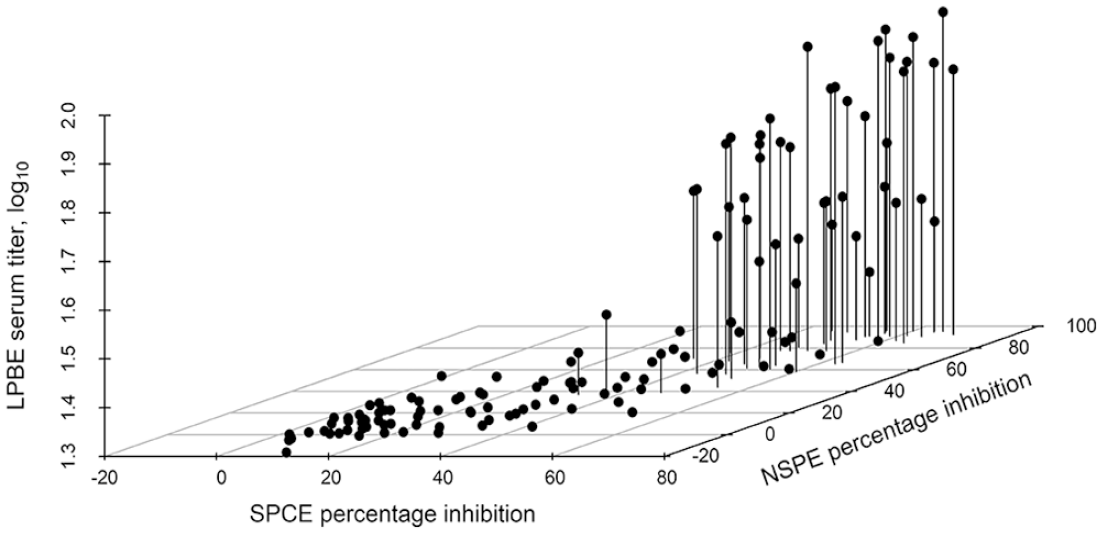
Three-dimensional scatterplot of the relationship of the calculated percentage inhibition (PI) of 132 sheep serum samples collected during active foot-and-mouth disease virus (FMDV) Southern African Territories (SAT)2 outbreaks in Limpopo, South Africa tested on the SAT2 single-spot solid-phase competitive ELISA (ss-SPCE) relative to the PI of the FMDV nonstructural protein ELISA (NSPE) and the FMDV SAT2 liquid-phase blocking ELISA (LPBE).
Scatterplots comparing the results of the foot-and-mouth disease virus (FMDV)
Discussion
When determining the repeatability of the SAT1 FMDV ss-SPCE on the experimental goat sera, within-plate variation was excellent for both the raw OD and the calculated PI across the 4 dilutions of goat sera. This low variability indicated that the assay would consistently produce duplicate results with high precision because it fell within the acceptable %CV range of raw OD readings. 4
We observed substantial positive correlation between the SAT1 ss-SPCE and the SAT1 VNT log10 titer for the 4 goat serum dilutions, which was aligned to equally good accuracy. Although VNT is classified as a gold standard test, in our study it appeared that its DSe was lower than that of the ss-SPCE. Two of the experimental goat sera sampled at 55 dpv (14 d post experimental infection with SAT1 virus) tested negative on VNT but positive on ss-SPCE. Similar findings were reported for serotype O experimentally infected sheep 26 and cattle, 21 as well as cattle and swine vaccinated with serotype A. 5
Although an initial serum dilution of 1:10 is employed when testing cattle sera, the results of a previous study suggested that a higher serum dilution might be required for goat sera. 9 We selected the 1:15 dilution as optimal because the agreement was higher, the Youden index was greater at the selected cutoff (balance between the DSp and DSe was most favorable), and the optimal cutoff was closest to the typically recommended value of 50% (middle of the expected linear range of the test). 9
Our aim in the field evaluation of the ss-SPCE was to determine its suitability for the detection of antibodies elicited by natural FMDV infection in small ruminants. The extremely high intra-assay repeatability of the calculated PI for the field goat sera was likely the result of the large number of negative goat samples. The large variations decreased as the samples became more positive. Similarly, others 22 have reported %CV of 50–67% for the PI of negative serum controls of serotypes A, O, and C. The low apparent prevalence and negative estimated true prevalence calculated in our study suggest a truly FMDV-free goat population; thus, the similarity of the %CV to the negative controls of the previous study is not unexpected.
The intra-assay repeatability of the raw OD and the calculated PI of the field sheep sera were both higher than the acceptable 15% threshold. The %CV of the raw OD suggested that the assay might not be appropriate for sheep sera. Considering that the ss-SPCE had only been optimized for goat sera, a lower precision for sheep sera suggests that further evaluation of the assay on sheep sera is required.
The repeatability of the raw OD of the field sheep sera was higher than for field goat sera within and between plates, even though the samples were tested simultaneously. However, the results from sheep were similar to a study in which the between-plate %CV of moderately positive controls for serotypes A, O, and C was 17.2–27% for the raw OD and 12–21% for the calculated PI. 22 In future, it would be beneficial to determine if the lower precision is inherent to sheep sera or if the batch tested in our study was of poor quality. This will be done by optimizing the assay further by testing various plate-coating buffers, widening the serum serial dilution range, and conjugating sheep-derived immunoglobulins to the secondary antibody HRP.
The strong correlation within the field sheep sera versus the weak correlation within the field goat sera between the SAT2 ss-SPCE and the SAT2 LPBE and NSPE assays suggest that the SAT2 ss-SPCE is appropriate for sheep sera but not goat sera, which seemingly contradicts the repeatability findings. If the assumption that the SAT2 ss-SPCE version would have similar DSp to the SAT1 ss-SPCE is correct, it is reasonable to suspect that the low correlation was the result of the DSp of the SAT2 LPBE and NSPE being much lower relative to the SAT2 ss-SPCE. These correlation findings highlight the importance of confirming the diagnostic performance of all assays under evaluation.
The observed agreement between the SAT2 ss-SPCE and the other tests was weak within goat sera but moderate within sheep sera. The high correlation and moderate agreement observed within sheep sera could be caused by inappropriate cutoff values. We had selected the cutoff value for the ss-SPCE carefully; therefore, it is reasonable to assume that the cutoff problem lies with the SAT2 LPBE. Future work is required to determine the appropriate cutoff titer for the LPBE assay for sheep sera.
The moderate agreement between the SAT2 ss-SPCE and NSPE within sheep sera could be the result of antibodies against nonstructural proteins having lasted longer than antibodies against structural proteins in truly infected animals, as has been reported for cattle. 24 In the previous study, antibodies against structural proteins were detected up to 489 dpi whereas antibodies against nonstructural proteins were detectable up to 713 dpi in a calf inoculated with an Asia1 FMDV. Similar to an outbreak in sheep in Cyprus, 27 it is also possible that the outbreak in South Africa elicited a weak immune response in sheep leading to undetectable antibodies against structural proteins over time. Future investigations should examine more carefully the kinetics and duration of the immune response to structural and nonstructural proteins of FMDV to provide clarity related to these discrepancies.
At the time of this writing, South Africa was experiencing an extensive FMD outbreak within the previously FMD-free zone. All the positive sheep in our study were sampled from farms in which cattle had tested positive in the same outbreak; hence, the estimated true prevalence of 23.6% is not representative of the entire country. The estimated negative true prevalence in the sampled goats suggested that they were free from FMDV, although some were sampled from the same positive-cattle farms. Also, several healed lesions characteristic of FMDV infection were discovered in the mouths of some of the sampled goats. This observation suggests that some goats might have been infected during the outbreak in cattle, which contradicts the study findings of the estimated negative prevalence. Continued surveillance for FMDV in goats in South Africa is required to resolve these apparent contradictions.
A major limitation of our study is the sampling bias that influenced the reported true prevalence estimates. It is essential that future studies employ random sampling if the objective is to accurately estimate the prevalence of FMDV in small ruminants. Another limitation is that, unlike in the optimization phase of the study, the gold standard VNT method was not compared to the ss-SPCE during field evaluation. This was because VNT required more sample volume than was available. Instead, LPBE and NSPE were utilized in the hope of performing latent class analysis, as recommended by the WOAH. 36 However, this analysis was not performed given the low apparent prevalence in goats and the evidence of low precision of the ss-SPCE for sheep sera. The assumption that the performance characteristics of the ss-SPCE would not be altered by switching from SAT1 to SAT2 reagents was another limitation. In future work, the performance characteristics of the assay should be confirmed for each serotype independently. Last, experimental sera instead of well-characterized sera 37 were used for the estimation of DSe and DSp; well-characterized sera for small ruminants are not readily available given that these species are often neglected in FMD control programs. As more naturally exposed small ruminant sera become available in South Africa, more precise estimation of DSe and DSp will be possible.
Despite these limitations, our findings suggest that the ss-SPCE assay can detect and quantify antibodies against the structural proteins of FMDV SAT1 and SAT2 serotypes in small ruminants. Our study highlighted that small ruminants kept in close proximity to infected cattle can be infected with FMDV during an outbreak. There is a paucity of information on the role small ruminants play in the epidemiology of FMD in Africa because very little research has been undertaken, to our knowledge. The utility of the FMDV SAT–specific ss-SPCE has the potential to contribute to filling this information gap, thereby facilitating the development of successful FMD control strategies for the region.
Footnotes
Acknowledgements
We thank the Agricultural Research Council–Onderstepoort Veterinary Research–Transboundary Animal Diseases Program (ARC-OVI-TADP) for providing their facilities for the laboratory work. We are also grateful to Henry Harris, Hanlie Jones, Keneiloe Montsu, and Robert Mkhwanazi of the Diagnostic Section at the ARC-OVI-TADP, for their technical assistance during the study.
Declaration of conflicting interests
The authors declared no potential conflicts of interest with respect to the research, authorship, and/or publication of this article.
Funding
This research was funded by the Red Meat Research Development (RMRD) of South Africa.