
Abstract
The epidemic and economic impacts of Foot-and-mouth disease virus (FMDV) spread and control were examined by using epidemic simulation and economic (epinomic) optimization models. The simulated index herd was a ≥2,000 cow dairy located in California. Simulated disease spread was limited to California; however, economic impact was assessed throughout the United States and included international trade effects. Five index case detection delays were examined, which ranged from 7 to 22 days. The simulated median number of infected premises (IP) ranged from approximately 15 to 745, increasing as the detection delay increased from 7 to 22 days. Similarly, the median number of herds under quarantine increased from approximately 680 to 6,200, whereas animals slaughtered went from approximately 8,700 to 260,400 for detection delays of 7–22 days, respectively. The median economic impact of an FMD outbreak in California was estimated to result in national agriculture welfare losses of $2.3–$69.0 billion as detection delay increased from 7 to 22 days, respectively. If assuming a detection delay of 21 days, it was estimated that, for every additional hr of delay, the impact would be an additional approximately 2,000 animals slaughtered and an additional economic loss of $565 million. These findings underline the critical importance that the United States has an effective early detection system in place before an introduction of FMDV if it hopes to avoid dramatic losses to both livestock and the economy.
Introduction
The impacts of Foot-and-mouth disease virus (FMDV) outbreaks occurring recently in previously foot-and-mouth disease (FMD)-free countries have been devastating. In 1997, an epidemic of FMD occurred in Taiwan, nearly 70 years after the disease was eradicated from that country in 1930. 11 During that epidemic, animals on more than 6,000 farms became infected, which resulted in the slaughter of approximately 4 million pigs or 40% of the population at risk. 11,20 ,23 The financial cost of the epidemic was estimated at $379 million. In addition, as a result of the trade ban of pork destined for Japan, the Taiwanese pig industry incurred an additional economic loss of $1.6 billion. These losses were in addition to the indirect losses experienced by other allied industries, including the loss of more than 65,000 jobs.23 Although the United Kingdom had been free of FMD for more than 30 years, it experienced a major FMD outbreak in 2001, which resulted in the slaughter of approximately 7 million animals and an estimated impact of $11.9–$18.4 billion, including $4.8 billion in losses to agriculture, the food industry, and the public sector, $4.2–$4.9 billion in lost tourism, and $2.9–$3.4 billion in indirect losses. 21
Although the United States has been free of FMD since 1929, it is predicted that, if FMDV were reintroduced, then the impact would be serious. Previous epidemic modeling predicted that, if there were an outbreak of FMD that originated in California, then national trade losses would exceed $700 million and the overall economic impact would range from $8.5 billion to $13.5 billion, largely because of a loss of international agriculture product markets. 7 If there were an FMD epidemic in the United States (similar to the 2001 U.K. FMD epidemic), then it is estimated that farm income could be reduced by approximately $7–$21 billion, depending on the change in consumption of red meat and dairy products. 15 Recently, the U.S. beef industry lost $3.2–$4.7 billion in 2004 because of export restrictions imposed after the 2003 diagnosis of 3 cases of bovine spongiform encephalopathy (BSE) in the United States (Coffey et al., unpublished report, 2005).
There may be ways to lower vulnerability through policy actions and investments. The current report looks at detection issues. In terms of detection, it is logical that the longer the delay in detecting the presence of the FMDV and, thus, implementing appropriate control and eradication strategies, the greater the loss, both in terms of animals affected and economic impact. Extended diagnostic delays associated with the introduction of FMDV into a country that did not have a recent history of the disease are not uncommon. In the 2001 U.K. FMD epidemic, it was estimated that FMDV was introduced 21 days before being diagnosed in an abbatoir. 18 The large magnitude of the 2001 U.K. FMD epidemic can be attributed to the delayed diagnosis of the index case, among other factors. 9 Similarly extensive delays were observed in the 1997 epidemic in Taiwan (Food and Agriculture: 2002, EMPRES Transboundary Anim Dis Bull 20:1–24. Available at ftp://ftp.fao.org/docrep/fao/005/y4429e/y4429e00.pdf) and in the 1951–1952 epidemic in Canada. 19 Although a recent study failed to identify a significant relationship between detection delay and outbreak size in 24 FMD epidemics that occurred between 1992 and 2003 in FMD-free countries, 14 further examination of log transformed data from 14 of these outbreaks, where fewer than 100 days lapsed between the time from virus incursion to when first restrictions were reported, found a significant correlation between detection delay in days and log infected premises (IP; T. E. Carpenter, unpublished analysis, 2010).
Previous work estimated the direct cost of delaying the diagnosis of the index case of FMD if the virus were to enter a 3-county area in California to be $2.5 million per hr (T. E. Carpenter, unpublished analysis, 2005). However, this estimate included only disease control costs and indemnity, and not secondary (e.g., trade and feed grain industry–related costs) or indirect costs, which can be significant. The purpose of the current study was to estimate the epidemic and economic impacts in the United States associated with a delayed diagnosis of FMD if the virus were introduced into a large dairy in California.
Materials and methods
Study population
The FMD-susceptible livestock in California are located in approximately 22,000 herds: 7,500 beef cow and feeding operations, 2,200 dairy cow herds, 280 calf and heifer–raising operations, 5,600 sheep and goat herds, 560 swine operations, 5,500 backyard herds, and 50 sales yards (T. E. Carpenter, unpublished survey data, 2006). 16 The population in these herds is approximately 6.4 million animals, which includes approximately 660,000 beef cows, 1.8 million dairy cows, 3.0 million calves and bulls, 150,000 pigs and hogs, 600,000 sheep and lambs, and 131,000 goats and kids (National Agriculture Statistical Service, United States Department of Agriculture: 2007 Census of Agriculture).
Epidemic model
A spatial, stochastic, individual-animal–based simulation model, the Davis Animal Disease (DADS) model, 1,16 was used to predict the spread and control of FMD in California if it were introduced into a large dairy herd in that state. There are 13 herd types simulated in the DADS model: small (≤250) and large (>250) beef herds; small (≤1000), medium (1001–1999), and large (>2000) dairies; small (≤250) and large (>250) calf and heifer–raising operations; small and large swineherds, goat flocks, and sheep flocks (<2000 and ≥2000, respectively); backyard herds (<10 head); and sales yards.
In the model, the daily probability of animal movements and other contacts between pairs of premises is a function of both premise type and of the distance between them. Like other spatially explicit simulation models of FMD, 5–7,13 the DADS model uses a long-tailed distance kernel to represent the distance-dependence of contact frequencies. The distance kernels reproduce important aspects of the contact networks observed in the U.K. outbreak, such as the combination of mostly short-distance contacts with an occasional “bridging” long-distance contact that is characteristic of “small-world” networks. 12 In the model, sales yards, with their high rates of in- and out-shipment, can act as “superspreaders” of disease, just as the Longtown Market did with such impact during the 2001 U.K. outbreak. 12 Both the frequencies of movements between herd types and the distance kernels for direct and indirect contact rates were based on data from the literature, surveys, and expert opinion. 2
Cost information
Costs were categorized as direct or indirect. The direct cost has 2 components, primary and secondary. Direct primary costs are disease management costs and carcass disposal costs (Table 1). Disease management cost, which is calculated as the number of animals affected times the cost per head of disease management, includes costs of testing animals that may be slaughtered or restricting animal movements, in addition to veterinary charges for visiting IPs and checking restricted premises. Also included in direct primary costs is the cost of carcass disposal. It is assumed that all infected animals are slaughtered as well as some slaughter associated with welfare slaughter. Carcass disposal cost includes costs of appraising the herd for slaughter, euthanizing animals, cleaning and disinfecting the premises, and disposing of carcasses from infected herds. Direct primary costs will accrue mainly to the government and also to producers. Costs are based on a schedule that varies by herd type and/or size.
Direct secondary costs and indirect costs are estimated endogenously in the economics model by using a series of supply-and-demand curves and by allowing the national equilibrium quantities and prices to be determined by the balancing of these curves. Direct secondary costs, which are the result of induced price changes, and indirect costs, such as consumer effects, can be best estimated by using this method. This will be described in greater detail below.
Explanation of direct primary costs by category, description, and monetary value used to estimate the national loss to the United States in total agricultural surplus ($ billion) in a simulated foot-and-mouth disease (FMD) outbreak in California. *
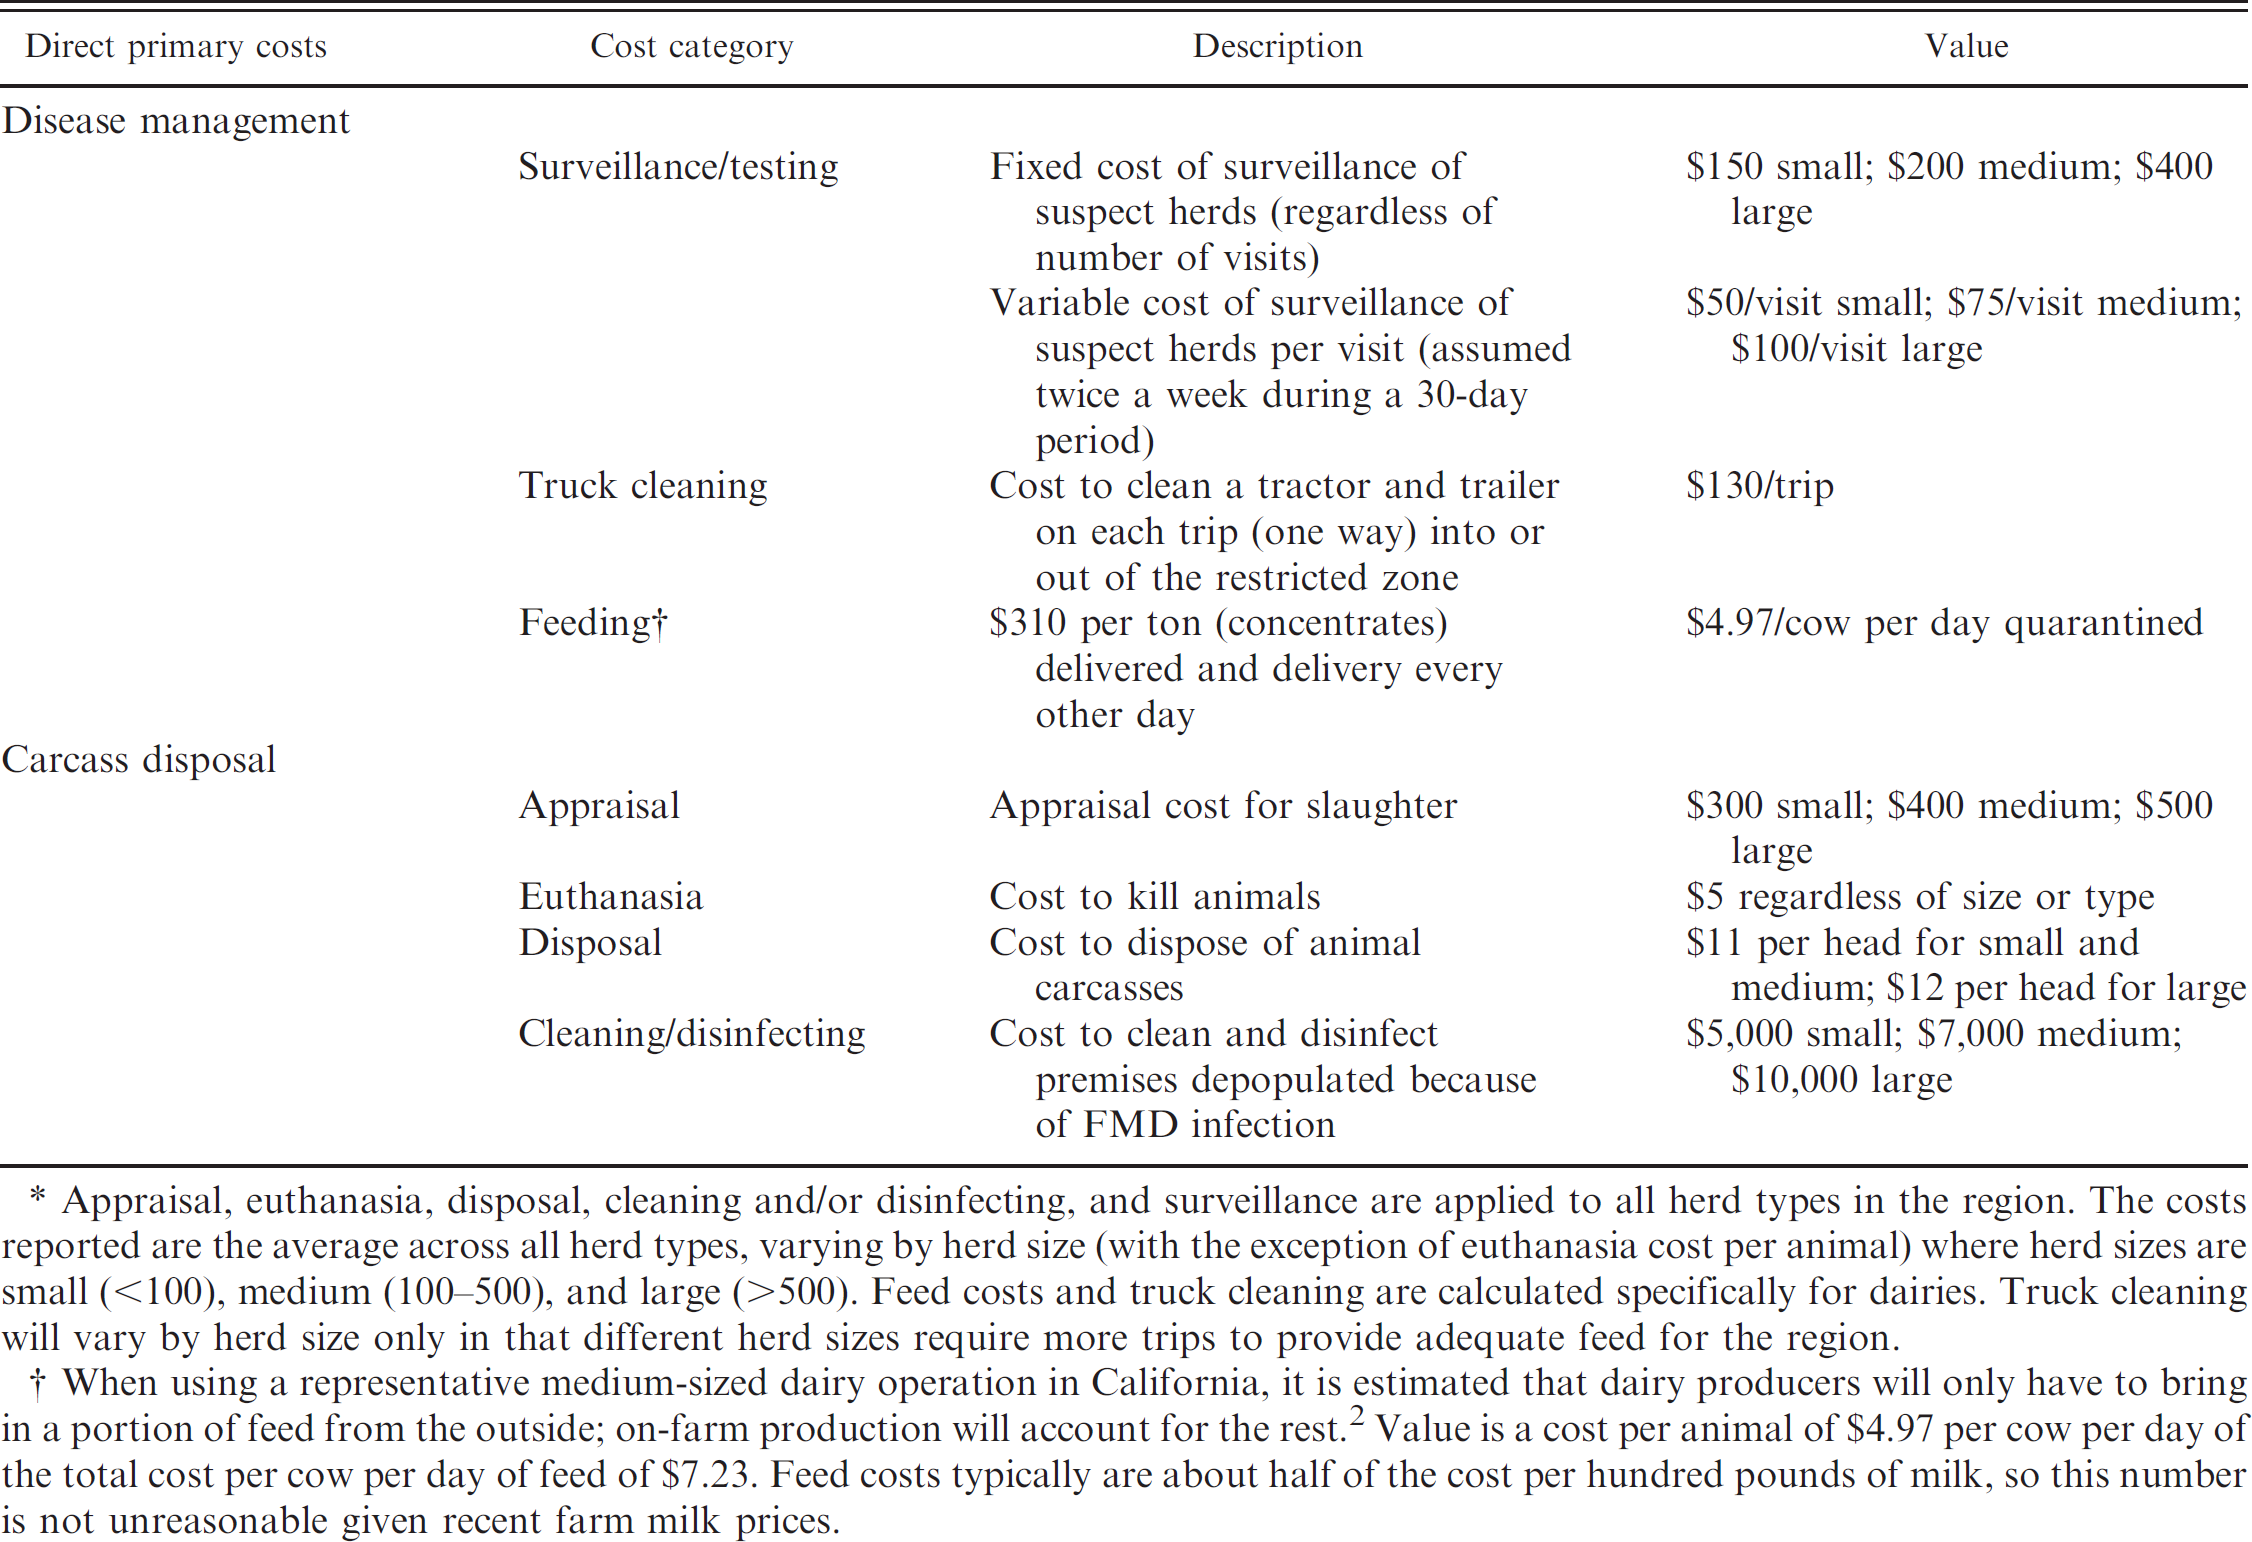
Appraisal, euthanasia, disposal, cleaning and/or disinfecting, and surveillance are applied to all herd types in the region. The costs reported are the average across all herd types, varying by herd size (with the exception of euthanasia cost per animal) where herd sizes are small (<100), medium (100–500), and large (>500). Feed costs and truck cleaning are calculated specifically for dairies. Truck cleaning will vary by herd size only in that different herd sizes require more trips to provide adequate feed for the region.
When using a representative medium-sized dairy operation in California, it is estimated that dairy producers will only have to bring in a portion of feed from the outside; on-farm production will account for the rest. 2 Value is a cost per animal of $4.97 per cow per day of the total cost per cow per day of feed of $7.23. Feed costs typically are about half of the cost per hundred pounds of milk, so this number is not unreasonable given recent farm milk prices.
Economic model
The losses in the U.S. agricultural sector beyond direct primary costs are categorized as either direct secondary losses or indirect losses. These losses will accrue to producers, processors, and consumers in the United States. The Agricultural Sector Model (ASM), which is a component of the Forest and Agricultural Sector Optimization Model (Adams et al., unpublished report, 2005), was used to capture the change in economic welfare or economic surplus from FMD. (Economic welfare loss is the loss in the aggregate well being of participants in a market based on alternative allocations of scarce resources. This is sometimes referred to as economic surplus. The second term will be used here to prevent confusion with the term welfare slaughter.) The ASM uses a series of supply-and-demand curves for the U.S. agricultural sector, including crops, livestock, consumer effects, and international trade, then calculates a dollar loss of lost net income and an economic loss to consumers in the form of economic surplus from net commodity price changes. The trade impacts are also estimated within ASM as were the effects inside and outside the affected region. Direct secondary costs include induced price changes and the costs to production in livestock and feed grain operations. For example, the reduction in aggregate livestock supply in the United States will change the U.S. domestic price of calves because fewer head will be available to meet national demand; furthermore, the price of feedstuffs will change and will impact corn and hay prices nationally.
The largest category of direct secondary losses will be international trade impacts. Exports of livestock and livestock products will have impacts reaching into noninfected regions such as the Corn Belt pork production area. Direct secondary costs include the changes in producer welfare in other regions beyond the infected region. Results presented herein include the trade losses, when assuming that the export of FMD-affected nonpasteurized products is closed for the entire country for a full year after the outbreak is brought under control.
Indirect costs include consumer and employment effects; losses to related industries, such as dairy processing; impacts on local economies; and the impact of changing import levels in response to changing domestic and world livestock and meat prices. Consumer and employment effects will be mixed in the event of an outbreak. No negative response in meat consumption is included in the present study as a response to information release on the FMD outbreak. The price adjustment that the consumers face will vary, depending on the relative sizes of the domestic supply reduction and excess supply that would previously be destined for international exports. Because meat from noninfected animals and dairy products destined for export are pushed into the domestic market, this could decrease the prices that consumers pay. However, because the national supply of these products is lower because of the removal of products at risk of transmitting the virus, consumers could potentially face higher prices for other meat and dairy products. Employment effects will also be mixed because additional labor will be needed to respond to the outbreak, but, for the recovery period after the outbreak, some employment will be terminated. The economic surplus loss for diagnostic delays not simulated previously were interpolated by using results obtained from the diagnostic delays simulated here.
Integrated epinomic (epidemic and economic) model
The third stage is the linking of the epidemic and economic (epinomic) models and the disease-related adjustments in the economic model. To assess risk through both epidemic and economic portions, the alternative stochastic results from the epidemic portion may be run through the economic portion as statistically independent trials. Additional assumptions made in the economic model to assess animal disease are as follows: 1) the outbreak is controlled during the period evaluated, and, as such, there are no large, longer-run regional reallocation in locations of production activities (i.e., dairy is still produced in California after the outbreak is eradicated, although not necessarily at the same level), 2) the economic model, which can be run as either static or dynamic, is static and, in this instance, limited to a single representative year to examine the short-run implications of a delay in diagnostics, and 3) inputs destined for the infected region (i.e., feed earmarked for depopulated premises) can be moved to alternative high-value uses. The outputs of the epidemic model in terms of animals infected and consequently depopulated animals depopulated for disease control purposes, and animals quarantined, as well as the length of the quarantine, are used as inputs to adjust the regional production budgets in the ASM. These adjustments in regional production as well as the costs incurred as a result of the outbreak were applied to the series of supply-and-demand curves in ASM, which rebalance across the nation for a wide range of livestock and crop primary commodities as well as processed products. The output of the ASM, economic surplus, is driven by the consequent changes in regional equilibrium quantities supplied and/or demanded and national prices. The integrated epinomic model developed assesses impacts among vertically and horizontally linked markets, consumers and producers, and domestic and international markets within a single framework. The model developed is a unique contribution among integrated models.
FMD outbreak assumptions
The simulated FMD-index case occurred in a dairy herd, which consisted of at least 2,000 animals and was located in California. The source of infection was accidental exposure from an FMDV-infected feral pig; however, similar results would occur if the exposure were accidently from an imported FMDV-infected animal, from indirect contact from an FMDV-contaminated traveler returning from an FMDV-infected country, or intentionally (e.g., from bioterrorism). The diagnosis was presumed to be based on clinical signs and laboratory confirmation. Once an FMD diagnosis was confirmed, a 3-day statewide movement ban was imposed, followed by a 10-day restricted movements of all susceptible animals from premises within 20 km of IPs. All animals were slaughtered if they were located on an IP, regardless of whether or not the animal was infected.
Simulations
Five simulated diagnostic delays (at 7, 10, 14, 21, and 22 days) were evaluated. For each of the diagnostic delays, 100 epidemics were simulated by using the DADS model and 100 resulting economic losses were generated for each diagnostic delay by using the ASM, for a total of 1,000 iteration runs. Results from the models were summarized as mean, median, 25th and 75th percentiles, and minimum and maximum.
Additional losses with a 1-day or 1-hr diagnostic delay
Based on the results obtained from the 5 simulated diagnostic delays, a mathematic equation was derived to estimate the economic impact associated with a 1-day delay that occurred between days 7 and 21 but were not examined. By using the results for the 21- and 22-day delays, the impact of a 1-hr delay occurring at day 21 was estimated by dividing the difference in economic impacts associated with these days by 24 hr.
Results
Epidemic impact
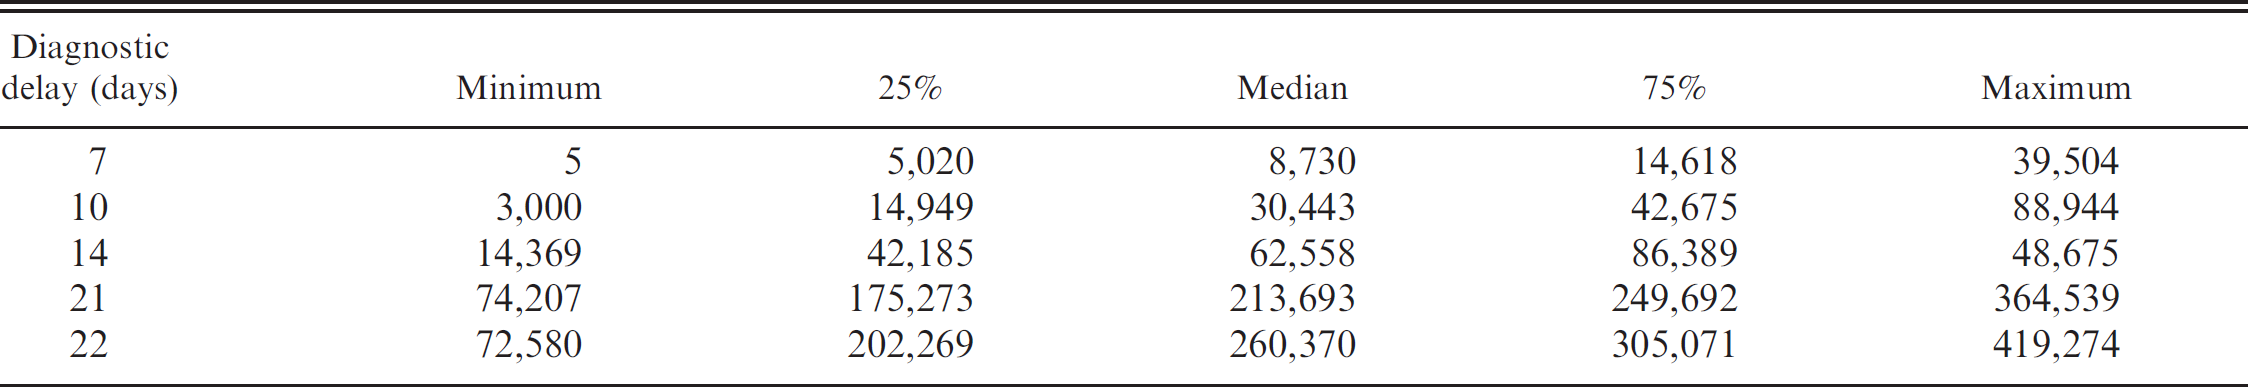
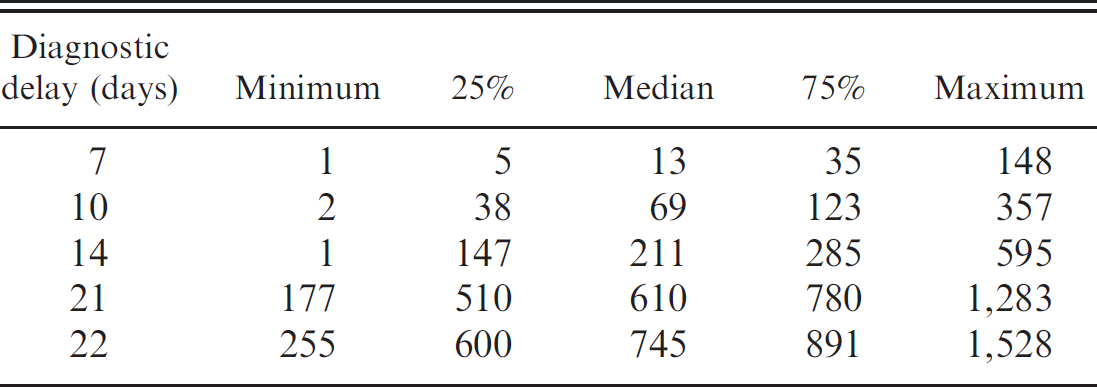
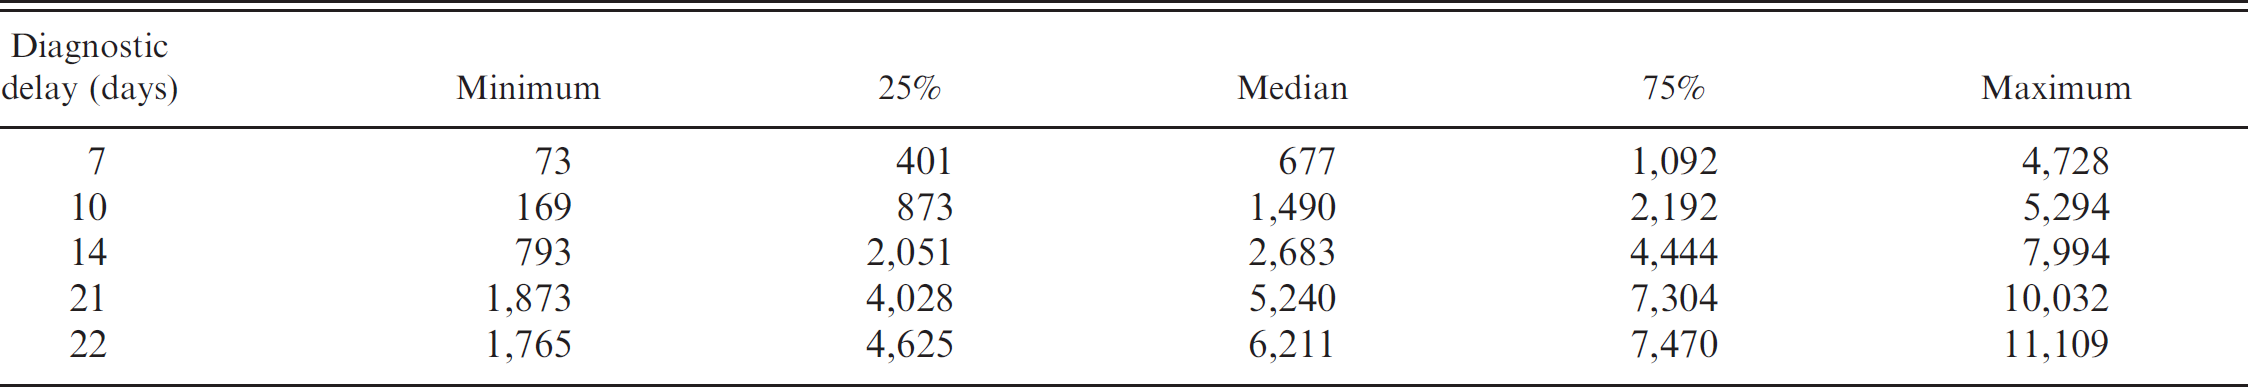
As the diagnostic delay increased from 7 to 22 days, the median number of animals slaughtered ranged from approximately 8,700 to 260,400 animals or 0.1% to 4.1% of the California livestock (Table 2). The maximum number of animals slaughtered was estimated to be approximately 419,300. The median number of IPs ranged from approximately 15 to 745 animals or 0.1% to 3.4% of the California livestock herds, as the diagnostic delay increased from 7 to 22 days (Table 3). The maximum number of IPs was estimated to be almost 1,530. The median number of herds under quarantine ranged from approximately 680 to 6,200 herds or 2.6% to 23.7%, as the diagnostic delay increased from 7 to 22 days (Table 4). The maximum number of herds under quarantine was estimated to be 11,100 or 42.3% of the livestock herds in California.
Economic impact
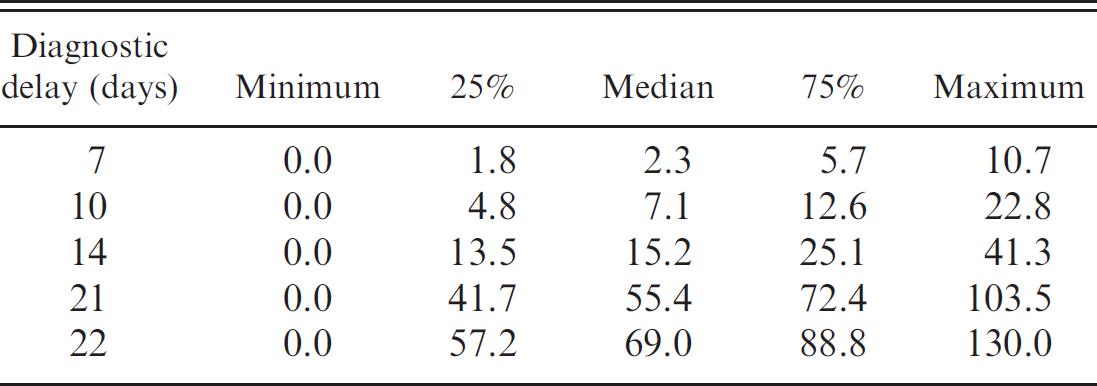
The median national loss in total agricultural surplus ranged from $2.3 billion to $69.0 billion, as the diagnostic delay increased from 7 to 22 days (Table 5). The losses were simulated to be as high as $10.7–$130.0 billion, as the diagnostic delay increased from 7 to 22 days. Although the distribution of costs varied by size and duration of the epidemic, they were primarily direct costs. To illustrate the distribution of the $55.4 billion in economic losses expected if the diagnosis of FMD were delayed for 21 days is as follows: direct primary costs, $42.0 billion; direct secondary costs, $11.0 billion; and indirect costs, $2.4 billion.
Summary statistics for the number of animals slaughtered in a simulated foot-and-mouth disease outbreak in California.
Additional losses with a diagnostic delay
The mathematic relationship between detection delay (DD) in days and economic impact (EI) in $ billions was specified by the following equation:

(R 2 = 0.996, P < 0.001; Fig. 1). Because the diagnosis is delayed from 7 to 21 days, the estimated marginal, or daily, delay impact increases from $1.1 billion to $7.4 billion, which illustrates the increasing impact of delaying the diagnosis an additional day, as the detection delay increases.
Based on the initial assumption that FMD would be diagnosed 21 days after the initial infection, losses associated with an additional hr of delay would be dramatic. The median number of animals slaughtered was simulated to increase by 3,550 animals per hr of delay. The median number of IPs and herds required to be under quarantine were predicted to increase at the rate of approximately 6 and 40 IPs per hr of delay, respectively. The median national loss in total agricultural surplus was predicted to increase by approximately $565 million per hr of delay.
Summary statistics for the number of infected premises in a simulated foot-and-mouth disease outbreak in California.
Discussion
In the current study, the epidemic and economic impacts of a simulated FMD outbreak in California were estimated. Results demonstrate that the impacts, in terms of animals slaughtered, herds affected, and economic losses, exceed previous predictions. 1,3 Earlier studies simulated FMDV transmission on a 3-county level in California 1,3 for a population at risk of approximately 2,200 herds, or approximately 10% of the herds used in the current study. In each of these studies, animal movements were based on survey data and not on complete network data, which are not collected in the United States. As in the current study, a 21-day diagnostic delay of the index case herd, which was a dairy, was assumed. The previous study1 estimated that the median number of IPs would be approximately 100 versus 610 reported in the current study. In addition, the estimated mean cost of the simulated outbreaks was approximately $90 million compared with $65 billion observed herein. Importantly, the previous study 3 considered only direct costs associated with the FMD control program, whereas the present study included direct and indirect costs as well as trade losses, which were a substantial portion of total economic losses.
Another epidemic simulation study of FMD in California reported the median number of IPs ranged from approximately 95 to 420, depending on where in the state the index case herd was located, 16 which is smaller than the 610 IPs reported in the current study. Similarly, the previous study 16 reported that the median number of animals slaughtered in the IPs ranged from approximately 10,000 to 160,000, depending on the location of the index case herd, which is smaller than the approximately 214,000 reported in the current study. The larger estimates obtained from the current study are likely because, in the previous study, 16 a dairy was randomly selected in a given region throughout the state, whereas in the current study, the index herd was always a large dairy (≥2000 cows) and located in the more dairy-intensive part of the state, which typically resulted in a larger epidemic and consequently more animals slaughtered. If in fact more than 200,000 livestock were present in IPs and needed to be slaughtered in a short period of time to minimize FMDV transmission, then it would be a logistical nightmare for both the state and the nation to determine how and where these animals, largely dairy cattle, would be disposed. From the standpoint of monetary compensation to the livestock owners, if there were a 21-day detection delay of an FMD outbreak, then the amount of indemnity would be approximately $85 million. If the federal government were unable to supply the necessary compensation, then it is unlikely such funds could come from the state, which is currently projected to operate with an annual deficit of approximately $20 billion through 2015 (California Legislative Analyst's Office, unpublished report, 2010). If funds were not available to compensate producers, then it is unclear what would occur (i.e., if the animals would be slaughtered or vaccinated). If they are vaccinated, then it would then need to be determined whether or not vaccinated animals would be permitted to survive until they completed their normal productive lives or if they would be slaughtered as soon as possible to minimize the risk of virus transmission.
Summary statistics for the number of herds under quarantine in a simulated foot-and-mouth disease outbreak in California.
Previous studies have attempted to estimate the economic impact of an introduction of FMD into the United States; however, these studies either did not predict or report the delay (Ekboir, unpublished study, 1999) 14 or assumed a much more optimistic diagnostic delay than the 21 days assumed in the current study. 17 For example, one study simulated an FMD outbreak in the United States when assuming a diagnostic delay of 6–7 days 17 and predicted a median of approximately 50 IPs and an economic cost of approximately $465 million. Although the number of IPs predicted is similar to the approximately 15–70 IPs predicted in the current study, when 7–10-day detection delays were assumed, the estimated impact in the previous study is far less than the $2.3–$7.1 billion calculated. Estimates reported in the current study include large losses to producers in both infected and noninfected regions because of trade and consumer losses and because of higher dairy and beef prices. Estimates 18 also include significant losses to pork producers from lower pork prices as a result of trade bans, losses to feed grain producers from lower feed grain prices, as well as losses in other agricultural sectors as a result of the outbreak. In addition, the direct primary costs of disease management includes the cost of cleaning feed and milk transport vehicles that move into and out of the movement restriction zone and includes this in the cost of additional feed needed to prevent welfare slaughter on premises with limited on-farm feed supplies.
Summary statistics for the national loss to the United States in total agricultural surplus ($ billion) in a simulated foot-and-mouth disease outbreak in California.
Results from a foreign animal disease outbreak investigation must include trade impacts to truly measure the extent of the outbreak impacts. Although the results presented include trade impacts, this may actually be a worst-case scenario of the trade impacts. The likelihood of having a “trade lockdown” of all nonpasteurized livestock products for a full year even though the disease is contained within a few months is unknown; however, as reported previously, the export of beef from the United States was dramatically reduced for years after 3 reported cases of BSE in the United States (Coffey et al., unpublished report, 2005). However, it is less likely that the trade impact will be as extreme for FMD as it was for BSE, because of the more chronic nature and potentially zoonotic impact of BSE. The ASM examined only the economic impact for the first year of the epidemic; however, it could be extended to find the long-term economic impact, if long-term trade impact information were available.
Furthermore, there is the possibility of zoning the disease to a particular region. In this study, zoning might mean that, because the disease is contained in California, only California exports would be restricted. This certainly would reduce impacts related to pork because California is such a small producer of this commodity, which makes up a large expected trade impact. Even if zoning were not used, some trade may be resumed before the end of the year where the current study assumes the remainder of the year trade restrictions will be in place.
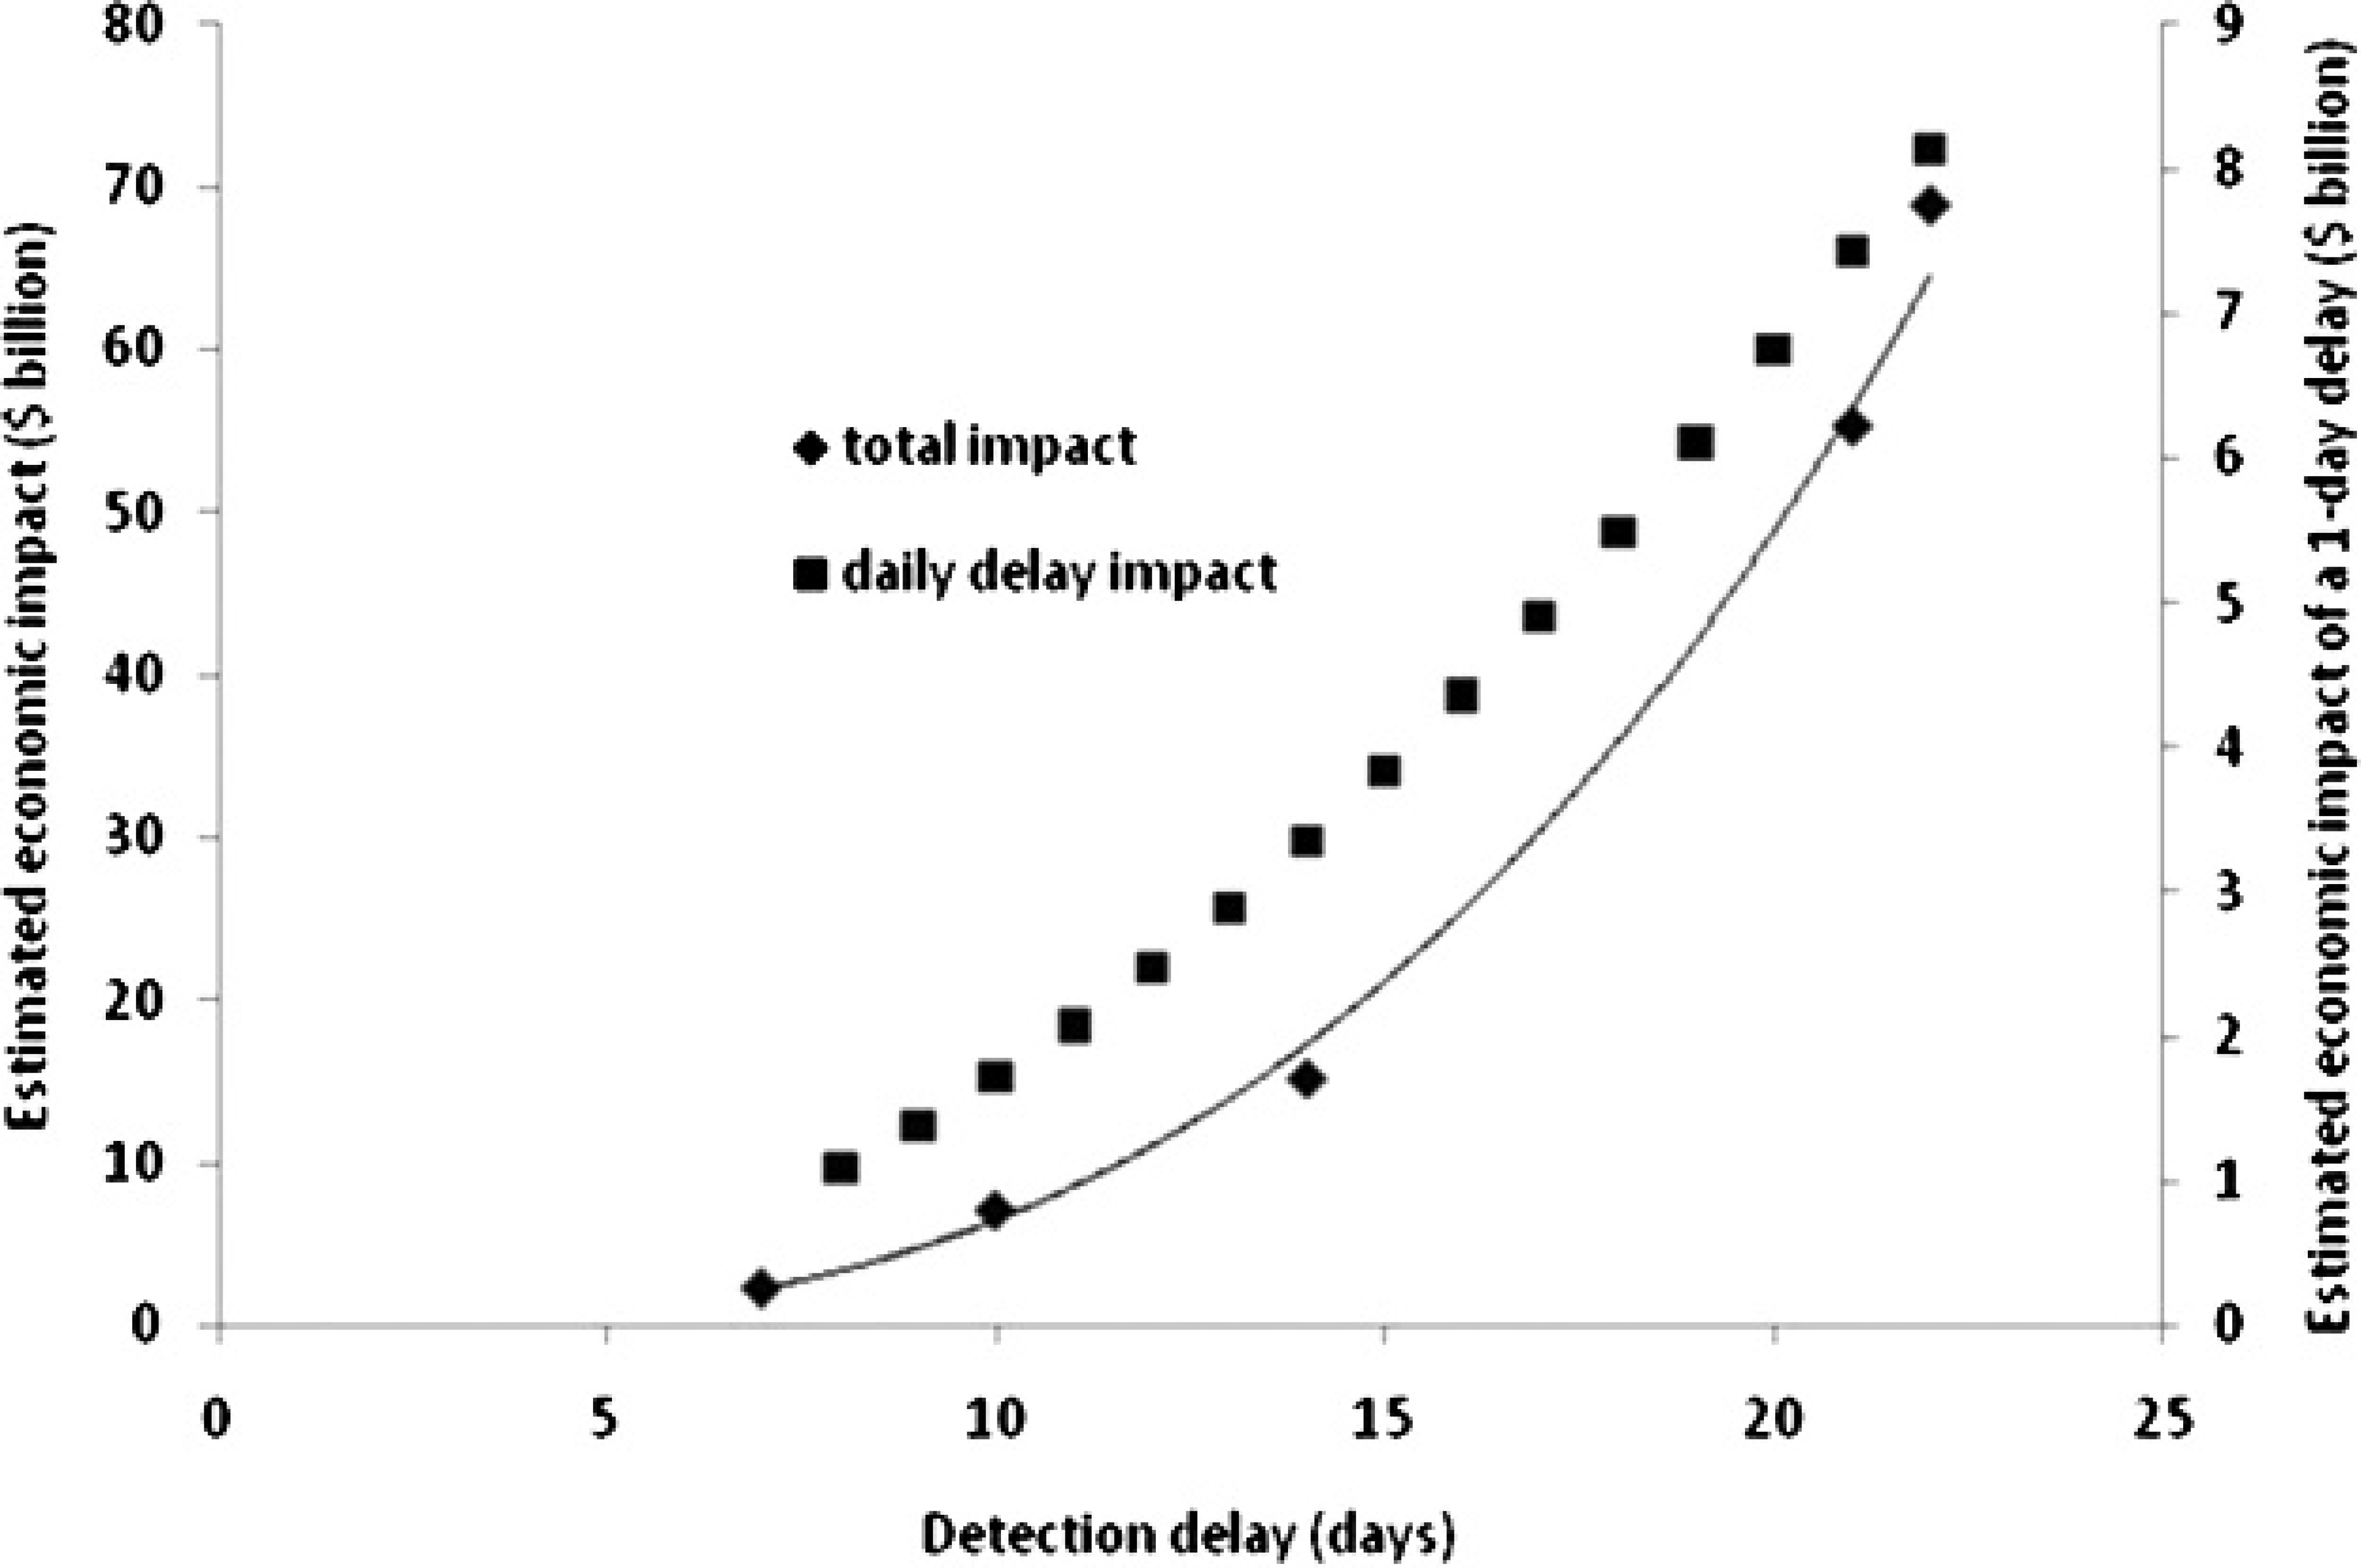
Estimated total and incremental daily economic losses associated with a diagnostic delay of a simulated foot-and-mouth disease in a California dairy.
The ability to respond quickly to an exotic disease outbreak is critical to the final outcome. It is estimated that, if a nationwide movement ban had been put in place 1 day after instead of 3 days after the confirmed outbreak of FMD in the United Kingdom in 2001, then the number of IPs could have been reduced by more than 50%, from 2,026 to 977. 10 Based on the current study's modeling results, the expected result of diagnosing and implementing appropriate control strategies from 21 to 22 days resulted in an 18% increase in IPs, from 610 to 745. In fact, the simulated impact of delaying the detection of FMD for even an hr after the expected 21-day detection delay was nearly 2,000 animals slaughtered, 6 IPs, and more than $500 million, which highlights the importance of the focus on efforts needed to reduce the expected diagnostic delay if FMD were introduced into the United States.
Examples of increased surveillance could include improved exotic disease education for both the producers and food animal veterinarians and strategic deployment of devices capable of detecting the pathogen, especially on high-risk premises, such as sales yards, dairies, or calf and heifer–raising operations. In addition, the potential of syndromic surveillance, focusing on either decreased milk production or feed intake, should be investigated, simultaneously considering the costs of such programs with the costs of investigating false alarms, and comparing these with the reduction in FMD-associated losses that would result from a reduced detection delay. For example, simulation studies of FMD in a dairy predicted that a large portion of a herd could be infected before it would be diagnosed based on detection of FMD lesions; however, it could be detected several days earlier if a bulk milk surveillance of FMDV program were used. 4,22 Based on the current study findings, which showed that the vast majority of the economic losses associated with an FMD outbreak in California would be borne by the producer, it is reasonable to assume that the producers would readily participate in a surveillance plan that would reduce such impact.
Acknowledgements
The study was funded by the Foreign Animal and Zoonotic Disease Defense Center, a Department of Homeland Security National Center of Excellence at Texas A&M University.