
Abstract
We assessed the effects of fixation time in formalin and inclusion of surrounding tissue on microRNA (miRNA) cycle quantification (Cq) values in formalin-fixed, paraffin-embedded (FFPE) urothelial carcinoma (UC) tissue (n = 3), and the effect of conditions on miRNAs in urine from 1 healthy dog. MiRNAs were extracted using commercial kits and quantified using miRNA-specific fluorometry in normal bladder tissue scrolls, UC tissue cores, and bladder muscularis tissue cores from 4 FFPE bladder sections (3 UCs, 1 normal), plus 1 UC stored in formalin for 1, 8, 15, and 22 d before paraffin-embedding. Urine was collected from a healthy dog on 4 occasions; 1-mL aliquots were stored at 20, 4, −20, and −80°C for 4, 8, 24, and 48 h, and 1 and 2 wk. For both FFPE tissue and urine, we used reverse-transcription quantitative real-time PCR (RT-qPCR) to quantify miR-143, miR-152, miR-181a, miR-214, miR-1842, and RNU6B in each tissue or sample, using miR-39 as an exogenous control gene. The Cq values were compared with ANOVA and t-tests. The time of tissue-fixation in formalin did not alter miRNA Cq values; inclusion of the muscularis layer resulted in a statistically different miRNA Cq profile for miR-152, miR-181a, and RNU6B in bladder tissue. MiRNAs in acellular urine were stable for up to 2 wk regardless of the storage temperature. Our findings support using stored FFPE and urine samples for miRNA detection; we recommend measuring miRNA only in the tissue of interest in FFPE sections.
MicroRNAs (miRNAs) are regulatory noncoding RNAs first discovered in 1993. 28 They are short (18–24 nucleotides in length) with a stem-loop structure, 17 responsible for post-transcriptional regulation of gene expression. MiRNAs are essential modulators of cell differentiation, proliferation, and function, and their expression is often altered in disease,5,19,39 including cancer,22,39,57 as well as non-neoplastic12,19,34,44 and infectious diseases.5,17,61 Moreover, functional studies have linked miRNA dysregulation as a factor in disease progression.17,42,49,61
The alterations of miRNA gene expression in disease provide great potential for their use as diagnostic biomarkers.12–14,17,19,55 Additionally, miRNAs are abundant and stable and can be recovered from formalin-fixed, paraffin-embedded (FFPE) tissues and from biofluids,4,6,7,17,30,33,51 including plasma, saliva, and urine.3,6,7,37,38,45 Moreover, miRNAs remain stable in serum after being subjected to extreme conditions, such as boiling, extreme variations in pH, extended storage, and numerous freeze–thaw cycles.3,7,30,51 In addition to their use as diagnostic biomarkers, the use of miRNAs as therapeutic agents has been analyzed17,18,24,36,45 utilizing a variety of delivery systems to deliver miRNA mimics or suppressors to the tissue site.45,48,56
Although miRNAs are stable and show promise as both diagnostic markers and therapeutic targets, there is a paucity of studies in the veterinary literature on the stability of miRNAs in canine samples, such as FFPE tissue and urine, especially in situations in which samples need to be shipped or stored before processing. Additionally, the effect of including tissues surrounding a lesion for miRNA gene expression when utilizing FFPE tissue scrolls for miRNA has not been quantified (i.e., the presence of the muscularis layer adjacent to normal or neoplastic urothelium).
Canine urothelial carcinoma (UC) is a malignant tumor of the urinary epithelium that comprises 2% of malignant tumor diagnoses in dogs.10,16,26,40,50 UC often occurs as a discrete tumor within the urinary bladder.9,10,37,40,50 The bladder wall consists of the urothelium, lamina propria, and the muscularis layers (Fig. 1). UC originates in the urothelial layer of the bladder and often invades the other layers in dogs.26,40 Formalin-fixation and paraffin-embedding is a method of tissue preservation that allows storage for future applications. Tissue scroll4,11,31,41,51,52 and core 46 samples from FFPE tissue can be used as sources of nucleic acids, such as miRNAs. Use of tissue scrolls has the advantage of preserving the tissue block for other purposes (Fig. 2A); however, scrolls include the surrounding tissues, not just the area of interest. 29 Tissue coring uses a biopsy needle inserted directly into the tissue of interest (Fig. 2B). 46 Although coring targets the tissue of interest, tissue blocks may not be reused for other purposes. 46 A third method that can be used to isolate tissue sections of interest is laser-capture microscopy, which is only available in research and academia and is associated with a higher cost. 15
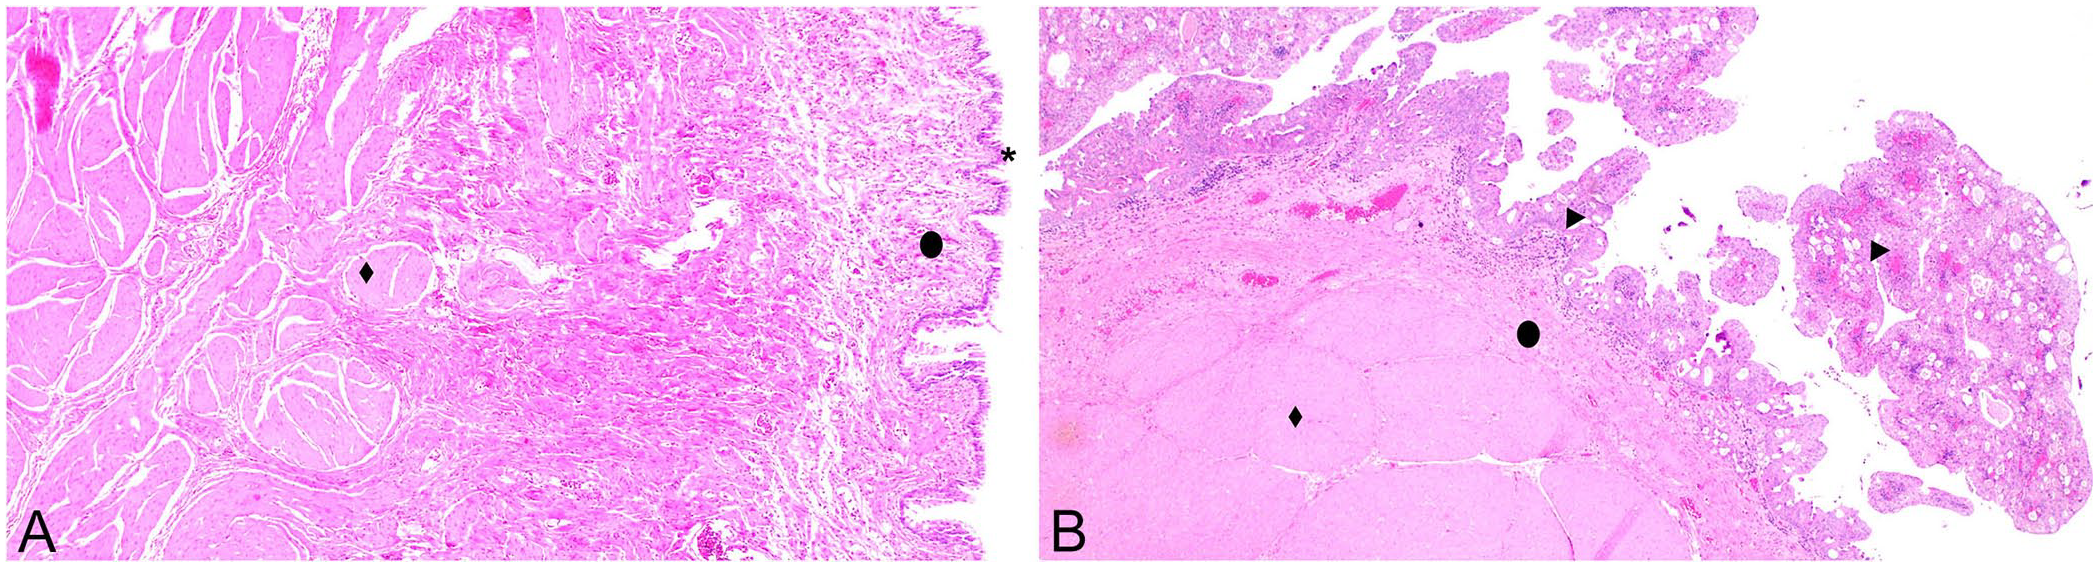
Histologic sections of canine urinary bladder.
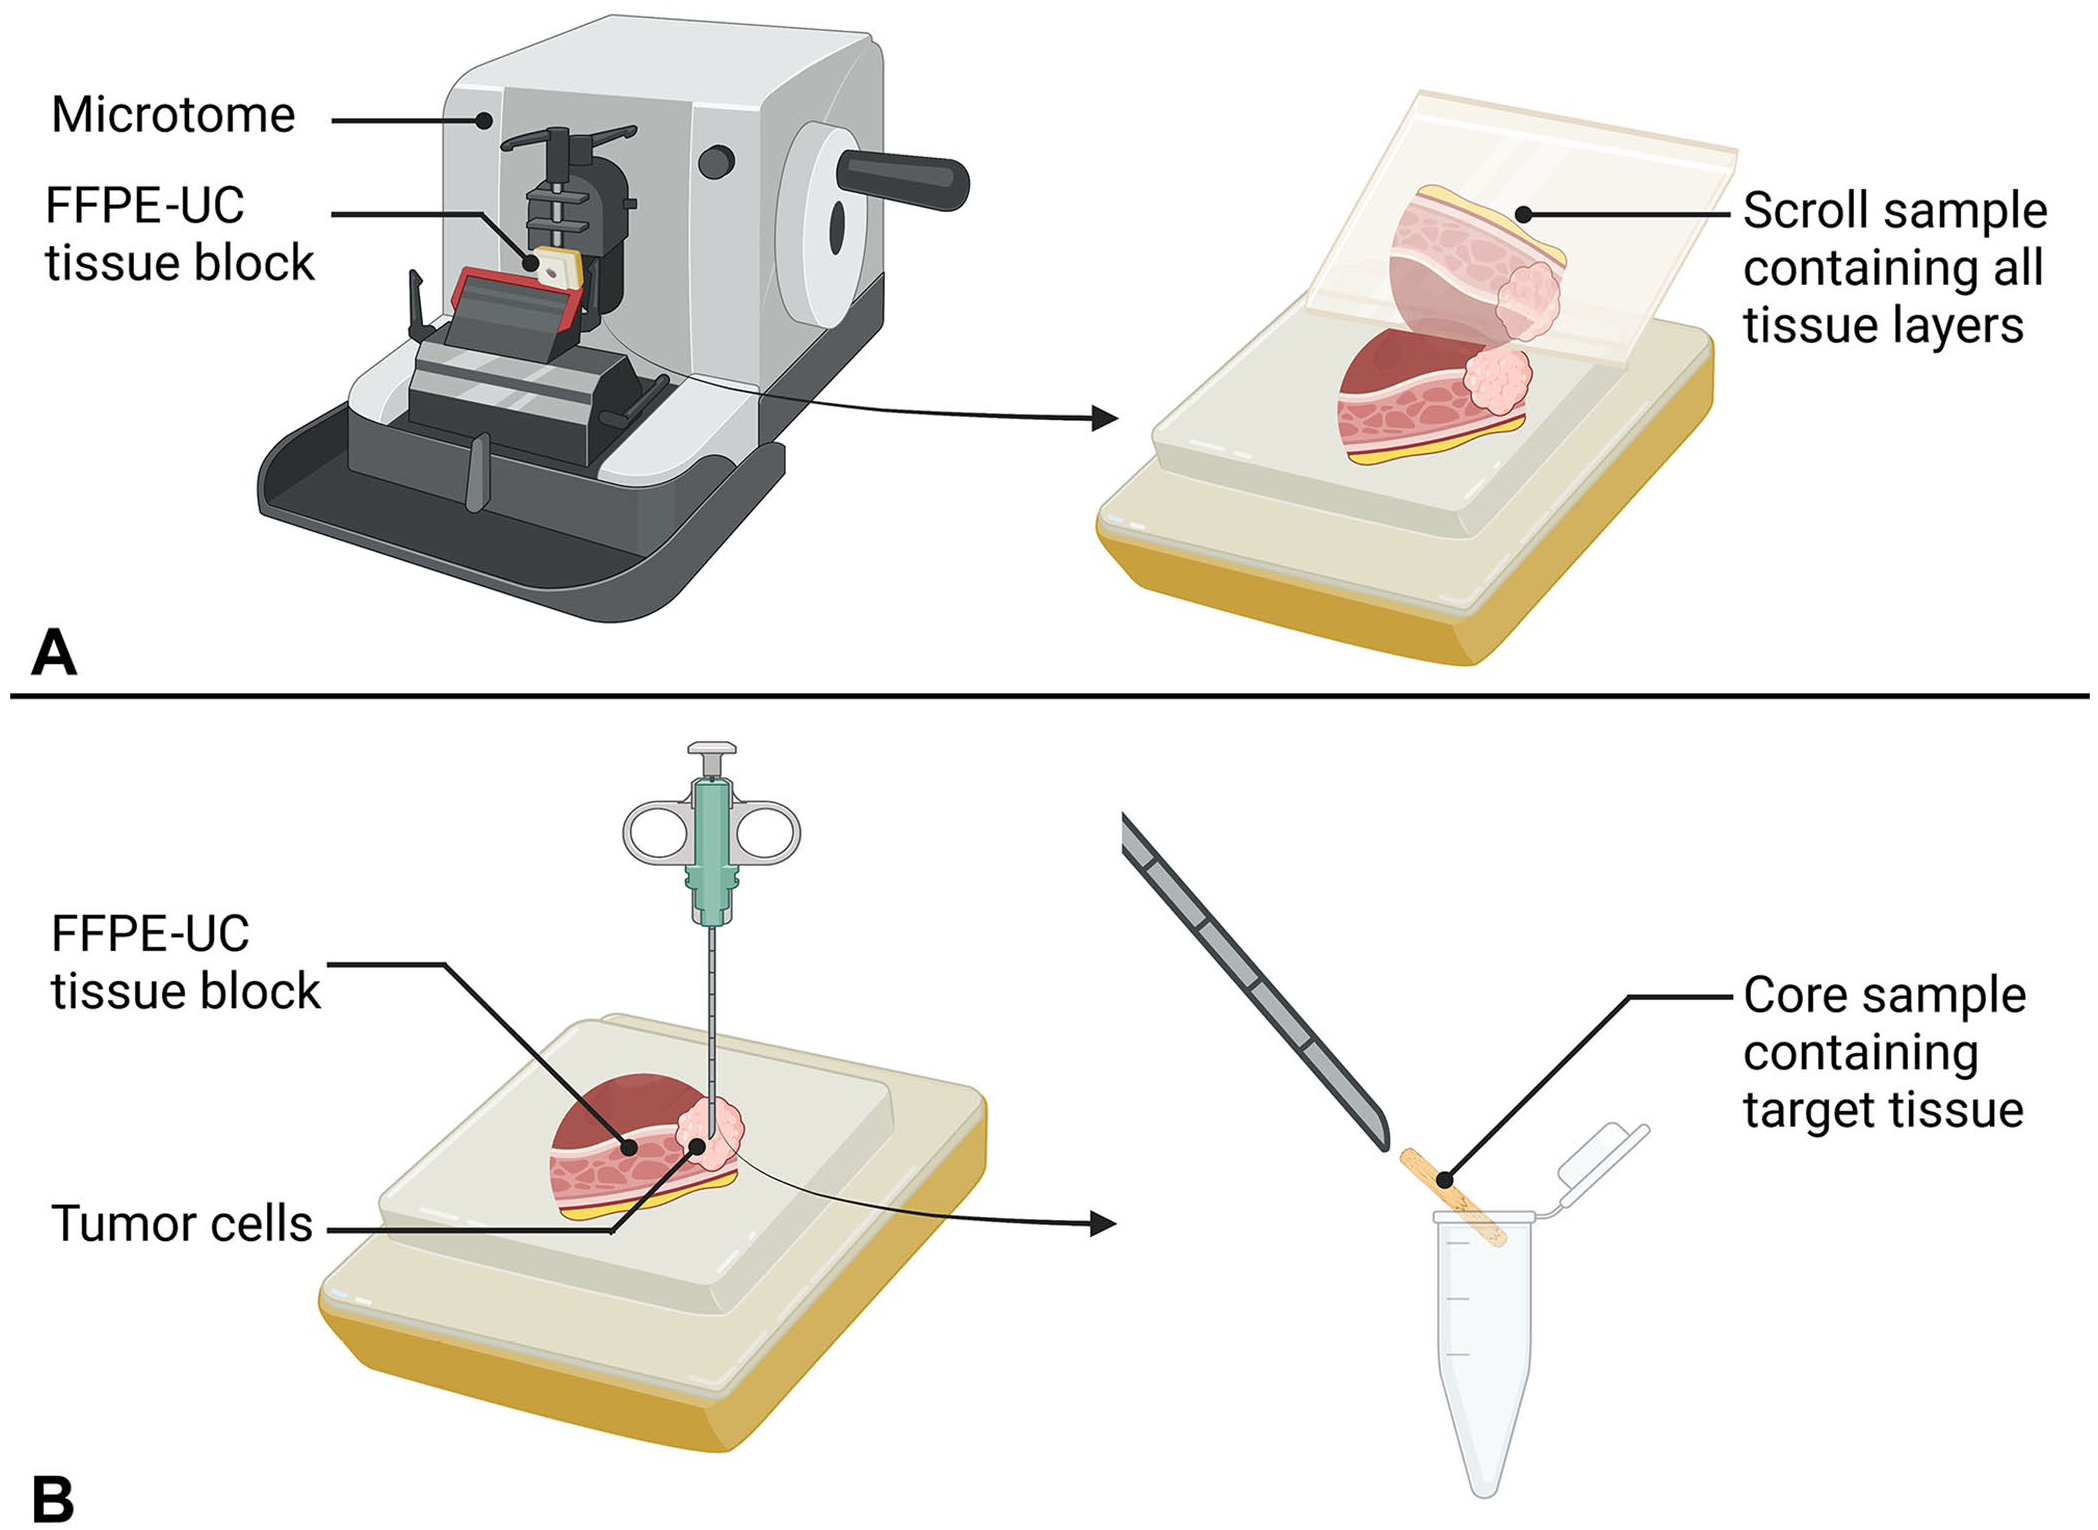
Production of scroll and core tissue samples.
We quantified the influence of sample types and handling on the expression of miRNAs in canine bladder tissue, UC tissue samples, and urine. We aimed to investigate the stability of miRNA in canine FFPE tissue samples and urine samples and to develop a method for FFPE tissue processing that would minimize the confounding factors caused by including surrounding tissues in miRNA extraction protocols.
Materials and methods
Sample selection and preparation
FFPE tissue, the effect of surrounding tissue
All urinary bladder tissue samples used were excess samples from patients undergoing routine veterinary care for their condition after the clients’ approval. Samples were collected as part of the patient’s care as recommended by the veterinarian. Bladder tissue was collected from 4 dogs at autopsy, 3 with UC and 1 with no bladder lesions, and placed immediately in formalin. The diagnoses were confirmed by histopathology by a coauthor pathologist (J.A. Ramos-Vara). Tissue scrolls from each FFPE section were obtained with a thickness of 10–15 μm (Fig. 2A).
We used a modified FFPE tissue core sampling protocol. 47 Briefly, FFPE tissue was cored using an Illinois bone marrow needle. The needle was cleaned by submerging it 5 times in bleach (100%), then rinsing it 5 times in absolute ethanol, and then submerging it 5 times in DNA/RNA-free water (Qiagen). The desired core area was selected by identifying the corresponding H&E-stained slide and marking the block. The needle was inserted into the marked area and rotated 90° with downward force until complete penetration of the block was achieved. The needle was then removed from the block, and the sample was released from the needle using the stylet into a 1.5-mL microcentrifuge tube (Sigma-Aldrich) for further processing. One core from the bladder epithelial layer (UC or healthy) and one core from the muscularis layer were obtained from each sample.
FFPE tissue, the effect of fixation time
Bladder tissue containing UC was also harvested from a separate single dog during autopsy. Four tumor sections were immediately placed in 10% neutral-buffered formalin for section-coring and further miRNA extraction and reverse-transcription quantitative real-time PCR (RT-qPCR). The presence of UC was confirmed by histopathology (J.A. Ramos-Vara). Sections were removed from formalin for paraffin-embedding after 1, 8, 15, and 22 d. FFPE tissue blocks were stored at room temperature (18–25°C) away from UV light until miRNA extraction. A tissue core of the UC was obtained using the coring method described above.
Stability of miRNAs in urine
Urine was collected from a healthy 6-y-old castrated male mixed-breed dog by free catch on 4 occasions, 1 collection per occasion (samples 1–4). The urinalysis was performed by an ACVP board-certified clinical pathologist (M.S. Varvil), and we used the excess sample. This patient with inactive sediment (sediment free of cells, crystals, casts, or bacteria) was chosen for consistency across samples and to reduce the potential for additional confounding factors, given that cells within the urine could introduce variation within the samples. Collected urine samples were centrifuged at 450 × g for 5 min and excess supernatant decanted; 1 mL of the centrifuged urine from each collection was then aliquoted into each of twenty-five 1.5-mL microcentrifuge tubes within 1 h of collection. MiRNA was extracted from one aliquot immediately. One aliquot of urine sample 1 that was processed immediately was not utilized because of a compromise of the sample during processing; only one sample from collection 4 was processed (an immediate sample). Six aliquots were kept at room temperature; 6 were stored at 4°C, 6 at −20°C, and 6 at −80°C. MiRNA was extracted from an aliquot stored at each temperature after 4, 8, 24, and 48 h, and 1 and 2 wk. After miRNA extraction, urine samples were randomized and anonymized, and 55 of 76 samples representing each collection and storage condition were further processed to quantify miRNA detection via qPCR.
Biomarker selection
For experiments using FFPE tissue, the expression of miRNA genes reportedly altered in UC, including miR-181a, 32 miR-143,2,20,54 miR-152,27,60,61 and miR-214, 59 were utilized in the qPCR procedure, in addition to reference gene miR-1842. 54 For miRNA stability experiments in urine in different storage conditions, we measured miRNAs that were expected to be expressed consistently within the urothelium: namely miR-30c 56 and miR-1842. 53
miRNA extraction
FFPE tissue
MiRNA was extracted (miRNeasy FFPE kit; Qiagen) following the manufacturer’s protocol, except for the addition of 3.5 µL of the exogenous control (cel-miR-39-3p spike-in template; Qiagen) before adding proteinase K. MiRNAs were quantified using fluorometry (Qubit microRNA assay kit; ThermoFisher Scientific).
Urine
MiRNA from urine samples was extracted (Quick-DNA/RNA Microprep plus kit; Zymo Research) following the manufacturer’s recommendations, using 200 µL of urine and adding 3.5 µL of the spike-in exogenous control (cel-miR-39) after the DNA/RNA lysis buffer step. MiRNA was quantified (Qubit fluorometer; ThermoFisher Scientific).
Reverse transcription
FFPE tissue, the effect of surrounding tissue
For cores and scrolls, reverse transcription to cDNA was performed (miScript II RT kit; Qiagen), following the recommended protocol, with a final RNA product of 50 ng/μL. A gradient thermocycler (PTC-200; Marshall Scientific) was used and set for 60 min at 37°C, followed by 5 min at 95°C, and returned to 4°C. Samples were stored at −20°C until the RT-qPCR assay was performed.
FFPE tissue, the effect of fixation time
To identify whether fixation time in formalin affects miRNA detection in FFPE tissues, miRNA was extracted (miRCURY LNA reverse transcriptase kit; Qiagen), following the manufacturer’s protocol, with a final product of 10 ng/µL. A gradient thermocycler (PTC-200) was used and set for 60 min at 42°C, followed by 5 min at 95°C, and held at 4°C until the RT-qPCR assay was performed.
Stability of miRNAs in urine
MiRNA was extracted from urine samples (miRCURY LNA reverse transcriptase kit), following the manufacturer’s protocol, with a final concentration of 10 ng/μL, as described above.
RT-qPCR
miR-30c and miR-1842 were chosen as reference genes using the NormFinder Algorithim1,8,43 for canine urothelial tissues (healthy and neoplastic) in urine and FFPE tissue samples. 53 The clinical or diagnostically relevant miRNA genes in human UC, miR-143, miR-152, miR-181a, and miR-214, were selected. Three of the selected miRNAs, miR-143, miR-181a, and miR-214, have been reported to be differentially expressed in invasive canine UC. 53
Expression of miR-143, miR-181a, miR-152, miR-214, and RNU6B (Qiagen) in FFPE tissues was measured via qPCR (miScript SYBR green PCR kit; Qiagen). All samples were run in triplicate. miR-1842 was used as an endogenous control (reference gene) for expression analysis. miR-30c and miR-1842 in urine were measured via qPCR (miRCURY LNA miRNA SYBR green PCR kit; Qiagen), following the manufacturer’s instructions, with samples run in duplicate. The same thermocycler (QuantStudio 3 real-time PCR system; ThermoFisher Scientific) was used for all RT-qPCR assays.
Statistical analysis
All statistical analyses were performed using untransformed quantification cycle (Cq) values as the dependent variable; Cq values are inversely related to miRNA gene expression (i.e., lower Cq values indicate higher miRNA gene expression levels). For statistical analysis of core versus scroll effects on miRNA detection, a linear-mixed model using individual sections as random blocks was used to determine significant differences between expression in the 4 miRNAs and 1 reference (miR-1842) in the samples of tissue scrolls, tissue cores consisting of UC tumor, and tissue cores consisting of the muscularis layer. Pairwise differences between the 3 sample types (scrolls, UC tumor core, muscularis core) were assessed and stratified by each miRNA following the observation of significant interaction effects between multiple miRNAs and sample type.
A type III ANCOVA test was performed in the formalin-fixation experiment, including miRNA, time, and their interaction. Time was considered a continuous covariate. Piecewise (segmented) regression with a single breakpoint stratified by miRNA was performed in the follow-up.
For urine, the data were first analyzed by a general linear model, including miRNA, time, temperature, and their interaction blocked on the experimental batch (storage conditions), followed by the same analysis stratified by collection. Time and temperature were considered continuous covariates.
Results
Subjectively, the coring procedure to isolate the targeted tissue (either normal urothelium, muscularis layer, or UC) was simple, through comparison of the FFPE tissue block to the H&E-stained slide. For the FFPE tissue, we found a significant difference (p < 0.05) between the detection of miRNA and RNU6B as a group (miR-143, miR-152, miR-181a, miR-1842, miR-214, and RNU6B) and the sample type (Table 1). When quantifying each miRNA individually, significant differences were observed for miR-181a and RNU6B comparing the urothelial layer core with the muscularis layer and urothelial layer cores with scrolls (Table 2). No statistical significance was observed for miR-143, miR-152, miR-214, or miR-1842 comparing all sample types, or for miR-181a or RNUB6 comparing the muscularis core to the scroll.
Mixed-effects model analysis (Kenward–Roger denominator degrees of freedom) of microRNA urothelial carcinoma cores, tissue scrolls, and muscularis layer cores.
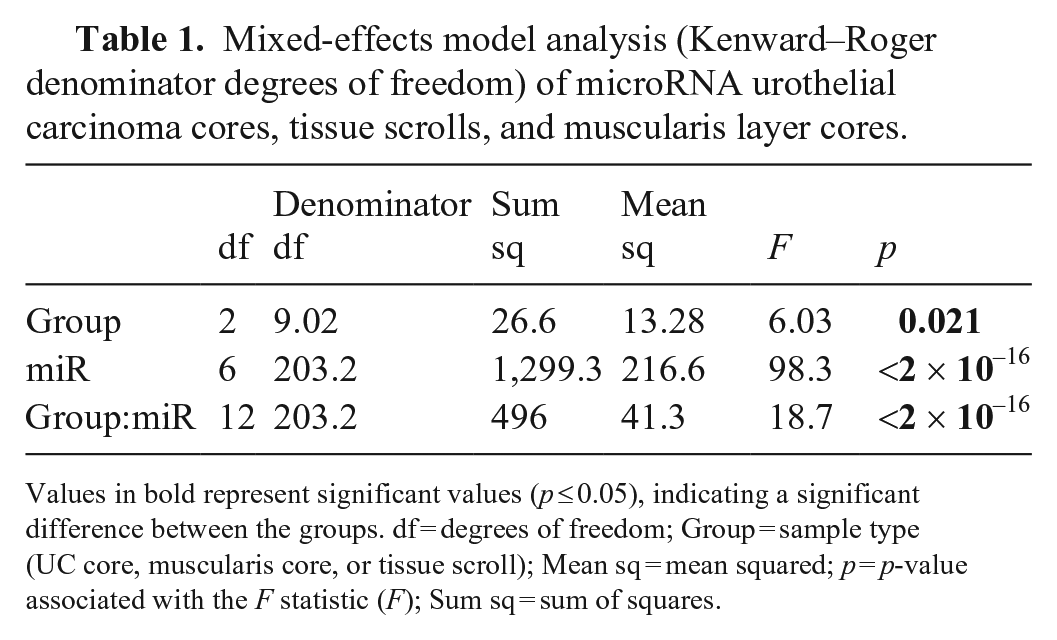
Values in bold represent significant values (p ≤ 0.05), indicating a significant difference between the groups. df = degrees of freedom; Group = sample type (UC core, muscularis core, or tissue scroll); Mean sq = mean squared; p = p-value associated with the F statistic (F); Sum sq = sum of squares.
Pairwise differences between groups (UC core, muscularis core, and tissue scrolls) by the Tukey method with Kenward–Roger degrees of freedom stratified by microRNA of 3 formalin-fixed, paraffin-embedded tumors indicating differences between individual miRNA Cq values of the different sample types.
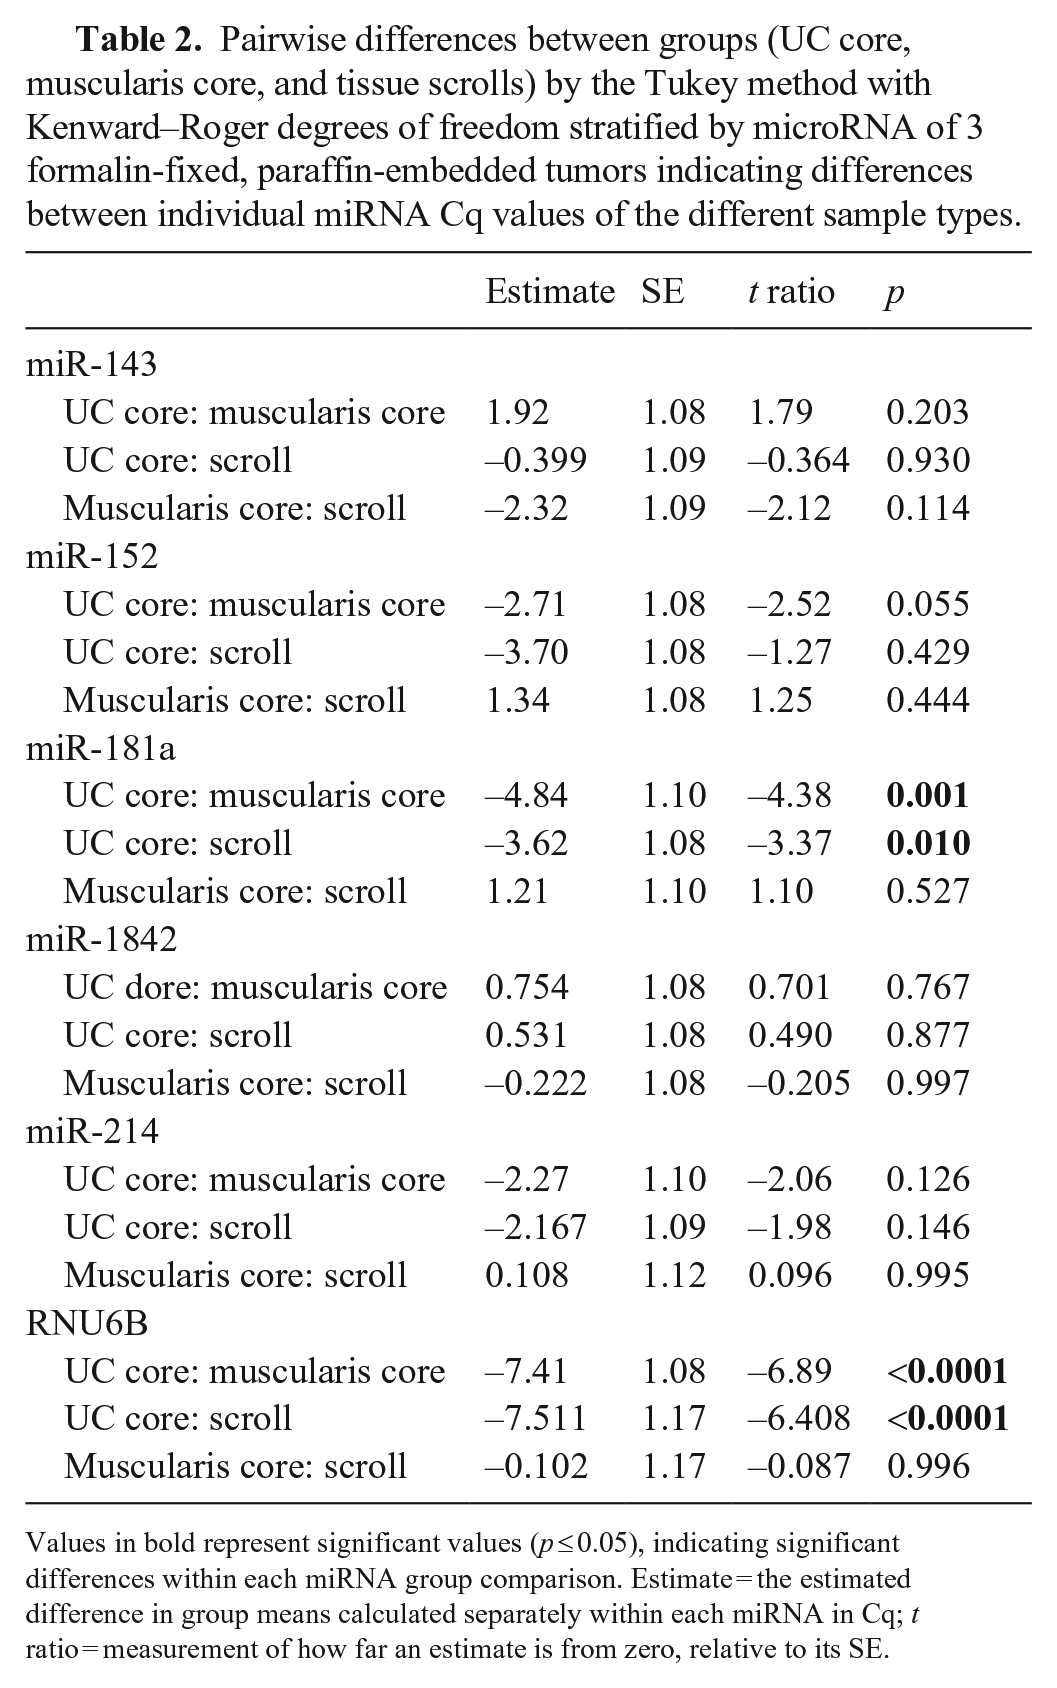
Values in bold represent significant values (p ≤ 0.05), indicating significant differences within each miRNA group comparison. Estimate = the estimated difference in group means calculated separately within each miRNA in Cq; t ratio = measurement of how far an estimate is from zero, relative to its SE.
Analysis of the temporal stability of miRNA in formalin suggests significant main effects of miRNA Cq values decreasing over time (p = 0.037; Table 3); however, miRNA Cq values decreased initially and then stabilized over time (Fig. 3). Individually, we found a significant effect for miR-39 (p = 0.04); we did not find the same long-term effect of time for either miR-30C or miR-1842 (Fig. 3; Suppl. Table 1).
Type III ANOVA of all microRNA (miR30c, miR39, miR1842) expression in a single urothelial carcinoma stored in formalin for 1, 8, 15, and 22 d before paraffin embedding and further processing identifying changes in expression as a result of time spent in formalin.
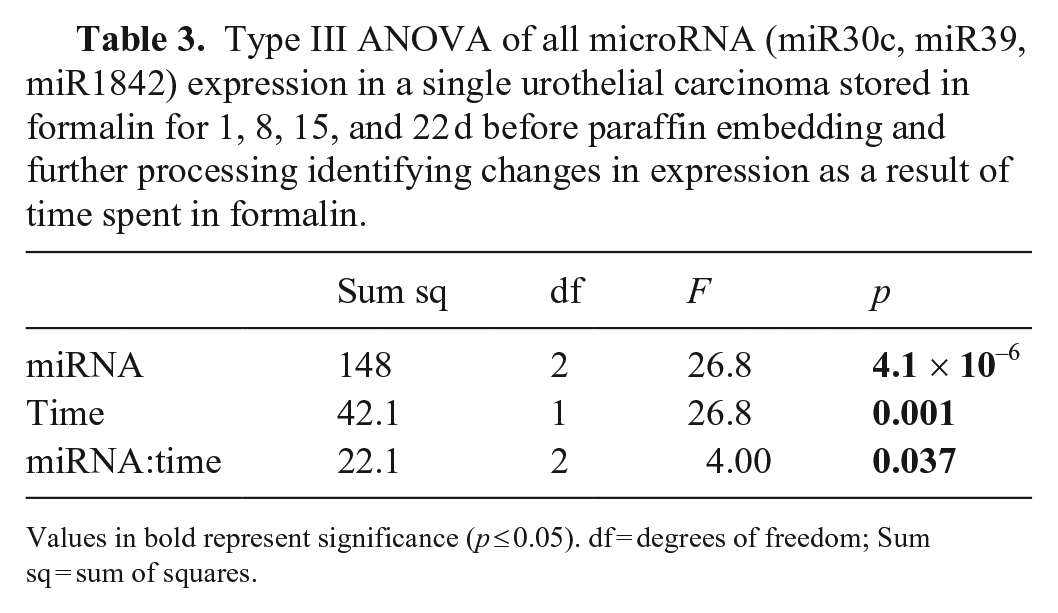
Values in bold represent significance (p ≤ 0.05). df = degrees of freedom; Sum sq = sum of squares.
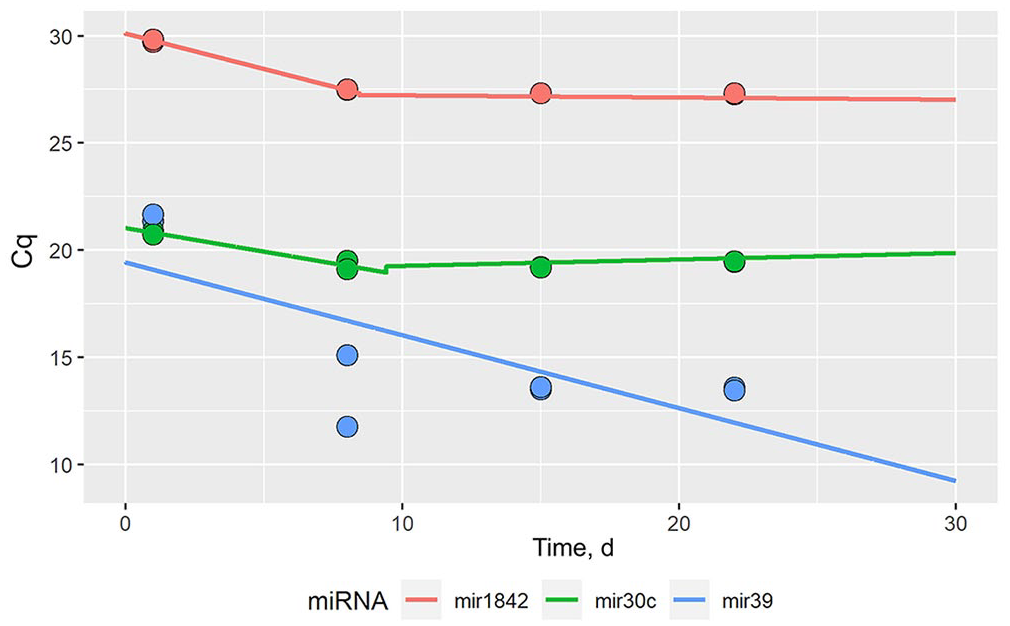
Piecewise regression of microRNA in formalin-fixed tissues used to illustrate the initial effect of time on the miRNA Cq values followed by stabilization over time. The colored lines are the piecewise regression lines for each miRNA, and the dots represent the means of the Cq values; each sample was tested in triplicate. MiRNA Cq values decreased initially and then stabilized over time (Suppl. Table 1).
The urine samples were acellular; thus, the miRNAs that we quantified were from microvesicles or free miRNAs in the urine.7,8,39 Effects of time and temperature on the stability of miR-30c and miR-39 in urine were investigated separately (Suppl. Table 2), with no significant differences found. Inconsistency exists among collections 1–4 for both miRNAs (Table 4), likely representing normal biologic variation within the healthy dog. When each sample aliquot was analyzed individually, although significant changes were seen when considering only time in collection 3, we found no significant differences when evaluating both time and temperature together, indicating no significant effect of time or temperature on miRNA detection and Cq values (Table 5).
ANCOVA analysis of microRNA (miR-30c, miR-39) Cq values in urine of a healthy dog regarding time, temperature, and individual collection.
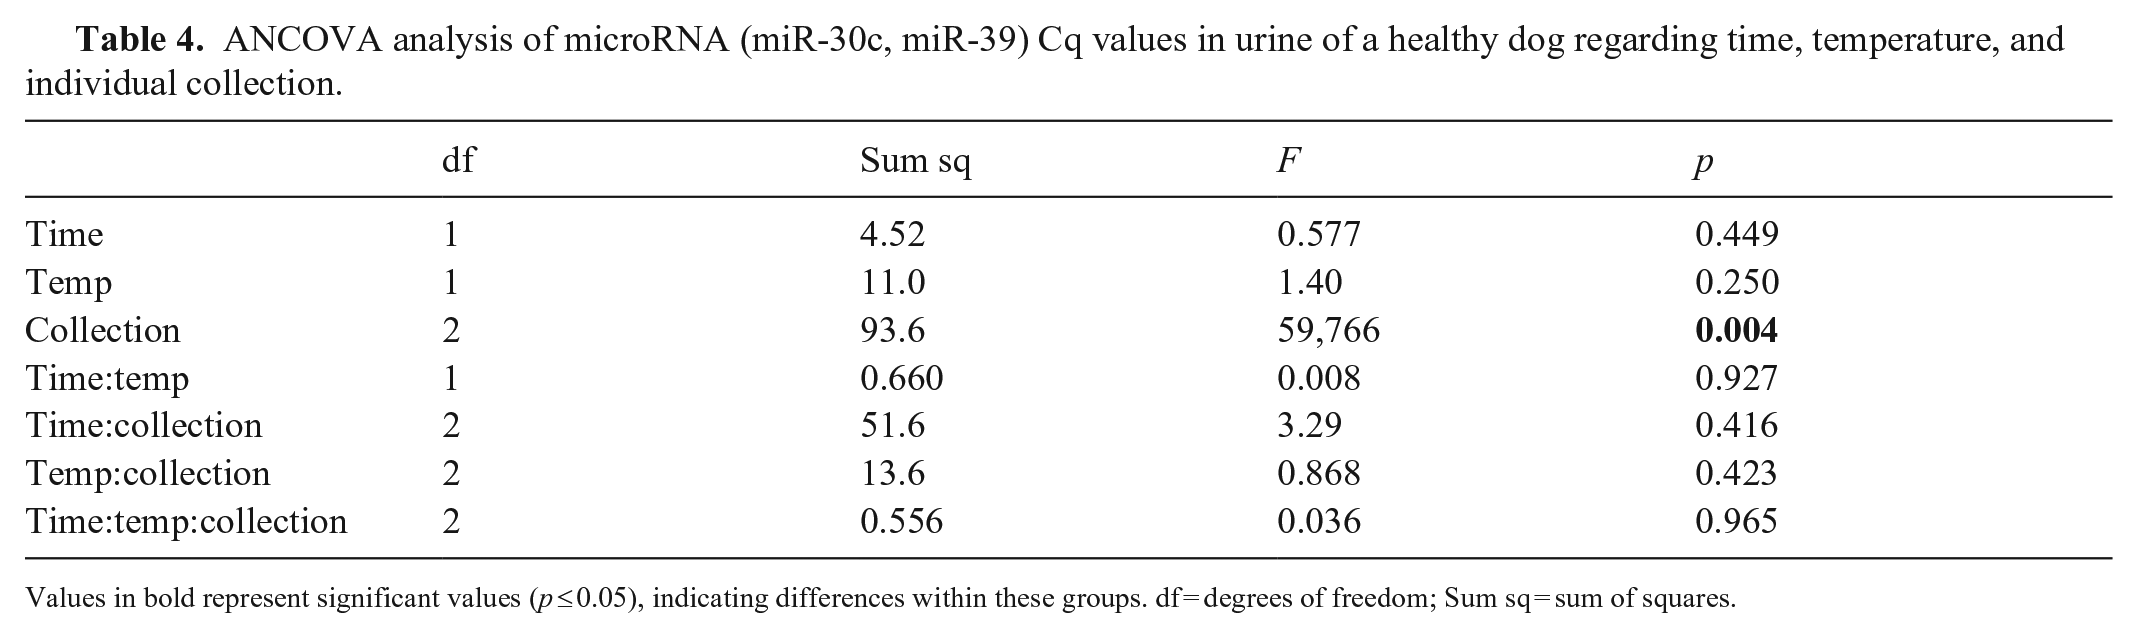
Values in bold represent significant values (p ≤ 0.05), indicating differences within these groups. df = degrees of freedom; Sum sq = sum of squares.
Analysis by t-test of coefficients on the effect of storage time and temperature on urine samples in each individual collection for miR-30c.
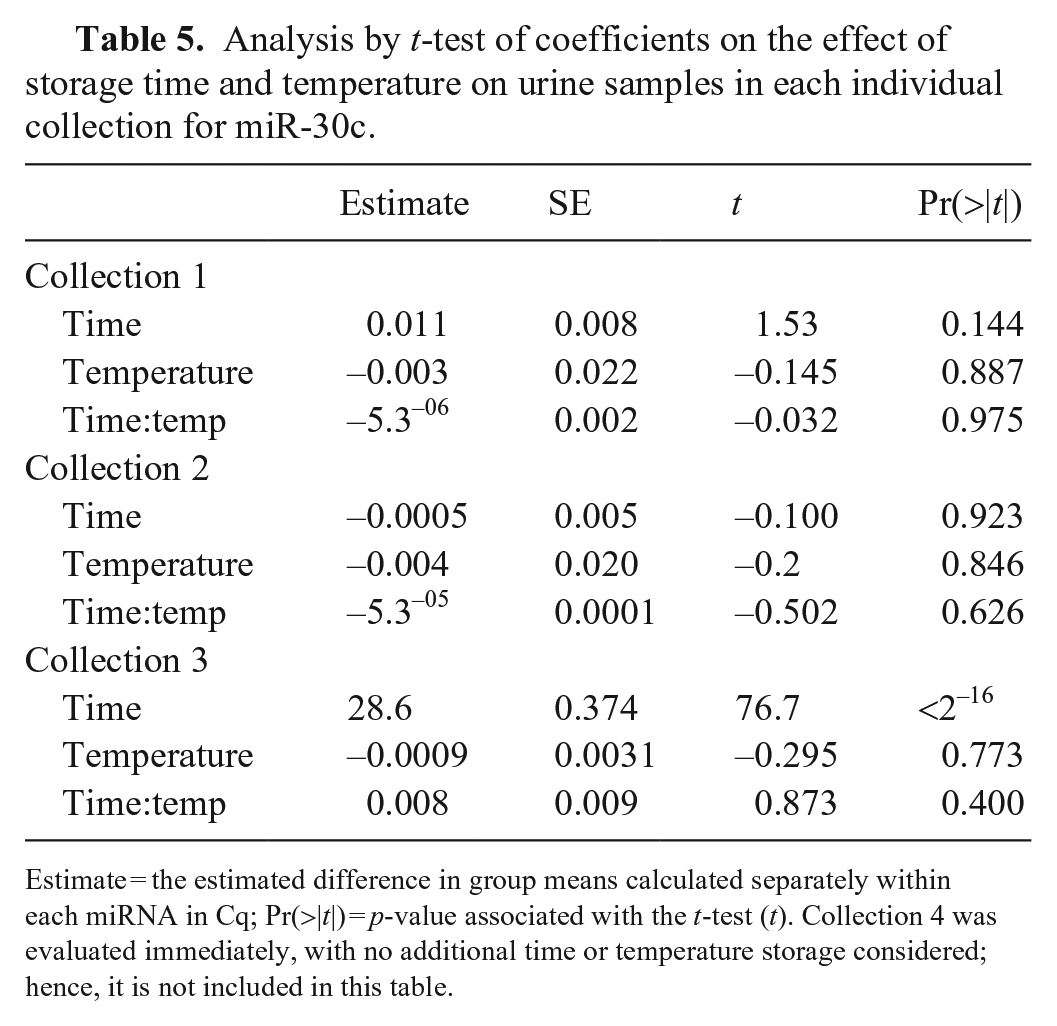
Estimate = the estimated difference in group means calculated separately within each miRNA in Cq; Pr(>|t|) = p-value associated with the t-test (t). Collection 4 was evaluated immediately, with no additional time or temperature storage considered; hence, it is not included in this table.
Discussion
We found that using scrolls for miRNA extraction, which included surrounding tissues (i.e., muscularis layer), increased miRNA Cq values, which may result in misleading miRNA Cq results compared to tissue core sampling, which targets the tissue of interest (i.e., urothelium). We found a significant difference in miRNA detection overall comparing the UC core sample to the scroll sample. Additionally, we found a difference in the Cq values comparing the urothelial layer core sample to the muscularis layer core and the scroll sample for both miR-181a and RNUB6. Given that RNUB6 is often used as a reference gene because of its stable nature, 46 the variability of RNUB6 expression that we found across samples raises concern for outcomes of studies quantifying miRNA through using RNUB6 as a reference gene. Additionally, the miR-1842 Cq values did not change statistically significantly (p = 0.76) across sample types, indicating insufficient evidence to suggest a difference and, thus, the appropriate use of miR-1842 as an endogenous control. Our results suggest that the sample type should target the specific tissue investigated for accurate miRNA quantification studies.
Although miRNAs are considered to be stable in FFPE tissues for long periods, 47 tissue storage can have deleterious effects on nucleic acids.4,25 Also, although FFPE tissue has been shown to be acceptable for miRNA quantification,11,35,51,52,58 the fixation time in formalin is often neglected. We noted an initial decrease in miRNA Cq values for miR30c, miR-1842, and exogenous control miR39 that stabilized over time. The initial decrease in miRNA Cq values noted may represent systematic error, and we are uncertain if this decrease is biologically meaningful. Despite the initial significant difference noted between the miRNA Cq values at baseline (1 d in formalin), piecewise regression with a single breakpoint stratified by miRNA failed to identify the same long-term effect of time in formalin for either miR-30C or miR-1842. Although our finding supports the stability of miRNA in formalin reported in the literature,21,23 testing of additional samples is needed to confirm the consistency of our finding.
These statistically significant differences in Cq values found between urine samples from the different collection dates may be the result of this dog’s normal biological variation in miRNA within the samples themselves depending on the collection date, time, and patient status, 9 which may raise concerns about reliable quantification of miRNA in acellular urine samples; more patients are needed to confirm this finding. Further investigation into miRNA stability in urine with active sediments (containing epithelial cells, urothelial cells, inflammatory cells, and/or bacteria) is warranted to confirm that miRNA detection in urine is similar in patients with lower urinary tract disease.
Limitations of our pilot study include the low number of samples and patients evaluated. More specimens will need to be evaluated in all groups (UC cores, muscularis cores, scrolls) to confirm our findings on a larger scale.
Supplemental Material
sj-pdf-1-vdi-10.1177_10406387231211908 – Supplemental material for Canine urothelial carcinoma: a pilot study of microRNA detection in formalin-fixed, paraffin-embedded tissue samples and in normal urine
Supplemental material, sj-pdf-1-vdi-10.1177_10406387231211908 for Canine urothelial carcinoma: a pilot study of microRNA detection in formalin-fixed, paraffin-embedded tissue samples and in normal urine by Mara S. Varvil, Samuel L. Clark, Taylor W. Bailey, José A. Ramos-Vara and Andrea Pires dos Santos in Journal of Veterinary Diagnostic Investigation
Footnotes
Acknowledgements
We thank the Purdue University Animal Disease Diagnostic Laboratory and the Purdue University Veterinary Hospital Clinical Pathology laboratories for their work in providing excess samples for this study.
Declaration of conflicting interests
The authors declared no potential conflicts of interest with respect to the research, authorship, and/or publication of this article.
Funding
Our project was funded by Andrea Pires dos Santos’s laboratory with no external funding to declare.
Supplemental material
Supplemental material for this article is available online.
References
Supplementary Material
Please find the following supplemental material available below.
For Open Access articles published under a Creative Commons License, all supplemental material carries the same license as the article it is associated with.
For non-Open Access articles published, all supplemental material carries a non-exclusive license, and permission requests for re-use of supplemental material or any part of supplemental material shall be sent directly to the copyright owner as specified in the copyright notice associated with the article.