
Abstract
Veterinary glucometers should be correctly coded for the patient species; however, coding errors occur in clinical settings and the impact of such errors has not been characterized. We compared glucose concentrations in 127 canine and 37 feline samples using both canine and feline settings on a veterinary glucometer (AlphaTrak; Zoetis). All samples were measured first on the canine setting and then measured using the feline setting. Glucose concentration was also measured using a central laboratory biochemical analyzer (Cobas c311; Roche). Three data comparisons for each species were investigated: incorrectly coded glucometer vs. correctly coded glucometer, correctly coded glucometer vs. Cobas c311, and incorrectly coded glucometer vs. Cobas c311. For each comparison, the following analyses were conducted: Spearman rank correlation coefficient, Bland–Altman difference plot analysis, mountain plot analysis, and Deming regression. For clinical context, Clarke error grids were constructed. There was high positive correlation for all comparisons with both species. For all comparisons, mean difference was low (−0.7 to 0.5 mmol/L for canine samples, 1.0–2.0 mmol/L for feline samples). Incorrect glucometer coding resulted in proportional bias for canine samples and positive constant bias for feline samples, and individual differences could be large (−4.44 mmol/L for one dog, 6.16 mmol/L for one cat). Although the glucometer should be used per the manufacturer’s recommendation, coding errors are unlikely to have severe adverse clinical consequences for most patients based on error grid analysis.
Glucometers, which are small, portable, and designed for use with whole blood samples, are a convenient instrument for measuring glucose concentrations. They are commonly used in veterinary medicine given that many diseases are associated with hypo- or hyperglycemia. Glucometers can be used in routine or emergency hospital settings, as well as by owners at home. Glucometers are fast, simple to use, and require only a small sample volume, reporting either uncorrected whole blood glucose or plasma glucose equivalent, depending on the glucometer type. 12 Accuracy of both veterinary and human glucometers has been evaluated in dogs and cats, and conflicting results are reported regarding impact of meter type on treatment decisions. Several investigators report that treatment decisions would likely be unaltered if a human glucometer was used8,9,17,19,20,23,31; however, others report substantial differences in accuracy, which could lead to altered treatment decisions.3,5,6,11,18,29 Overall, veterinary glucometers may be more accurate than human glucometers for measurement of glucose in dogs and cats,5,19,20,28,35 although findings have varied.5,18,20,33
The AlphaTrak 2 veterinary glucometer (Zoetis) reports plasma glucose equivalent and requires correct coding of the meter for the patient species. Species differences in the proportion of plasma and intra-erythrocytic glucose exist, and proprietary species-specific calculations are used by the glucometer to generate the reported plasma glucose equivalent concentration.7,12,36 We retrieved no reports of the clinical impact of selecting the wrong species codes in a PubMed search. If the glucometer is coded incorrectly, the practice in our hospital is to take another sample and measure the glucose using the correct species setting to ensure accuracy. Repeat measurement may require additional sampling, leading to patient discomfort. Multiple venipunctures may also lead to more stress, which can increase the blood glucose concentration (e.g., stress hyperglycemia in cats).
We characterized differences in reported blood glucose concentration for cats and dogs when an AlphaTrak 2 glucometer was correctly and incorrectly coded for the species. Our hypothesis was that clinically impactful measurement bias would occur with incorrect glucometer settings.
Materials and methods
Animals
Convenience blood samples were obtained from client-owned dogs and cats presented to the Auburn University (AU) College of Veterinary Medicine (Auburn, AL, USA) for routine standard clinical patient care, from November 2018 to April 2019. Signalment and reason for hospital visit were not considered. Blood used was the residual specimen remaining after diagnostic testing was completed, and specific client consent and approval by the Clinical Research Review Committee or an Institutional Animal Care and Use Committee were not required.
A power calculation was performed using a 2-sided paired t-test to determine the number of samples necessary to detect a difference of at least 0.8 mmol/L between glucose concentrations determined by the biochemical analyzer and by the veterinary glucometer. The calculation was based on the x̄ ± SD glucose concentration used to establish the RI for the biochemical analyzer. Assumptions made were a power of 0.8, type 1 error rate of 0.05, correlation of 0.7, and a ratio of 1 between the veterinary glucometer and the biochemical analyzer results. The minimum sample size was determined to be 44 each of dogs and cats. Because these were convenience samples, samples were continuously analyzed while the study was ongoing. Additional convenience samples were acquired later (March 2022) from 2 dogs and 2 cats to generate repeatability data.
Samples
Samples were drawn from the jugular, cephalic, lateral saphenous, or medial saphenous vein depending on the size and temperament of the patient and the required volume of blood. Immediately following each blood draw, blood was placed in a microtainer (Beckman Coulter) containing lithium heparin and submitted promptly to the AU Clinical Pathology Laboratory. The laboratory centrifuged all samples and harvested the plasma within 30 min of submission. Sufficient blood volume was left in the syringe to measure glucose concentrations with the glucometer; concentrations were measured by glucometer within 5 min of sample collection.
Glucose measurements
In the laboratory, a biochemical analyzer (Cobas c311; Roche) quantified the glucose concentration via hexokinase and a photometric method to measure glucose concentration in a linear range of 0.1–41.7 mmol/L. RIs established by the laboratory for dogs were 4.2–6.4 mmol/L and for cats 3.2–6.4 mmol/L. The concentration obtained from the biochemical analyzer was used as the comparative method and representation of patient “true” glucose concentration.
A single unit of a veterinary glucometer (AlphaTrak 2; Zoetis) was designated for our study and used for all measurements. The glucometer uses glucose dehydrogenase and a coulometric electrochemical method to measure glucose concentration in a linear range of 1.1–41.7 mmol/L. Immediately following each blood draw (regardless of patient species), glucose concentration was measured using the canine glucometer setting, followed directly by glucose measurement using the feline glucometer setting. In other words, for canine patients, measurements were made in the order of correctly coded meter followed by incorrectly coded meter, and vice versa for feline patients. The glucometer was used per the manufacturer’s instructions except for miscoding the species. Stable performance was assured according to the manufacturer’s recommendations by using the provided control solution when a new vial of test strips was opened. Both test strips needed for an individual dog’s or cat’s paired measurements came from a single vial of test strips; however, over the entire study, multiple test strip lots were used. Any remaining sample was used to fill heparinized hematocrit tubes, which were centrifuged within 10 min of collection (StatSpin, StatSpin Technologies; 13,700 × g for 2 min), and a PCV was measured immediately after centrifugation using a reading device calibrated for the centrifuge used. Age, sex, breed, weight, time, and date of blood sample, and presenting complaint were recorded for each patient. For dogs, the RI for PCV was 0.39–0.59 L/L, with anemia defined as a PCV < 0.39 L/L, and hemoconcentration defined as a PCV > 0.59 L/L. For cats, the RI for PCV was 0.30–0.45 L/L, with anemia defined as a PCV < 0.30 L/L, and hemoconcentration defined as a PCV > 0.45 L/L.
Precision
The average CV of the glucometer for dogs is 5.2% per the manufacturer. 38 Repeatability data were assessed using separate convenience samples from 2 dogs and 2 cats to determine a precision profile for the glucometer. These data were not used in the method-comparison analysis. Ten replicates of each sample were measured as one run by the same operator (L.W. Peña), using one lot of glucometer test strips and the correct meter coding.
Data analysis
Glucometer results were reported in mg/dL and converted to mmol/L using the equation: mmol/L = mg/dL × 0.0555. Results of all calculations, including statistical calculations, were rounded to 3 significant figures, the number appropriate for the underlying data. Data analysis was performed using MedCalc v.20.027 (MedCalc Software), Excel 2019 (Microsoft), Python 3.7 (https://www.python.org), and SigmaPlot 14.5 (Systat).
Minimum, maximum, mean, and median were computed for each dataset (Cobas c311, correctly coded glucometer, incorrectly coded glucometer) and species (canine, feline). Normality was assessed using the Kolmogorov–Smirnov test.
For precision, repeatability study data (glucometer) or historical quality control (QC) data (Cobas c311) were used to calculate x̄, SD (in mmol/L), and CV (%). CV was calculated using the formula: CV = (SD/x̄) × 100%.
Method-comparison analysis evaluated the following 3 comparisons for each species (presented as test method vs. comparative method): incorrectly coded glucometer vs. correctly coded glucometer, correctly coded glucometer vs. Cobas c311, and incorrectly coded glucometer vs. Cobas c311. For each comparison, the following analyses were conducted: Spearman rank correlation coefficient, Bland–Altman difference plot analysis, mountain plot analysis, and Deming regression. Correlation coefficients were interpreted as: rs of 0.90–1.0 = very high correlation, 0.70–0.89 = high correlation, 0.50–0.69 = moderate correlation, 0.30–0.49 = low correlation, and 0–0.29 = little, if any, correlation. 32 For Bland–Altman and mountain plot analysis, presence of bias was assessed subjectively by inspecting the scatter of differences on each plot. Because method-comparison study measurements were performed singly (i.e., not in replicate), Deming regression analysis required CV inputs. For Deming regression analysis, constant bias was identified if the 95% CI for the y-intercept did not include the value zero, and proportional bias was identified if the 95% CI for the slope did not include the value 1.0.
To help place identified bias in a clinical context, Clarke error grids were constructed for each comparison and species. Errors grid zones were defined as: zone A = measurements clinically equivalent; zone B = erroneous measurement leads to benign or no difference in treatment; zone C = erroneous measurement could result in excessive or unnecessary treatment; zone D = risk of failure to treat; and zone E = treatment opposite to that needed for true blood glucose concentration.
Finally, comparability of paired results for each comparison was assessed in light of an analytical quality goal. The goal used was allowable total error (TEa), based on the American Society for Veterinary Clinical Pathology (ASVCP) recommendation of TEa ± 20% for normal-to-increased glucose concentration; results were considered comparable if results from the test method fell within the interval “target ± 20%.” 13 ASVCP recommends TEa ± 10% for low glucose concentration, 13 but we did not use that quality goal given that so few samples were hypoglycemic.
Although the impact of PCV on results was not a focus of our study, the proportion of patients having PCV below, within, and above RIs was recorded. The AlphaTrak 2 is designed for use with sample PCVs of 0.15–0.65 L/L (15–65%). 37 Only canine groups were of sufficient size for statistical comparison. A Mann–Whitney test was used to compare median difference between results from the incorrectly and correctly coded glucometer for anemic dogs versus dogs with normal PCV. Significance was set as p ≤ 0.05.
Results
Animals
We included 127 dogs and 37 cats in our study. For canine patients, mean age was 8 y (0.33–17 y), and mean weight was 15.8 kg (1.8–50 kg). One dog did not have a weight recorded. Seventy-three dogs were female (71 spayed, 2 intact), and 54 dogs were male (42 castrated, 12 intact). For feline patients, mean age was 11 y (4–17 y), and mean weight was 4.6 kg (2.8–7.1 kg). Twenty-one cats were female (all spayed), and 16 cats were male (all castrated). Dog breeds varied, with the most common being mixed-breed dogs (n = 13, 10%), Labrador Retrievers (n = 12, 9%), Chihuahuas (n = 9, 7%), and Yorkshire Terriers (n = 9, 7%). Cat breeds were less varied with the most common being domestic shorthaired (n = 30, 80%).
Precision
One canine sample used for repeatability assessment was normoglycemic (x̄ = 6.0 mmol/L), and the other was hypoglycemic (x̄ = 2.1 mmol/L). One feline sample used for repeatability assessment was normoglycemic (x̄ = 6.0 mmol/L), and the other was hyperglycemic (x̄ = 24.7 mmol/L). SD and CV values were calculated from each repeatability dataset (Suppl. Table 1; Suppl. Fig. 1). For Cobas c311 precision, SD and CV were calculated using historical QC data from 262 daily measurements of commercial control material (PreciNorm [x̄ = 4.93 mmol/L, SD = 0.0915 mmol/L, CV = 1.85%] and PreciPath [x̄ = 12.5 mmol/L, SD = 0.289 mmol/L, CV = 2.31%]; Roche).
Because method comparison was performed using single (not replicate) measurements, precision information (CV values) was required as an input for Deming regression analysis. Most glucose concentrations acquired in both species were within or close to reference values for the Cobas c311. Therefore, all CV inputs used for Deming regression reflected imprecision at approximately normal glucose concentrations. Inputs used were CV = 3.43% for correctly and incorrectly coded canine glucometer data, CV = 4.15% for correctly and incorrectly coded feline glucometer data, and CV = 1.85% for Cobas c311 data.
Canine glucose concentrations
The glucose concentration for the Cobas c311 was 5.94 mmol/L for the median, 6.05 mmol/L for correctly coded meters, and 5.49 mmol/L for incorrectly coded meters (Suppl. Table 2). No canine datasets had Gaussian distribution. Glucose concentration measured with the Cobas c311 was within the RI for 97 of 127 (76%) samples, above the RI for 28 of 127 (22%) samples, and below the RI for 2 of 127 (2%) samples.
All comparisons had high-to-very-high positive correlation (Table 1). In the Bland–Altman plots, differences scattered more widely from zero at higher glucose concentrations, suggesting better agreement at lower glucose concentrations for all comparisons (Table 1; Fig. 1). Comparison of mountain plots showed increased negative bias versus the Cobas c311 when the glucometer was incorrectly coded (Fig. 2). In other words, the glucometer tended to underestimate glucose when incorrectly coded (shown on the mountain plots as a shifting of the “mountain peak” to the left). Deming regression analysis identified proportional bias when comparing incorrectly coded glucometer results to correctly coded glucometer results (95% CI for the slope 0.868–0.978; Table 1, Suppl. Fig. 2).
Canine glucose method-comparison data (mmol/L).
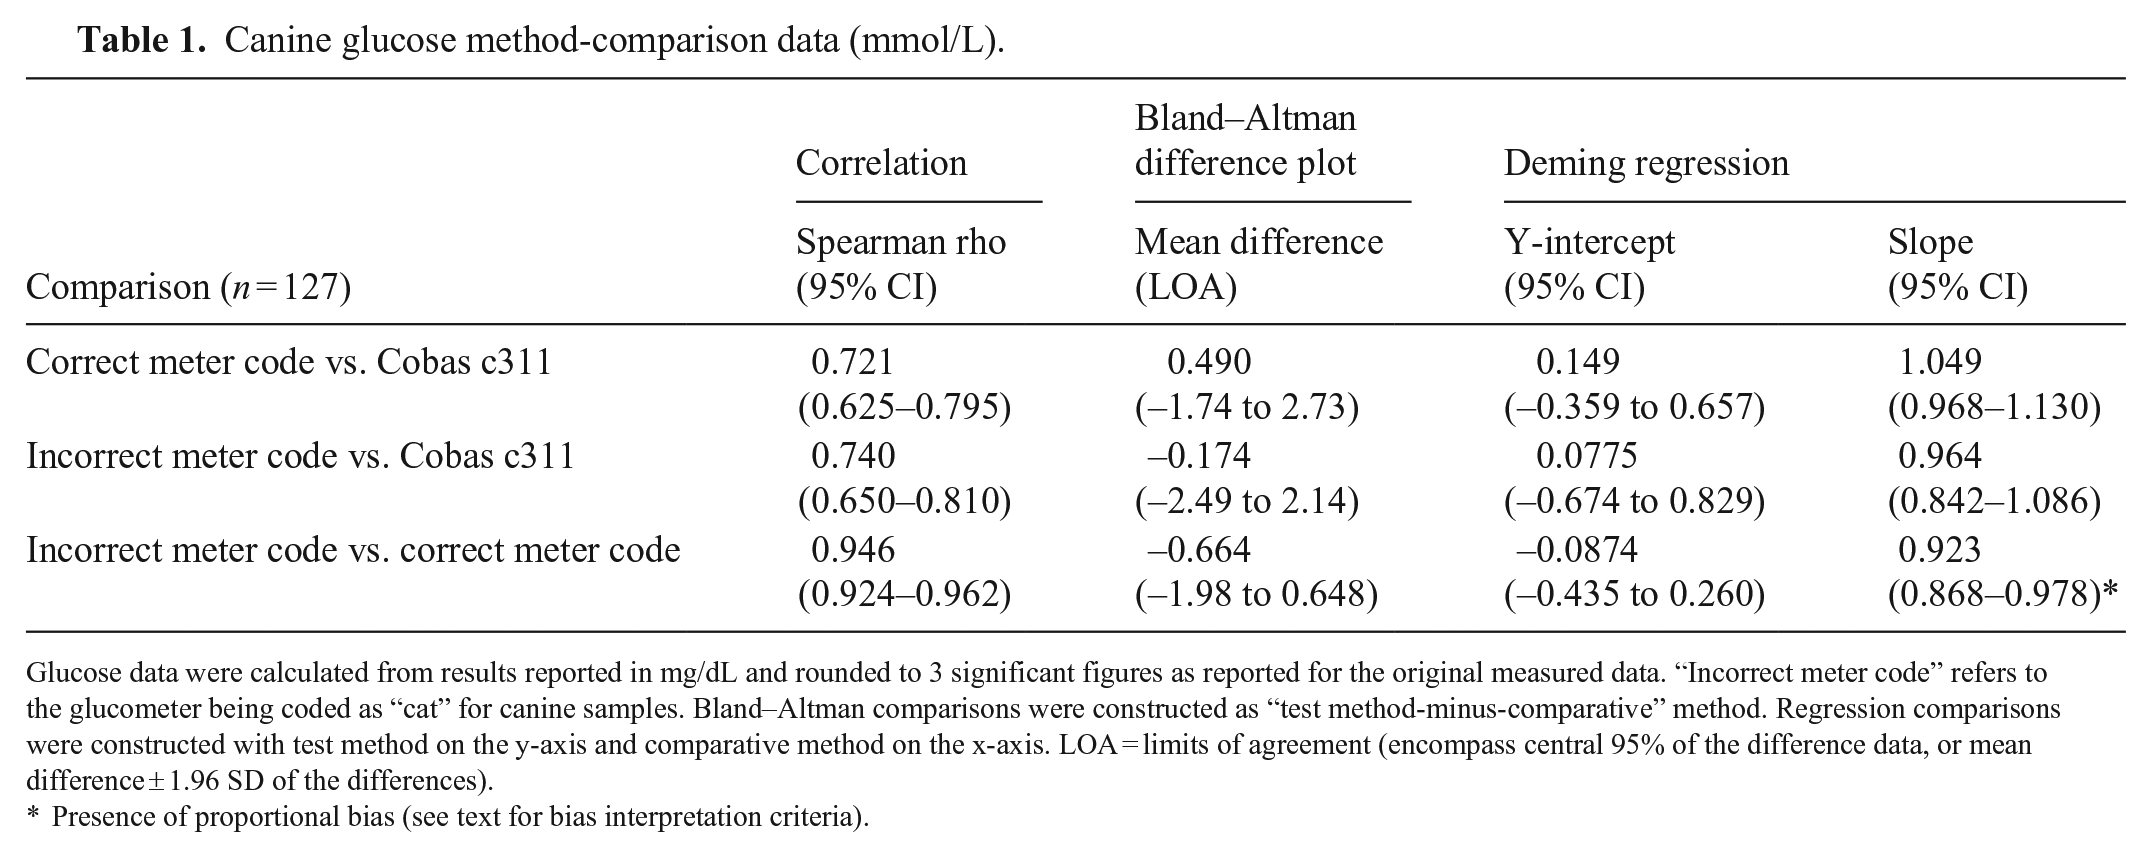
Glucose data were calculated from results reported in mg/dL and rounded to 3 significant figures as reported for the original measured data. “Incorrect meter code” refers to the glucometer being coded as “cat” for canine samples. Bland–Altman comparisons were constructed as “test method-minus-comparative” method. Regression comparisons were constructed with test method on the y-axis and comparative method on the x-axis. LOA = limits of agreement (encompass central 95% of the difference data, or mean difference ± 1.96 SD of the differences).
Presence of proportional bias (see text for bias interpretation criteria).
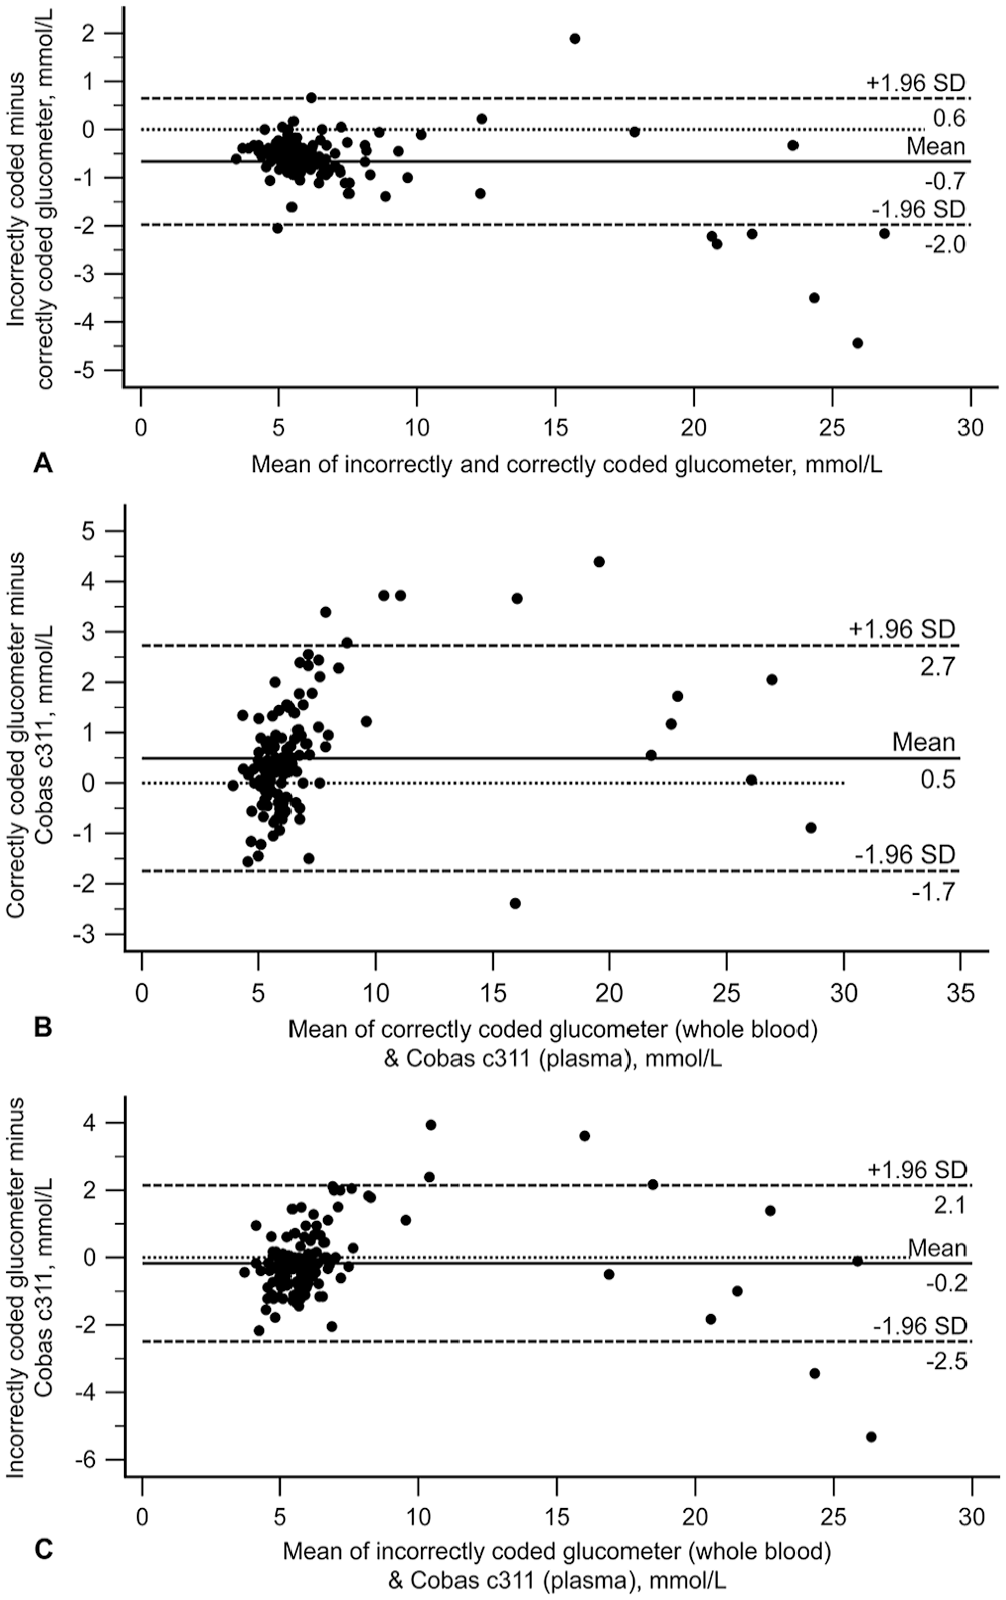
Canine Bland–Altman plots depicting the difference between glucose measurements for canine blood comparing (
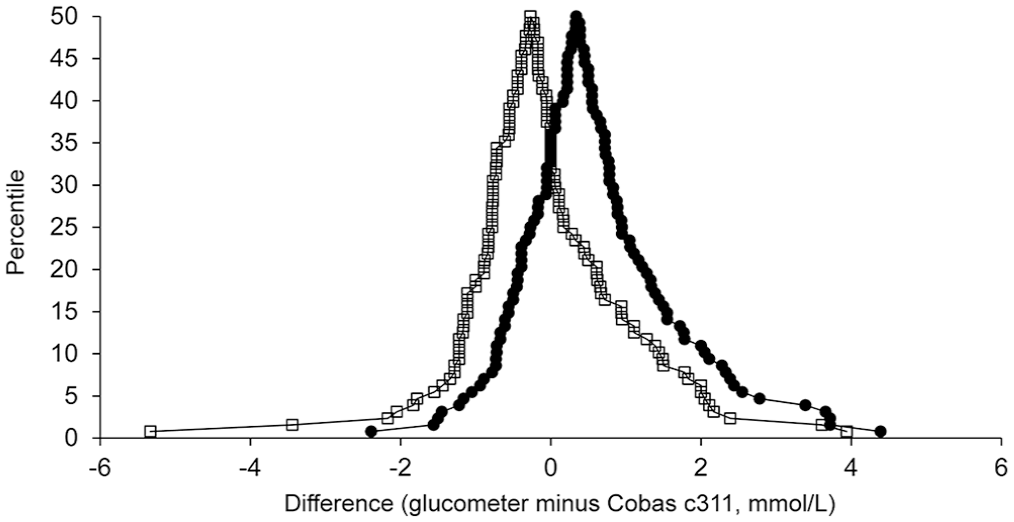
Canine mountain plots (folded empirical cumulative distribution plots) comparing results from the correctly coded (dots) and incorrectly coded (open squares) glucometer to results from the Cobas c311. X-axis values are glucose differences calculated as “glucometer minus Cobas c311”; negative differences mean the glucometer result was numerically less than the Cobas result, and positive differences mean the glucometer result was numerically greater than the Cobas result. The peak of each curve (“tip of the mountain”) is centered close to zero, indicating a small bias between the glucometer and Cobas results. Curve for the correctly coded meter falls to the right of that for the incorrectly coded meter, illustrating that incorrect meter coding results in a larger proportion of negative differences (i.e., a negative bias). Further, the curve for the incorrectly coded results has a longer tail to the left, indicating greater disagreement with the Cobas.
Clarke error grid analysis comparing the correctly coded glucometer vs. the incorrectly coded glucometer revealed clinical equivalency, with 100% of results falling within zone A (Fig. 3A). Larger bias was observed comparing the correctly coded glucometer to the Cobas c311 data (90.0% in zone A, 3.1% in zone B, and 7.1% in zone D; Fig. 3B), as well as the incorrectly coded glucometer to the Cobas c311 data (91.3% in zone A, 3.2% in zone B, and 5.5% in zone D; Fig. 3C).
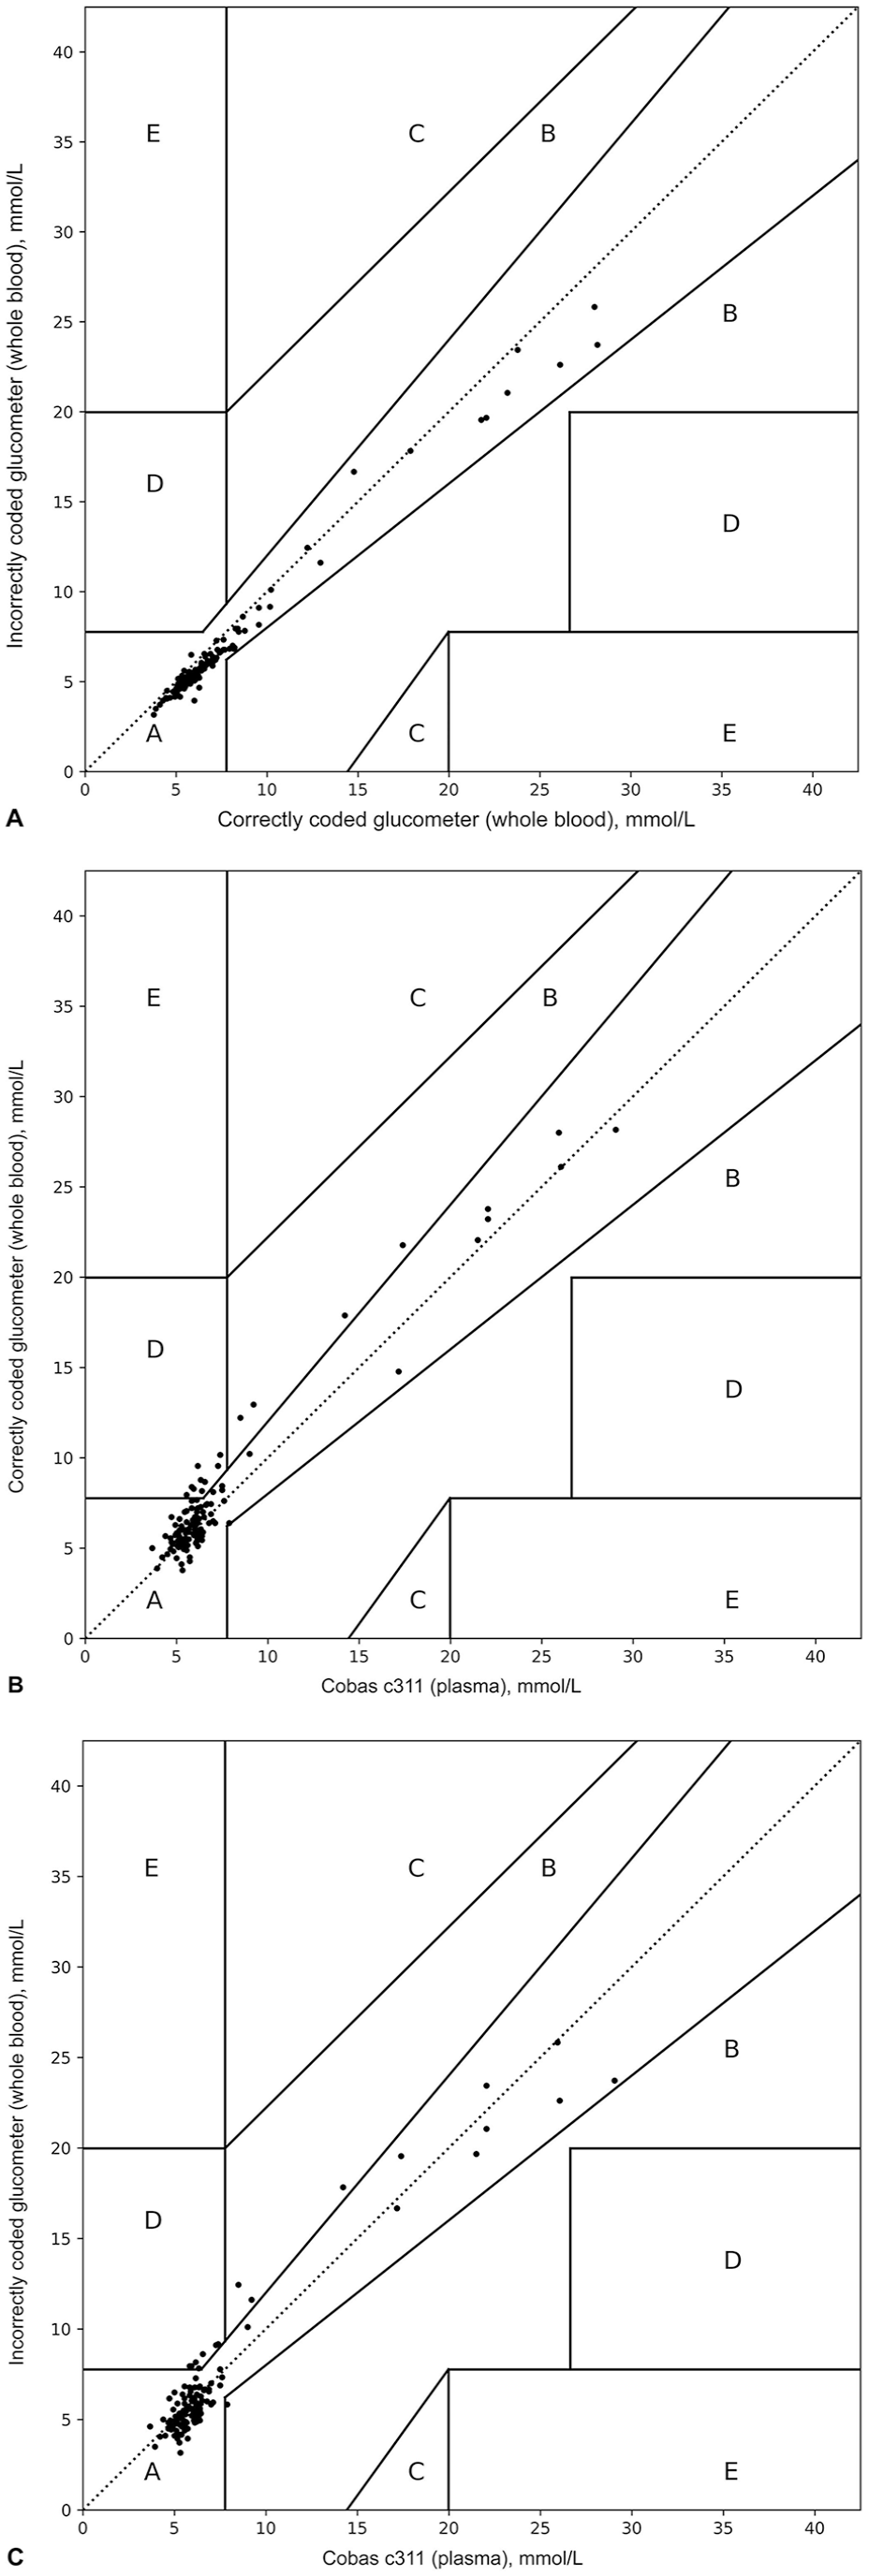
Clarke error grid analysis of canine blood glucose concentrations comparing (A) correctly coded glucometer and incorrectly coded glucometer, (B) correctly coded glucometer and Cobas c311, and (C) incorrectly coded glucometer and Cobas c311. Zones A–E are different clinical consequences of a blood glucose measurement. A = no effect on clinical outcome; B = an altered clinical action with no effect on clinical outcome; C = an altered clinical action with a likely effect on clinical outcome; D = an altered clinical action with the potential for significant medical risk; E = an altered clinical action that could lead to dangerous consequences.
When comparing incorrectly coded glucometer results to correctly coded glucometer results, only 2% of results from the incorrectly coded glucometer were outside the comparability interval defined as “target ± TEa” (i.e., outside the interval “correctly coded glucometer result ± 20%”). Incorrectly coded glucometer results were consistently numerically less than those from the correctly coded glucometer (negative bias). The largest numerical difference was −4.5 mmol/L (incorrectly coded glucometer 23.6 mmol/L minus correctly coded glucometer 28.1 mmol/L) and occurred in a dog with a PCV of 0.46 L/L.
Correctly coded glucometer vs. Cobas c311 and incorrectly coded glucometer vs. Cobas c311 comparisons each yielded 27 of 127 (21%) non-comparable results based on the range “target ± TEa.” Correctly coded glucometer results considered incomparable to those from the Cobas c311 were 3.8–21.8 mmol/L (median: 7.7 mmol/L). The non-comparable results included 1 of 27 (4%) hypoglycemic, 19 of 27 (70%) euglycemic, and 7 of 27 (26%) hyperglycemic samples as determined by the Cobas c311. Incorrectly coded glucometer results considered incomparable to those from the Cobas c311 were 3.2–17.8 mmol/L (median: 5.8 mmol/L). The non-comparable results included 1 of 27 (4%) hypoglycemic, 19 of 27 (70%) euglycemic, and 7 of 27 (26%) hyperglycemic samples as determined by the Cobas c311. Although the proportion of Cobas c311 target results in each glycemic category are the same for each glucometer comparison, the individual samples involved were not the same.
Median PCV was 0.43 L/L (0.16–0.65 L/L), and one patient did not have PCV recorded. One dog was hemoconcentrated, and 29 of 127 (23%) dogs were anemic. Only one dog had a PCV of 0.65 L/L, and no dogs had a PCV < 0.15 L/L. For anemic dogs, median difference between the results of the correctly coded glucometer and incorrectly coded glucometer was 0.712 mmol/L (range: −0.222 to 2.22 mmol/L). For dogs with a normal PCV, median difference between the correctly and incorrectly coded glucometer results was 0.633 mmol/L (range: −1.89 to 4.44 mmol/L). These median differences were not significantly different (p = 0.292).
Feline glucose concentrations
No feline dataset had Gaussian distribution (Suppl. Table 2). The glucose concentration measured with the Cobas c311 was normoglycemic for 14 of 37 (38%) samples and was above the RI for 23 of 37 (62%) samples. No sample had a glucose concentration below the RI.
All comparisons had high-to-very-high positive correlation (Table 2). In the Bland–Altman plots, differences scattered more widely from zero at higher glucose concentrations, suggesting better agreement at lower glucose concentrations for all comparisons (Table 2; Fig. 4). Comparison of mountain plots showed increased positive bias versus the Cobas c311 when the glucometer was incorrectly coded (Fig. 5). In other words, the glucometer tended to overestimate glucose when incorrectly coded (shown on the mountain plots as a shifting of the “mountain peak” to the right). Deming regression analysis identified constant and proportional bias when comparing results from the correctly coded glucometer to the Cobas c311, and identified proportional bias when comparing results for the incorrectly coded glucometer to the Cobas c311 (Table 2; Suppl. Fig. 3).
Feline glucose method-comparison data (mmol/L).
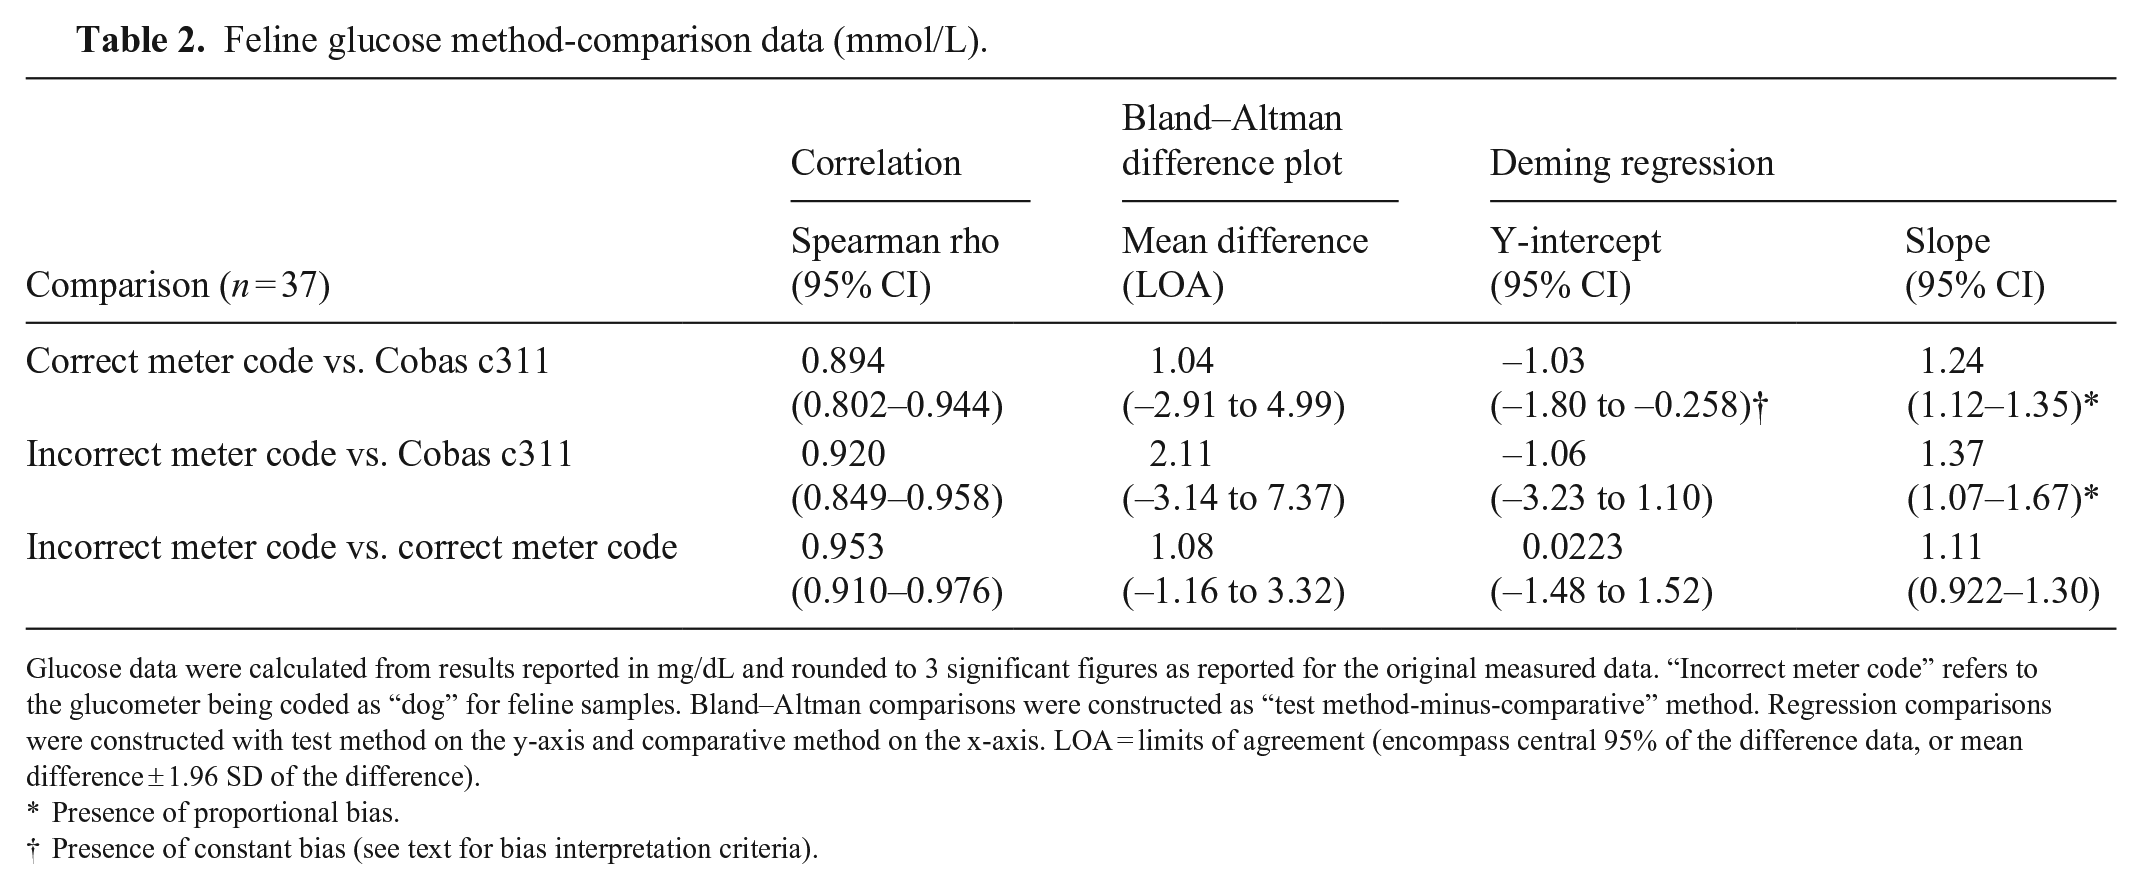
Glucose data were calculated from results reported in mg/dL and rounded to 3 significant figures as reported for the original measured data. “Incorrect meter code” refers to the glucometer being coded as “dog” for feline samples. Bland–Altman comparisons were constructed as “test method-minus-comparative” method. Regression comparisons were constructed with test method on the y-axis and comparative method on the x-axis. LOA = limits of agreement (encompass central 95% of the difference data, or mean difference ± 1.96 SD of the difference).
Presence of proportional bias.
Presence of constant bias (see text for bias interpretation criteria).
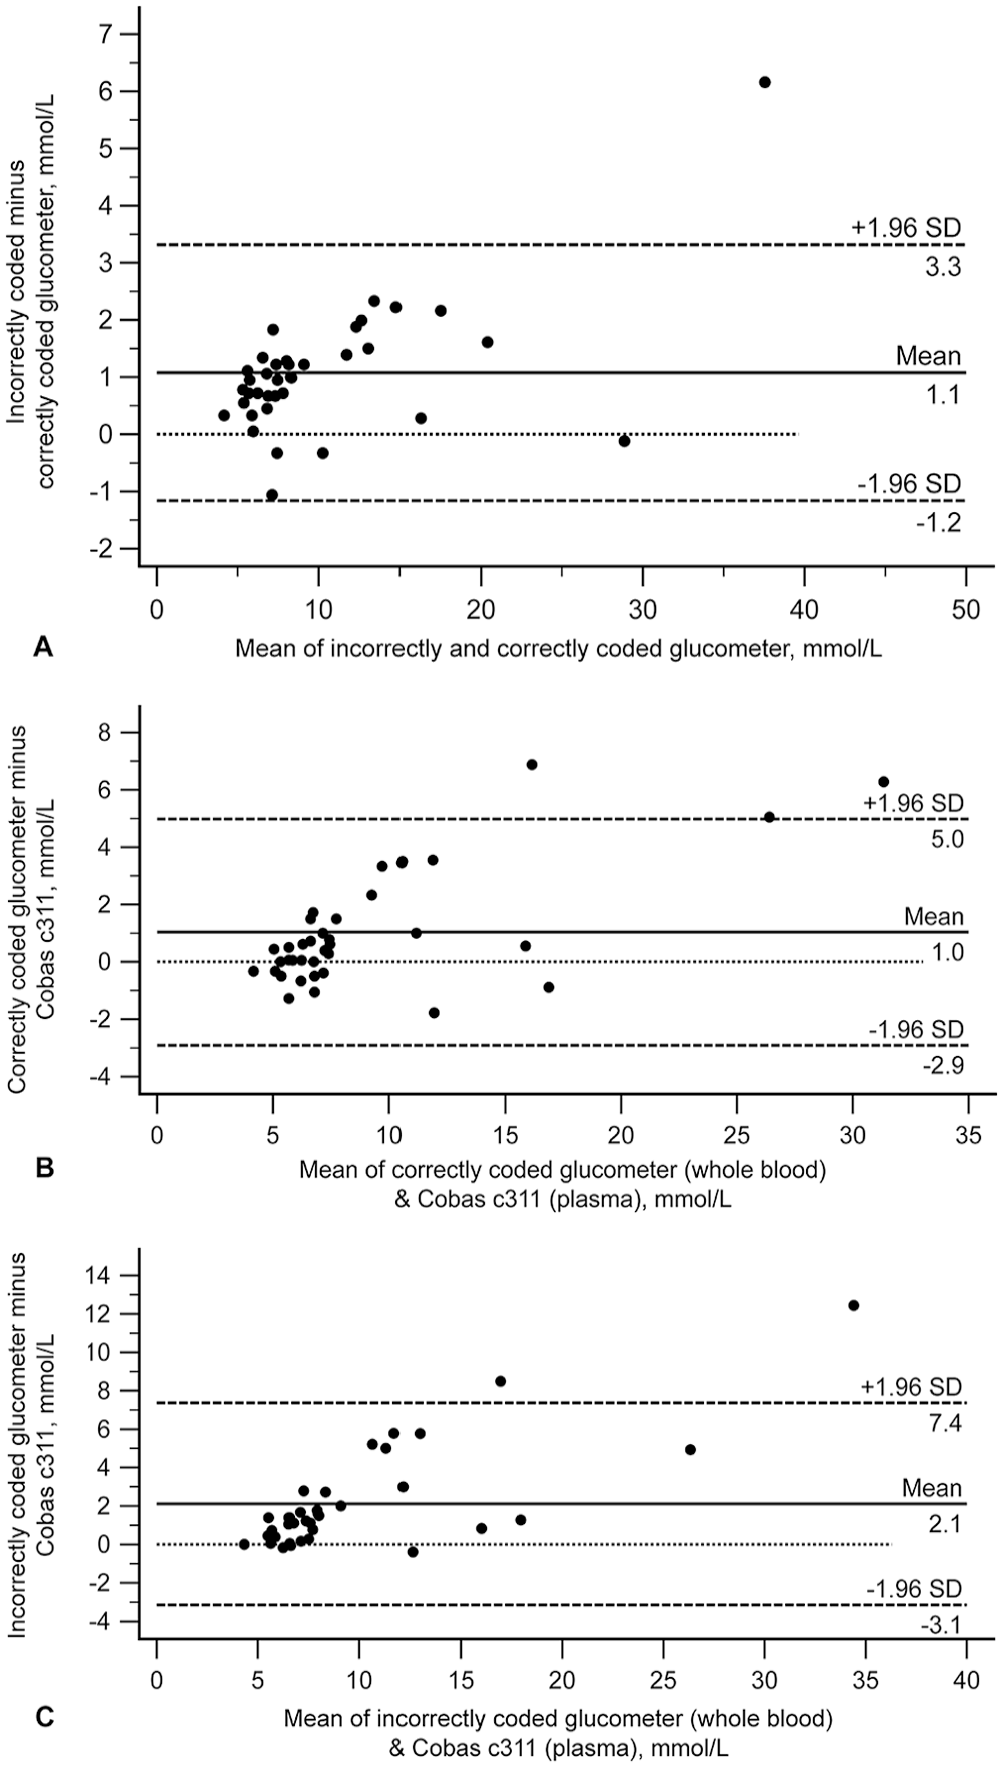
Feline Bland–Altman plots depicting the difference between glucose measurements for feline blood comparing (
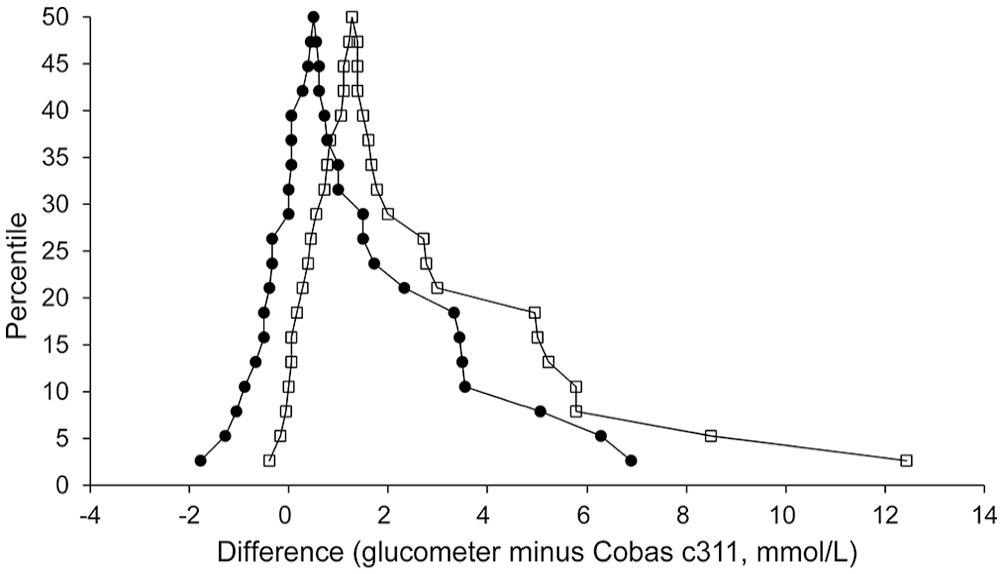
Feline mountain plots (folded empirical cumulative distribution plots) comparing results from the correctly coded (dots) and incorrectly coded (open squares) glucometer to results from the Cobas c311. X-axis values are glucose differences calculated as “glucometer minus Cobas c311”; negative differences mean the glucometer result was numerically less than the Cobas result, and positive differences mean the glucometer result was numerically greater than the Cobas result. The peak of each curve (“tip of the mountain”) is centered close to zero, indicating a small bias. Curve for the correctly coded meter falls to the left of that for the incorrectly coded meter, illustrating that incorrect meter coding results in a larger proportion of positive differences (glucometer results numerically greater than Cobas results, or positive bias). Further, the curve of differences calculated using incorrectly coded results has a longer tail to the right, indicating greater disagreement with the Cobas.
Clarke error grid analysis comparing the correctly coded glucometer vs. the incorrectly coded glucometer revealed good clinical equivalency overall (97.3% in zone A, 2.7% in zone D; Fig. 6A). Bias was identified for comparison of data from the correctly coded glucometer to that from the Cobas c311 (75.7% in zone A, 21.6% in zone B, 2.7% in zone D; Fig. 6B), as well as data from the incorrectly coded glucometer to that from the Cobas c311 (59.5% in zone A, 21.6% in zone B, 2.7% in zone C, 16.2% in zone D; Fig. 6C). Of 6 zone D data pairs for the incorrectly coded glucometer vs. Cobas c311 comparison, 2 glucometer results (7.9 mmol/L vs. 6.3 mmol/L from the Cobas c311; 8.7 mmol/L vs. 5.9 mmol/L from the Cobas c311) would have resulted in a different clinical interpretation using the Cobas c311 RI of 3.2–6.3 mmol/L. Clinical interpretation of hyperglycemia would have remained unchanged for the other 4 zone D data pairs.
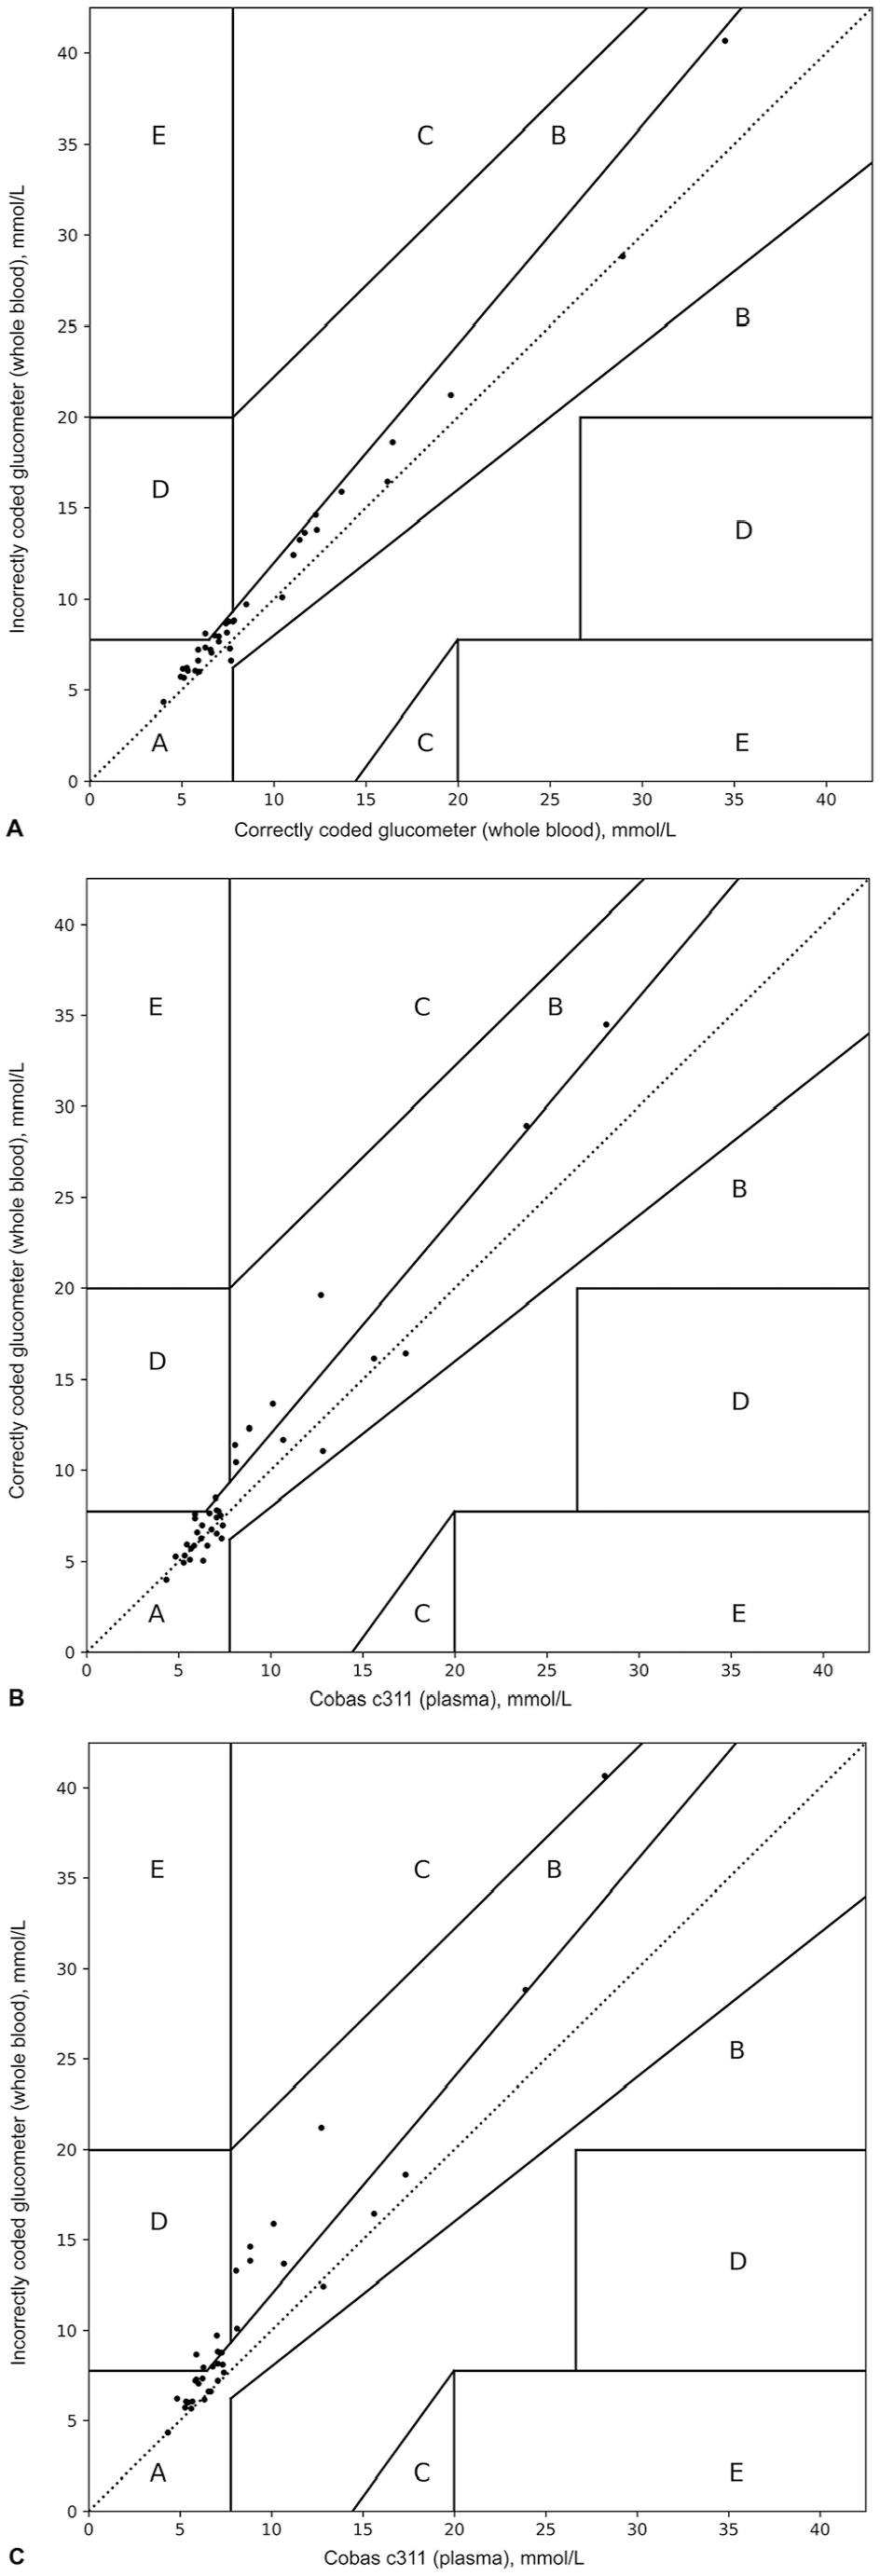
Clarke error grid for feline blood glucose concentrations comparing (A) correctly coded glucometer and incorrectly coded glucometer, (B) correctly coded glucometer and Cobas c311, and (C) incorrectly coded glucometer and Cobas c311. Zones A–E are different clinical consequences of an obtained blood glucose measurement. See Figure 3 legend for explanation of zones.
When comparing incorrectly coded glucometer results to correctly coded glucometer results, 8% of results from the incorrectly coded glucometer were outside the comparability interval defined as “target ± TEa” (i.e., outside the interval “correctly coded glucometer result ± 20%”). Incorrectly coded glucometer results were consistently numerically greater than those from the correctly coded glucometer (positive bias). The largest numerical difference was 6.2 mmol/L (incorrectly coded glucometer 40.6 mmol/L minus correctly coded glucometer 34.5 mmol/L) and occurred in a cat with a PCV of 0.22 L/L.
The correctly coded glucometer vs. Cobas c311 comparison yielded 12 of 37 (32%) non-comparable results based on the range “target ± TEa.” Correctly coded glucometer results considered incomparable to those from the Cobas c311 were 5.0–34.5 mmol/L (median: 11.8 mmol/L). The non-comparable results included 3 of 12 (25%) euglycemic, and 9 of 12 (75%) hyperglycemic samples, as determined by the Cobas c311. The incorrectly coded glucometer vs. Cobas c311 comparison yielded 18 of 37 (49%) non-comparable results. Incorrectly coded glucometer results considered incomparable to those from the Cobas c311 were 6.2–40.6 mmol/L (median: 9.9 mmol/L). The non-comparable results included 5 of 18 (28%) euglycemic, and 13 of 18 (72%) hyperglycemic samples, as determined by the Cobas c311.
For cats, median PCV was 0.35 L/L (0.10–0.50 L/L). Five of 37 (13%) cats were hemoconcentrated, and 9 of 37 (24%) were anemic. No cats had a PCV > 0.65 L/L, and one cat had a PCV < 0.15 L/L. Given the small number of cats in each PCV group, median glucose differences were not compared statistically between PCV groups.
Discussion
We are not aware of any studies that have evaluated the accuracy of veterinary glucometers if the wrong species setting (dog vs. cat) is selected. Although we found that bias is associated with results obtained from different settings, impact on clinical decision-making would be minimal for most patients. These findings were contrary to our hypothesis.
For both dogs and cats, mean bias between results using correct and incorrect species coding was numerically small; however, for individual patients, differences could be large. The dog with the largest numerical difference between glucometer results had a Cobas c311 glucose concentration (29.0 mmol/L) well above the upper canine reference limit for glucose, and a clinical assessment of marked hyperglycemia would have been made regardless of which glucometer result (28.7 or 23.1 mmol/L) had been used for interpretation of glycemic status. Although analytical bias occurred, it was clinically unimportant, illustrating that bias should always be assessed in light of analyte concentration, and that it may not be clinically important when patient results are egregiously abnormal. Similarly, the cat with the largest numerical difference was also hyperglycemic (Cobas c311 result 28.2 mmol/L), and a clinical assessment of severe hyperglycemia would have remained unchanged (correctly coded glucometer result 34.5 mmol/L; incorrectly coded glucometer result 40.6 mmol/L).
When comparing correctly coded glucometer results to those from the Cobas c311, the proportion of non-comparable results was higher for cats than dogs (32% and 21%, respectively), indicating less good agreement between this particular AlphaTrak 2 glucometer and the Cobas c311 for cats versus dogs. Non-comparable feline samples were all euglycemic or hyperglycemic, whereas non-comparable canine samples included all glycemic categories. For both species, incorrect meter coding increased the observed bias, although bias overall was not very impactful clinically.
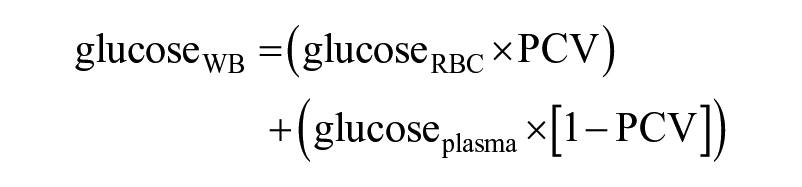
The glucometer that we used measures glucose in a whole blood specimen and reports plasma glucose equivalent using proprietary, species-specific calculations. In human medicine, reporting of plasma glucose equivalent is recommended because it is considered to have greater physiologic relevance than whole blood glucose and facilitates comparability of point-of-care and central laboratory glucose data for accurate medical decision-making.4,10 Whole blood and plasma glucose equivalent concentrations differ because glucose is dissolved in water, and the water content of RBC cytosol (reportedly 71% in humans) and plasma (93%) differs.4,15 On average, plasma from humans with normal hematocrit is said to contain 10–15% more glucose than an equivalent volume of whole blood when patient glucose results are reported in concentration units per sample volume, which is the convention for reporting patient glucose data. 15 This is because, given the plasma and cytosol water content differences described above, a fixed volume of plasma contains more water (and thus more dissolved glucose) than the same fixed volume of whole blood.10,16,27 Because modern biosensors measure glucose using whole blood specimens and central laboratory chemistry instruments use plasma or serum, disagreement between point-of-care and central laboratory glucose results (both reported in concentration units per sample volume) is expected unless a mathematical correction is made (i.e., mathematically correcting measured whole blood glucose concentration [lower] to reflect plasma-equivalent glucose concentration [higher]).10,15 For human specimens, the recommended correction factor for converting whole blood glucose to plasma-equivalent glucose is 1.11 to increase the glucose concentration value from whole blood to the expected one of plasma; this factor presumes the water proportions stated above and a patient HCT of 0.43 L/L. 10 Whether species differences exist in RBC cytosol and plasma water content is not well-documented. Similarity among humans, dogs, and cats for population-based RIs for mean cellular hemoglobin concentration (MCHC) and total protein concentration supports that water content of RBC cytosol and plasma is similar in these species.1,25
Conceptually, whole blood (WB) glucose can be represented by the equation15,16:
Solving this formula for plasma glucose concentration yields:
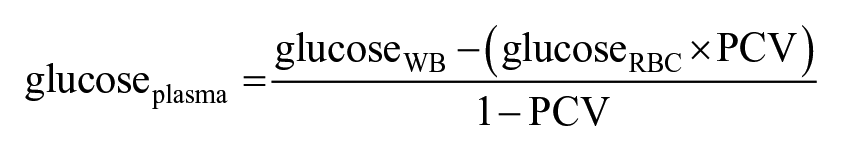
For a given whole blood glucose measurement (e.g., as measured by the glucometer biosensor), plasma glucose equivalent could be inaccurate if either a) any preprogrammed PCV and actual sample PCV are discrepant, and/or b) the proportion of glucose attributed to RBCs is over- or underestimated based on preprogrammed constants.
A fixed volume of anemic blood contains more plasma than the same volume of non-anemic blood. Anemia is a pre-analytical factor contributing to artifactually increased whole blood glucose concentration; given the higher water content of plasma compared to RBCs, the higher water content of anemic samples contributes more glucose. The opposite is true for specimens with hemoconcentration. 10 Most glucometers calculating plasma glucose equivalent from a measured whole blood glucose concentration do not measure or require input of PCV. Presumably, correction formulae for calculating plasma glucose equivalent assume both normal plasma water content and a normal PCV for the species in question. It seems reasonable that if the assumed PCV does not match actual sample PCV (e.g., as the result of a disease state such as anemia, or because glucometer settings are not optimized for the species of the sample), the reported plasma glucose equivalent can be inaccurate. Indeed, PCV is known to impact the performance of the glucometer that we used, and specimens with low PCV yield falsely increased glucose results (and vice versa).21,22 The glucometer user guide 37 acknowledges impact of plasma water content on glucose results in a cautionary statement that severe dehydration and excessive water loss (i.e., hemoconcentration) may cause false low glucose results, similar to the PCV effect observed by others.21,22
Species differences in glucose distribution between RBC cytosol and plasma is a second factor that could impact the calculation of plasma-equivalent glucose. Although species differences in RBC size could contribute to various volumes of RBC cytosol (and therefore glucose contributed by RBCs) in a single fixed volume of whole blood, it seems likely that species differences in RBC glucose permeability and glucose transporter types and/or function play a greater role. Species differences in glucose uptake, 14 erythrocyte permeability to glucose, 26 and erythrocyte energy substrates are documented.2,30,34 Per the brochure infographic for the glucometer that we used, 87.5% of canine glucose is in plasma and 12.5% is in erythrocytes, whereas 93% of feline glucose is in plasma and 7% is in erythrocytes. 36 These percentages are calculated from data in a study of 9 dogs and 4 cats reported elsewhere, 7 in which glucose was measured using a glucose oxidase method in whole blood and plasma, with subsequent calculation of erythrocyte glucose. 7 Hematocrits were also measured in that study and reported to be 0.449 ± 0.065 for dogs and 0.359 ± 0.038 for cats. In Table 2 of that paper, 7 canine x̄ plasma glucose was 4.67 ± 0.44 mmol/L and x̄ RBC glucose was 0.67 ± 0.28 mmol/L. Converting these data to percentages, canine plasma glucose distribution is 4.67/(4.67 + 0.67) = 87.5%, and canine RBC glucose distribution is 0.67/(4.67 + 0.67) = 12.5%. From the same table, feline mean plasma glucose was 5.67 ± 0.78 mmol/L, and mean RBC glucose was 0.44 ± 0.11 mmol/L. Converting these data to percentages, feline plasma glucose distribution is 5.67/(5.67 + 0.44) = 92.8%, and feline RBC glucose distribution is 0.44/(5.67 + 0.44) = 7.2%. The 4 cats were sampled using a femoral vein cannula under pentobarbital anesthesia, and whether stress contributed to measured glucose or PCV results is unknown. Many cats experience handling-associated stress; whether this affects glucose distribution between erythrocytes and plasma is also unknown.
Human glucometers often exhibit bias (report lower glucose concentrations than comparative methods using serum or plasma) when used to measure canine samples.3,5,19 Depending on the particular glucometer brand and model used, bias could potentially either be explained by differences in whole blood versus plasma water content (for glucometers reporting uncorrected whole blood glucose) or by species differences in PCV and in glucose distribution across RBCs and plasma (for glucometers reporting plasma-equivalent glucose). The brochure information regarding human blood for the glucometer that we used is taken from a study in which blood from one (presumably) normal human contained 5.06 mmol/L glucose in plasma and 3.61 mmol/L of glucose in RBC. 24 Converting these numbers to percentages, the human RBCs contained 3.61/(3.61 + 5.06) = 41.6%, and plasma contained 5.06/(3.61 + 5.06) = 58.4% of glucose. Healthy humans and dogs have similar hematocrits; however, data from others support that the contribution of RBC glucose to whole blood glucose is greater in humans than in dogs.1,7,24,25 For canine samples, it seems possible that calculations used by human glucometers reporting plasma-equivalent glucose overestimate the proportion of whole blood glucose contributed by canine RBCs based on preprogrammed factors derived from human physiology, causing underestimation of the canine plasma glucose equivalent.
Similar factors may explain the analytical bias that we observed, where, on average, incorrect meter coding introduced negative bias for canine samples coded as “cat” and positive bias for feline samples coded as “dog.” The plasma-equivalent calculations used by the glucometer in our study are proprietary, and it is not possible to confirm the exact bias source without knowing the equations used. Analogous to the dog-vs.-human scenario above, based on RBC glucose distribution alone, incorrectly coding the glucometer in our study as “cat” for a canine sample might be predicted to underestimate the proportion of whole blood glucose attributed to RBCs and, therefore, to overestimate plasma-equivalent glucose; instead, incorrect meter coding resulted in mild underestimation of canine glucose versus the Cobas c311. Per others, 7 feline RBCs contribute less to whole blood glucose than canine RBCs, and any preprogrammed calculation constants presumably reflect this fact. However, in health, cats may have lower PCVs than dogs, and it seems possible that any preprogrammed feline PCV used by the glucometer calculation could also contribute to the observed bias when the cat setting is used to measure canine samples (and vice versa).
Our study had a few limitations. First, the number of cats was less than determined to be needed by the power calculation; however, the study population was sufficient to identify bias. Second, only a small number of hypoglycemic samples (no hypoglycemic feline samples, and only 2% of canine samples) were included, and further characterization of bias at low glucose concentrations should optimally be carried out in settings in which glucometer results are used to inform medical treatment of hypoglycemia. Third, only one unit of a single veterinary glucometer was used. Analytical performance can vary, even between 2 instruments of the same make and model, and we cannot exclude that other AlphaTrak 2 glucometers might have different degrees of bias versus central laboratory instrumentation. Lastly, the error grid utilized in our study was designed for humans with diabetes. Although the possibility of different results and conclusions with canine- and feline-specific error grid analyses cannot be excluded, the TEa and decision thresholds for glucose testing are not markedly different between dogs or cats and humans.
Supplemental Material
sj-pdf-1-vdi-10.1177_10406387231195386 – Supplemental material for Impact on result interpretation of correct and incorrect selection of veterinary glucometer canine and feline settings
Supplemental material, sj-pdf-1-vdi-10.1177_10406387231195386 for Impact on result interpretation of correct and incorrect selection of veterinary glucometer canine and feline settings by Lydia W. Peña, Bente Flatland, Ellen N. Behrend, Alba Arzón-Pereira, Janeva E. Cole and Maggie L. Raz in Journal of Veterinary Diagnostic Investigation
Footnotes
Acknowledgements
We thank Dillon French for providing statistical support. Presented in part in abstract form at the 2019 American College of Veterinary Medicine Forum, Phoenix, AZ, USA, June 2019.
Declaration of conflicting interests
The authors declared no potential conflicts of interest with respect to the research, authorship, and/or publication of this article.
Funding
The authors received no financial support for the research, authorship, and/or publication of this article.
Supplemental material
Supplemental material for this article is available online.
References
Supplementary Material
Please find the following supplemental material available below.
For Open Access articles published under a Creative Commons License, all supplemental material carries the same license as the article it is associated with.
For non-Open Access articles published, all supplemental material carries a non-exclusive license, and permission requests for re-use of supplemental material or any part of supplemental material shall be sent directly to the copyright owner as specified in the copyright notice associated with the article.