
Abstract
Measurement of total thyroxine (T4) is the first testing step in the work-up of thyroid disease in small animals. We evaluated an enzyme-linked fluorescent assay (ELFA) as an in-house method to measure T4 in cats and dogs. We compared the T4 concentration in sera of 122 cats and 176 dogs measured by the ELFA with an enzyme immunoassay (EIA) to assess the concordance of the 2 methods. Bias of the ELFA in cats was −11.4% and in dogs 1.4%. Using Bland–Altman plots, limits of agreement were −81.5 to 58.7% in cats and −71.4 to 74.4% in dogs. Imprecision was calculated for both methods. Intra- and interassay coefficients of variation (CVs) of the ELFA in feline sera were 0.7 and 3.4% and of the EIA 7.6 and 15.7%, respectively. Intra- and interassay CVs of both ELFA and EIA in canine sera were <9.5%. Reference intervals for the ELFA method were established and were 13.3–49.5 nmol/L for cats and 10.1–42.9 nmol/L for dogs. Accuracy of the EIA and ELFA was scored by assessing if the measured T4 value would identify the expected T4 range (low, normal, or elevated) of patients, based on history, clinical presentation, other diagnostic means, and response to therapy. This was possible for 75 cats and 50 dogs. Both methods yielded acceptable results, but the EIA was more accurate compared to the ELFA (percentage of true-positives in cats and dogs: EIA: 97% and 100%; ELFA: 92% and 94%).
Introduction
Endocrine testing of dogs and cats is routinely performed in veterinary practice. Canine hypothyroidism and feline hyperthyroidism are frequently encountered endocrinopathies, and measurement of baseline total thyroxine (T4) concentration has become a valuable tool for the initial evaluation of thyroid function.8,10,27,28
In cats suspected of being hyperthyroid, an increased T4 concentration confirms the diagnosis if appropriate clinical signs are present. 27 Concentrations of T4 in the mid- to upper portion of the reference interval (RI) in cats suspected of hyperthyroidism are considered suspicious and should lead to further testing, such as measurement of free T4 by equilibrium dialysis (fT4d) or endogenous thyroid-stimulating hormone (TSH).11,27,29 In dogs, T4 measurement is most often used to exclude a diagnosis of hypothyroidism or to assess the treatment response to thyroxine replacement therapy.24,30 For confirmation of suspected hypothyroidism, additional tests, such as the determination of TSH or fT4d may be necessary if T4 is low or the clinical suspicion is high in cases in which the T4 is within normal limits or even elevated.2,8,18 Thyroxine concentrations can vary during the day, and a one-time low value does not prove hypothyroidism.13,19
Various studies have investigated different methods to determine T4 concentrations in serum samples from dogs and cats (Supplemental Table 1, available online at http://vdi.sagepub.com/content/by/supplemental-data). The first immunologic method used was radioimmunoassay (RIA).4,10 The assay uses a solid-phase system in which radioactive iodine (125I or 131I)-labeled T4 competes with the T4 in the sample for antigen-binding sites of specific anti-T4 antibodies immobilized on the solid phase. Following incubation and washing, radioactivity is measured with a gamma counter, and the amount of T4 in the sample is calculated. Several validation studies have been performed.31,19,27 RIA can be used for the diagnosis of thyroid disorder in dogs19,31 and cats. 27 Validation criteria were high correlation coefficients, 27 coefficients of variation (CVs) of <10%19,27 to 16.5%, 31 alignment of inhibition curves to the test’s standard curves,27,31 change of hormone concentration after injection of stimulating hormones, 31 accuracy measured by recovery rate of T4,27,31 and cross-reactivity of antibodies. 31 Other validation studies tested chemiluminescent- and chemiluminescent enzyme immunoassays (CIA/CEIA), 33 enzyme immunoassay (EIA), 14 enzyme-linked immunosorbent assay (ELISA),16,20 and fluorescent enzyme immunoassay (FEIA). 12 These various methods have been compared to the validated RIA methods, except for the FEIA, which was compared to the CEIA. 12 Initially, the ELISA did not fulfill the validation criteria. 20 However, by adapting the test protocol (introduction of an additional standard, prolongation of the incubation period, and reduction of the amount of T4 conjugate), the authors were able to produce precise and accurate results in a follow-up study. 16
All these measurement methodologies share the disadvantage that, in general, samples must be sent to an external reference laboratory. This implies a delay in results. Although it is not crucial to obtain test results for hypothyroidism in dogs and hyperthyroidism in cats within a short period of time, practitioners and animal owners may still be interested in a fast turnaround for the submitted samples. Also, the cost for the determination of T4 measured with an in-house system could be significantly lower than that of a reference laboratory. To our knowledge, the only evaluations of in-house test systems reported to date have been for the ELISA 21 and the FEIA. 12 Substantial discrepancies between ELISA and RIA results led to the conclusion that the in-house ELISA was not accurate for the determination of T4 in dogs and cats. 21 Usefulness of the FEIA for clinical practice was proven. 12
We evaluated an ELFA a method for the in-house measurement of T4 concentrations in feline and canine serum prior to the potential release of the ELFA to veterinary practitioners. This test system has been validated and is available to practitioners for measurement of canine progesterone. 7 It would be of interest if the measurement of feline and canine T4 could be performed on the same device, thus increasing its usability. The study design was 4-fold. We 1) evaluated whether the ELFA can be used interchangeably with an established and previously validated EIA b ; 2) assessed the imprecision for both tests; 3) established RIs for the ELFA method; and 4) evaluated the accuracy of the EIA and ELFA methods.
Materials and methods
Assays
An EIA b method for feline and canine T4 measurement was used as the assay to which the new method was compared. The EIA was performed on an automated analyzer d at a commercial laboratory as described previously.14,15
We performed the ELFA a on an in-house automated analyzer. b The assay principle combines an immunoassay competition method with fluorescence detection. Reagents for the assay are ready-to-use and predispensed in sealed reagent strips. The solid-phase receptacle (SPR) serves as the solid phase as well as the pipetting device for the assay. The reaction medium is cycled in and out of the SPR several times. First, the serum sample is aspirated into the SPR and the T4 in the sample binds to the specific monoclonal antibodies coated on the interior of the SPR. Next, the conjugate containing an alkaline phosphatase–labeled T4 derivative is cycled in and out of the SPR, saturating the remaining free antibody sites. Unbound components are eliminated during washing stages. Alkaline phosphatase hydrolyses the substrate (4-methyl-umbelliferyl phosphate) into a fluorescent product (4-methyl-umbelliferone), and the fluorescence is measured at 450 nm. The intensity of the fluorescence signal is inversely proportional to the concentration of T4 present in the sample. At the end of the assay, results are automatically calculated by the instrument in relation to the calibration curve stored in memory, and then printed out. With each batch of reagents, a calibrator, a control, and batch-specific reference data are provided. After initial calibration of the instrument for each batch, recalibration is necessary at 14-d intervals. Following computation by the instrument, the results are expressed in nmol/L; the range covered is 6–320 nmol/L. Each kit contains 60 assays. The T4 assays and the blood samples were allowed to equilibrate at room temperature for 30 min before the assay was performed with 200 µL of serum for each sample. The test was carried out according to the manufacturer’s instructions.
Prospective study
The study design was approved by the ethics committee of the Centre of Clinical Veterinary Medicine, Ludwig Maximilian University Munich (LMU; accession 21-12-02-2014). Informed owner consent was obtained.
Blood samples were included from cats and dogs that were presented to the Clinic of Small Animal Medicine, LMU (Munich, Germany), and where T4 measurements were performed as part of the workup or to assess response to therapy. If the blood sample volume was insufficient for analysis (<1 mL), the animal was excluded. Blood samples were collected from the cephalic, jugular, or lateral saphenous veins in anticoagulant-free tubes. Blood was allowed to clot for 15 min at room temperature and subsequently centrifuged at 1,520 × g for 5 min. Serum was obtained, and T4 was analyzed by the EIA. Surplus serum of 200 µL was stored at −20°C until analysis by the ELFA. On the day of analysis by the ELFA, frozen samples were allowed to thaw at room temperature. Imprecision estimates for the ELFA and EIA were conducted for both cats and dogs. Fifteen milliliters of blood were collected from 1 cat and 1 dog. The serum harvested was also stored in aliquots of 200 µL at −20°C until analysis. To assess linearity, samples were serially diluted with phosphate-buffered saline to concentrations of 0.75, 0.5, and 0.25 of the original concentration. For the determination of intra-assay CV for both EIA and ELFA, aliquots of each species were assayed on the same day; for the determination of interassay CV, aliquots were assayed on consecutive days. To establish RIs for the ELFA, serum samples from healthy cats and dogs were analyzed. These animals were presented to the Clinic of Small Animal Medicine for annual health checks and showed no signs of illness on history and physical examination. Complete blood count (CBC) and biochemistry profiles of those patients were obtained and were unremarkable.
To assess accuracy of the EIA and ELFA, all records of patients included in the study were reviewed by one of the authors (Diplomate of the European College of Veterinary Internal Medicine–Companion Animals and member of the European Society of Veterinary Endocrinology). Wherever possible, the expected T4 range of a patient was estimated, based on the patient’s history, clinical presentation, other laboratory tests (usually hematologic and biochemical evaluation and other endocrine test results [endogenous TSH and fT4d]), and response to therapy. Patients were grouped into disease categories. Cat groups consisted of healthy cats (normal T4 expected), cats with non–thyroidal illness (NTI; normal or low T4 expected), cats with untreated hyperthyroidism (increased T4 expected), and cats with diagnosed hyperthyroidism that were currently under medical therapy (normal or slightly low T4 expected). Dog groups consisted of healthy dogs (normal T4 expected), dogs with NTI (normal or low T4 expected), dogs with untreated hypothyroidism (low T4 expected), dogs with hypothyroidism that were currently under medical therapy (normal or slightly increased T4 expected), as well as dogs with iatrogenic hyperthyroidism (increased T4 expected). We determined in how many cases the measured T4 value of both tests would match the expected range.
Statistical analysis
Statistical analysis was performed using a commercial software package. e T4 values obtained by the EIA method were converted to SI units (from µg/dL to nmol/L) using the following formula: nmol/L = (µg/dL) × 12.9. Values that were below the minimum detection limit in both methods (<6.0 nmol/L for ELFA and <9.0 nmol/L [<0.7 µg/dL] for EIA) or above the maximum detection limit (>320 nmol/L for ELFA and >167 nmol/L [>13 µg/dL] for EIA) were excluded from statistical analysis. This was the case in 14 dogs and 1 cat.
T4 values obtained by the EIA and ELFA methods were compared using Pearson correlation analysis, and Passing–Bablok regression analysis including CUSUM test for linearity. For Passing–Bablok regression analysis, the 95% confidence interval (CI) examines if their value differs from 0 for intercept and 1 for slope only by chance. Thus, if the 95% CI for intercept includes 0, it can be concluded that there is no significant difference between the obtained intercept value and 0, and there is no constant difference between 2 methods. As well, if the 95% CI for slope includes 1, it can be concluded that there is no significant difference between the obtained slope value and 1, and there is no proportional difference between 2 methods. If the CUSUM test for linearity shows significant deviations from linearity, one may assume that the 2 methods cannot be used interchangeably and that no further tests of agreement are needed.1,17 As linearity was proven, agreement between the 2 methods was further evaluated by Bland–Altman plots, where bias is defined as the mean difference between methods. The difference of the EIA and ELFA methods was plotted against the mean value of the EIA and ELFA methods, as no gold standard was available. Results of the Passing–Bablok regression analysis indicated that the relative bias had to be used for the Bland–Altman plots. Agreement was considered good if there was no bias or if the bias was small, the 95% CI were narrow, and no outliers were present. No bias was present if the 95% CI included 0.5,17
To assess imprecision of both tests, linearity and CVs were measured. Linearity under dilution was investigated by diluting the samples to concentrations of 0.75, 0.50, and 0.25 of the original concentration, followed by linear regression analysis. CVs were calculated for multiple runs (intra- and interassay variation). According to CLSI guidelines for the establishment of reference intervals, the “robust method” was used in cats (sample size <120), and the nonparametric percentile method was used in dogs (sample size >120). 34 For determination of accuracy, we determined the number of cases in which the measured T4 value of both tests would match the expected range. Results are expressed as true-positives by an absolute number and a percentage value. Statistical significance was set at p < 0.05.
Results
T4 concentration was determined in serum samples from 122 cats and 176 dogs using both methods. For the method comparison (Pearson correlation, Passing–Bablok regression, and Bland–Altman plots), data from 121 cats and 162 dogs were analyzed. Pearson correlation analysis showed highly significant (p < 0.0001) results between both assays, with r = 0.84 for cats and r = 0.58 for dogs. Because r was <0.975, Passing–Bablok regression analysis was performed (Figs. 1, 2; Table 1). The CUSUM test for linearity showed no significant deviation from linearity for either cat or dog sera. Bland–Altman bias plots revealed a mean bias of −11.4 for cats and 1.4 for dogs (Figs. 3, 4). However, the 95% CI showed that the 2 methods would differ by up to 81%. Standard deviation was 33.3 for cats and 37.2 for dogs.
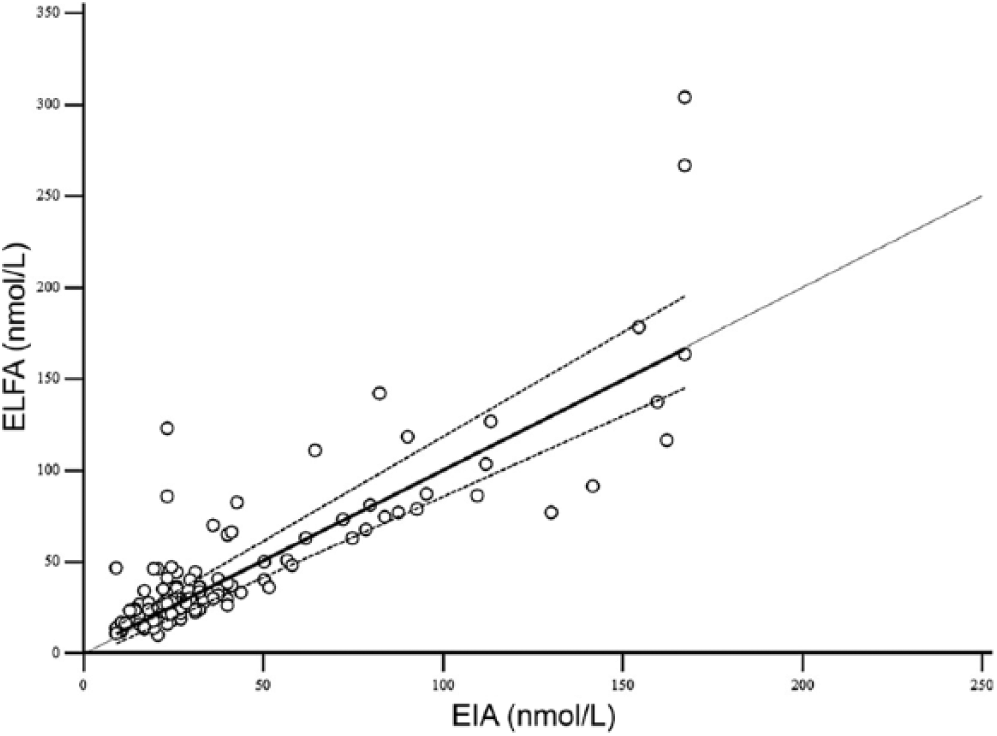
Passing–Bablok regression plots of enzyme immunoassay (EIA) versus enzyme-linked fluorescent assay (ELFA) for feline T4 (total thyroxine). The dotted line represents the line of equality, the solid lines represent the regression equation, and the dashed lines represent the 95% confidence intervals of the regression equation.
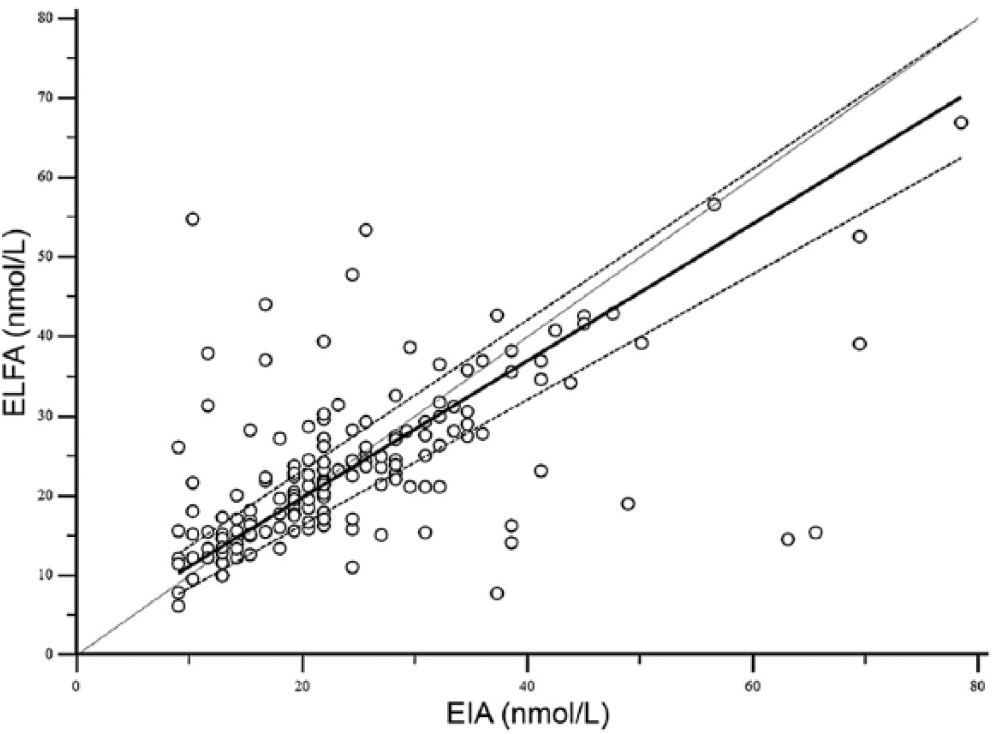
Passing–Bablok regression plots of enzyme immunoassay (EIA) versus enzyme-linked fluorescent assay (ELFA) for canine T4 (total thyroxine). The dotted line represents the line of equality, the solid lines represent the regression equation, and the dashed lines represent the 95% confidence intervals of the regression equation.
Median values, range, and Passing–Bablok regression analysis results for the enzyme immunoassay (EIA) and enzyme-linked fluorescent assay (ELFA).*
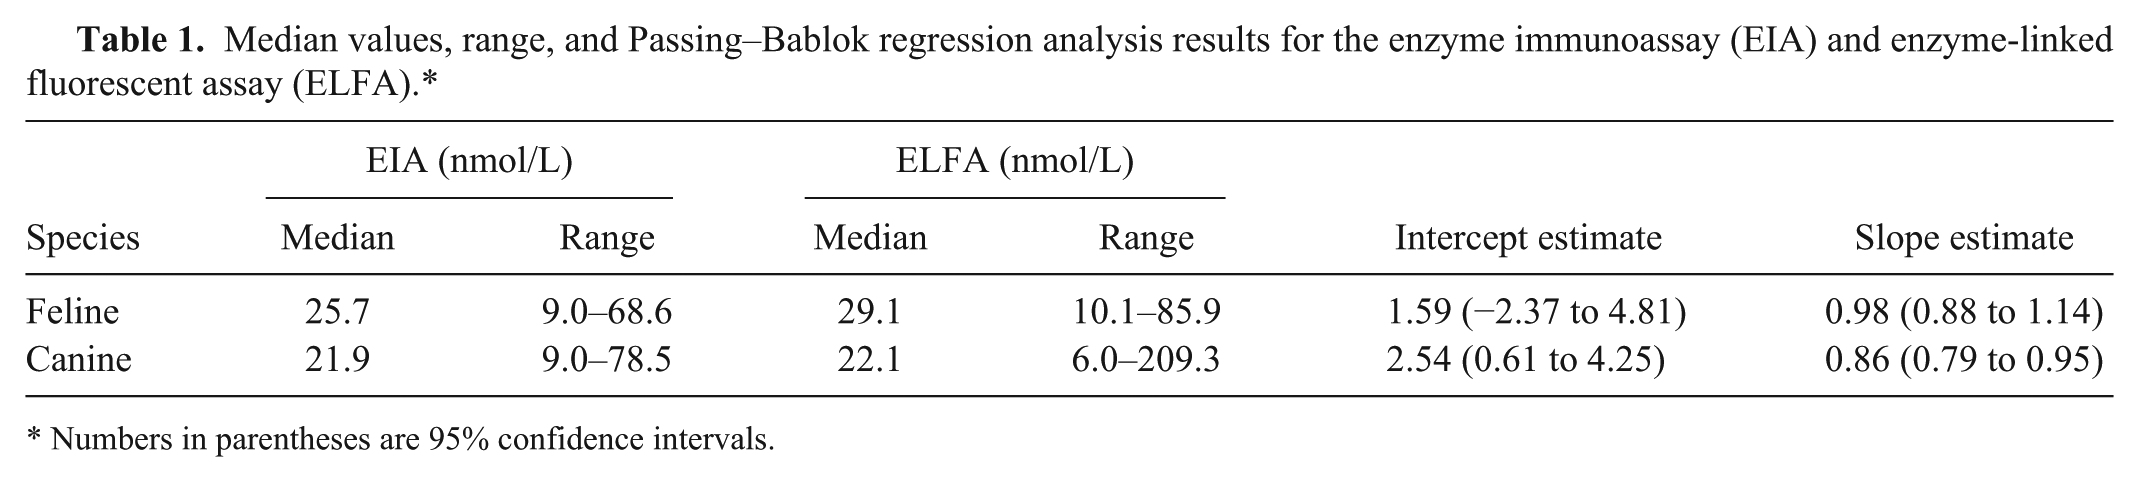
Numbers in parentheses are 95% confidence intervals.
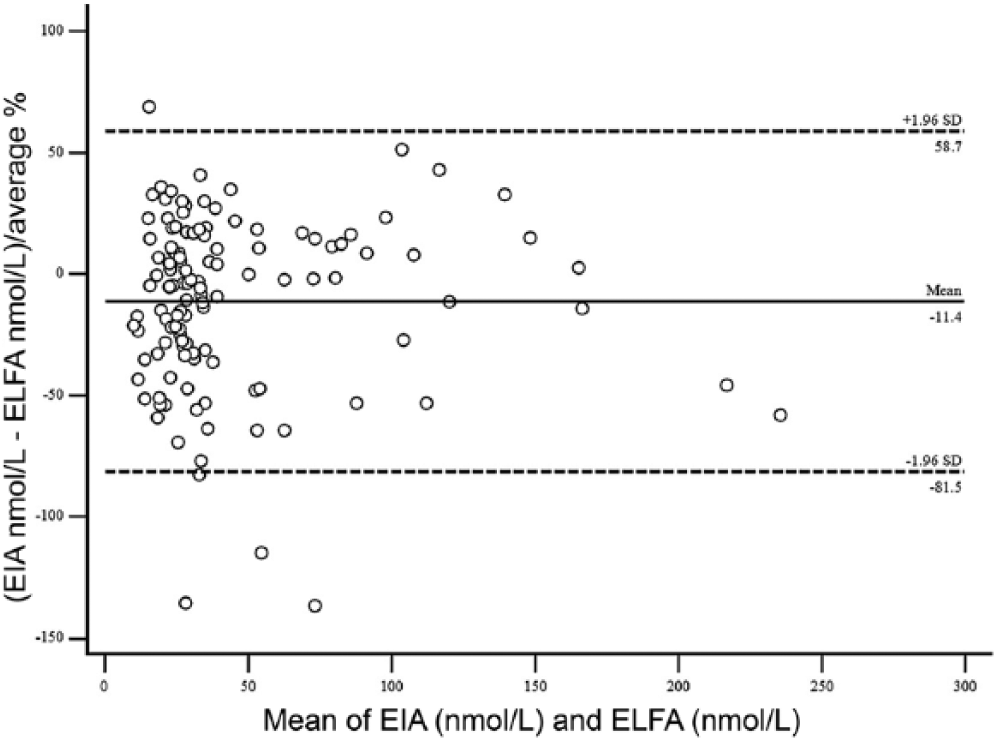
Bland–Altman difference plots using the enzyme immunoassay (EIA) and enzyme-linked fluorescent assay (ELFA) for feline T4 (total thyroxine). The dashed lines indicate the 95% limits of agreement (mean of the differences ± 1.96 standard deviation).
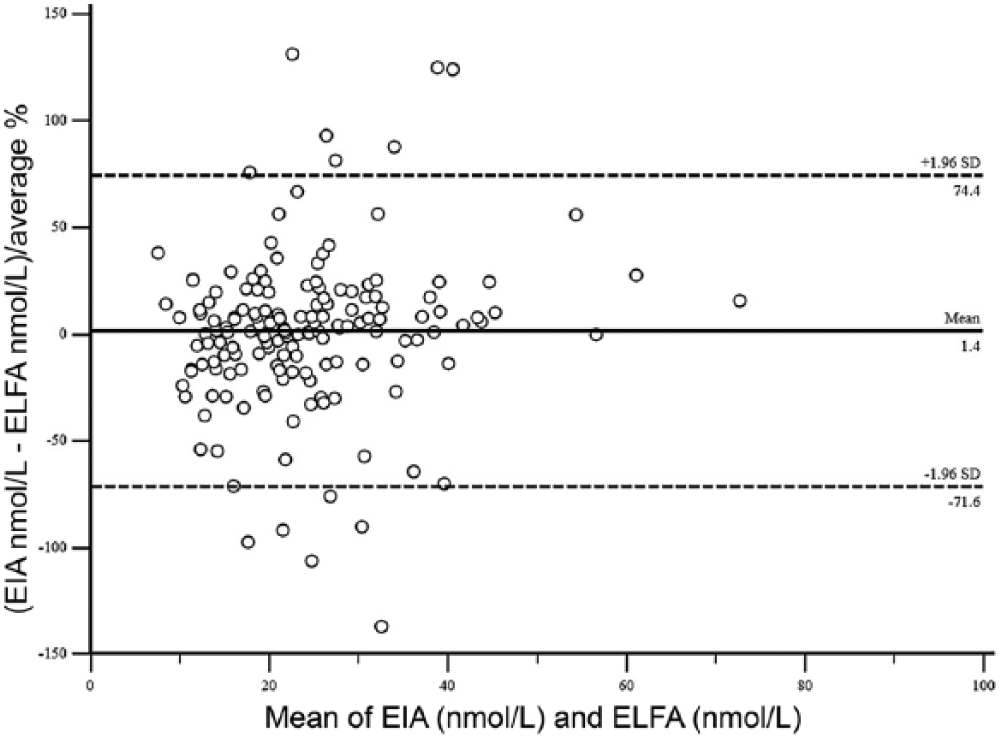
Bland–Altman difference plots using the enzyme immunoassay (EIA) and enzyme-linked fluorescent assay (ELFA) for canine T4 (total thyroxine). The dashed lines indicate the 95% limits of agreement (mean of the differences ± 1.96 standard deviation).
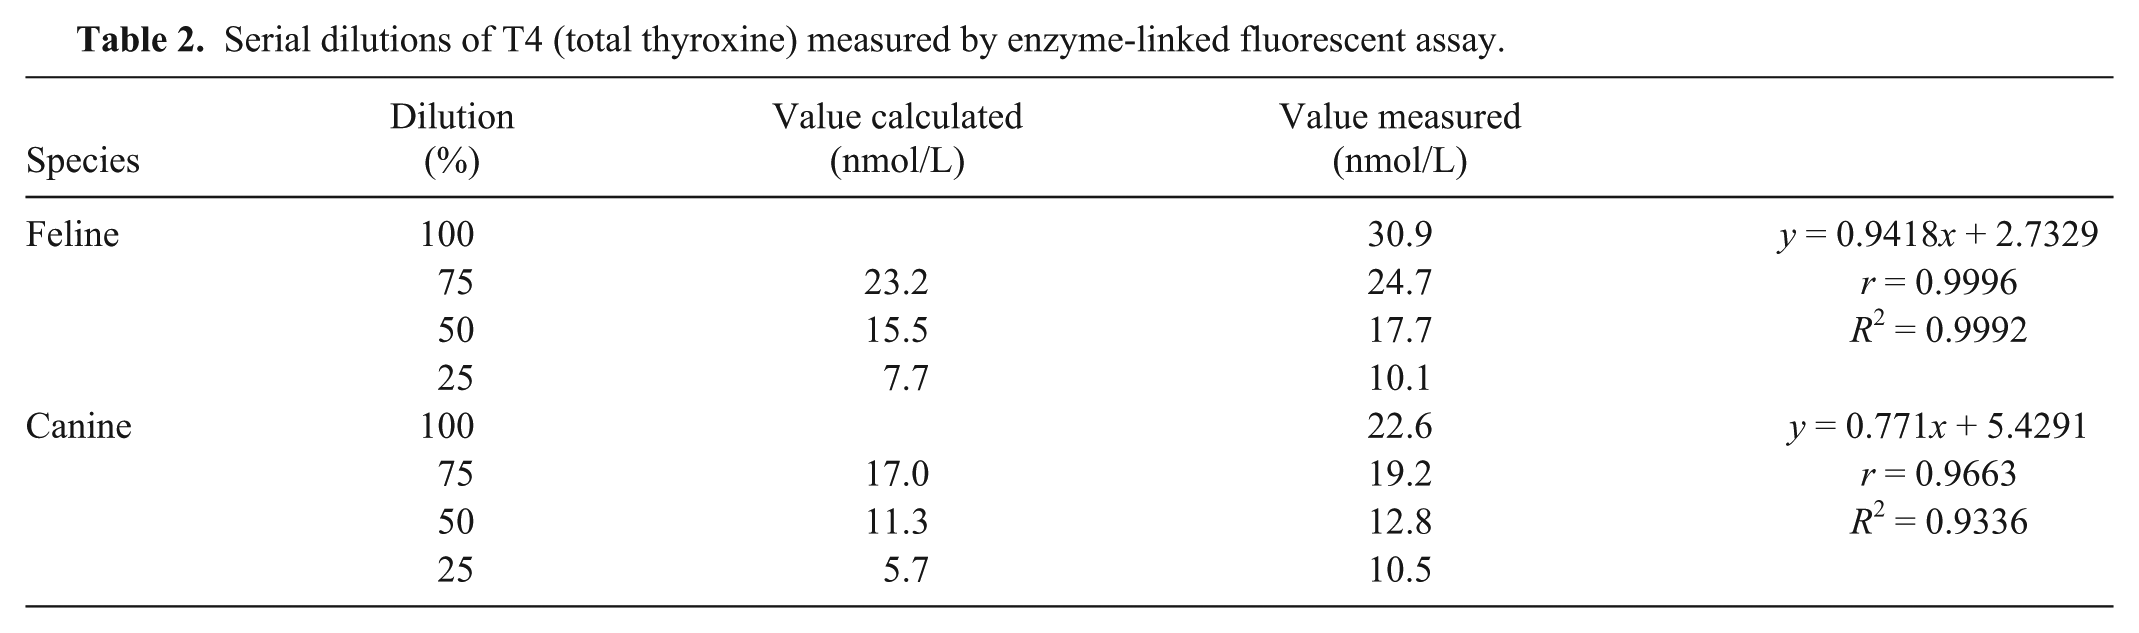
Serial dilutions showed very good linearity of the ELFA in cats and good linearity in dogs (Table 2). Intra- and interassay imprecision was determined for each species and for each assay (Table 3).
Serial dilutions of T4 (total thyroxine) measured by enzyme-linked fluorescent assay.
Coefficients of variation (CVs) for the measurement of T4 (total thyroxine) using the enzyme immunoassay (EIA) and enzyme-linked fluorescent assay (ELFA).
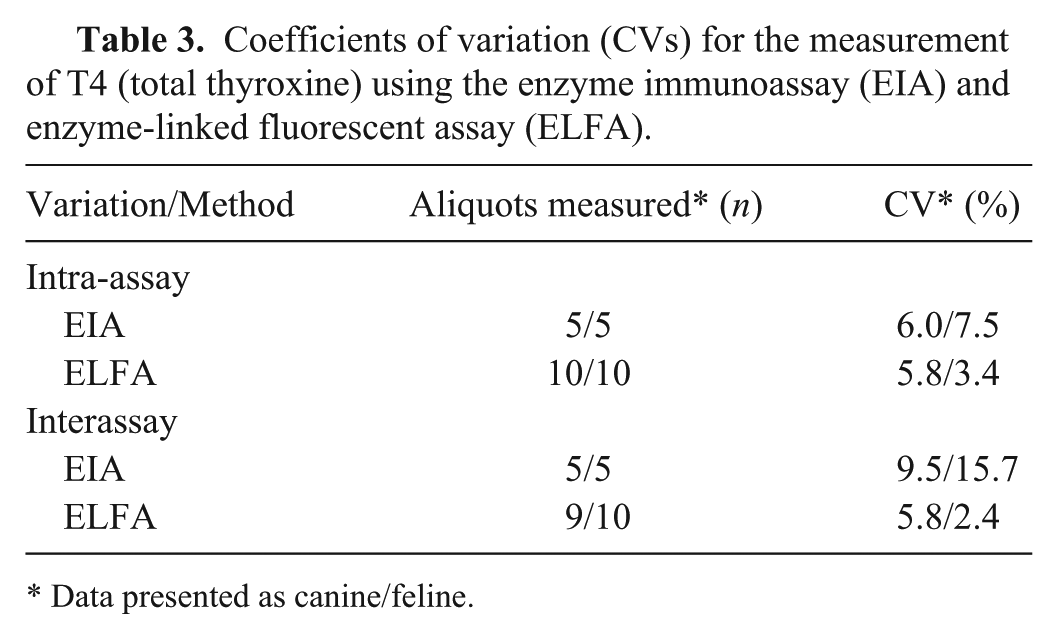
Data presented as canine/feline.
In order to establish T4 RIs for the ELFA, sera from an additional 81 healthy cats and 121 healthy dogs were examined. The cats were 2–20 y of age, with a median age of 11 y. The cats’ T4 values were 10.1–51.2 nmol/L. The calculated RI for cats was set at 13.3–49.6 nmol/L. The dogs were 1–13 y of age, with a median age of 4 y. The dogs’ T4 values were 7.4–44.4 nmol/L. The calculated RI for dogs was set at 10.1–42.9 nmol/L. T4 RIs for the EIA method provided by the external laboratory were 9–61.8 nmol/L for cats and 12.9–51.5 nmol/L for dogs.
Of the animals used for the method comparison study, 27 cats had been presented to the Clinic of Small Animal Medicine for routine annual health evaluation and were assessed to be healthy. They showed no signs of illness and no abnormalities on CBC and biochemistry profile. In these cats, we expected the T4 value to be in the normal range of the RI. The EIA provided T4 values in the expected range in all 27 cases (100%) and the ELFA in 24 of 27 cases (89%). Elevated T4 values were present in 3 cats.
Fourteen cats were assessed to have NTI. These cats were diagnosed with diseases other than hyperthyroidism, namely neoplasia (n = 8), gastrointestinal disease (n = 3), dermatologic disease (n = 1), and other diseases (n = 2). Their underlying disease was treated, and during the course of treatment no signs of hyperthyroidism were present. The EIA T4 values were within the RI in all 14 cases (100%) and the ELFA in 13 of 14 cases (93%). The T4 was increased in 1 cat.
Twenty-three cats were assessed as having untreated hyperthyroidism. Blood sampling took place when those patients were presented with signs consistent with hyperthyroidism. In 17 of these cats, fT4d had been measured and was elevated in all 17 (RI for fT4d: 9–30.1 pmol/L, range: 41.2–128 pmol/L, median: 101 pmol/L). Cats were treated orally with methimazole or carbimazole and showed resolution of their clinical and laboratory abnormalities on follow-up visits. The EIA T4 values were in the expected elevated range in 21 of 23 cases (91%) and the ELFA in 22 of 23 cases (96%). All other results of both methods were in the normal range of the RI.
Eleven cats were diagnosed with hyperthyroidism earlier and were currently under treatment with oral methimazole or carbimazole. The cats had complete resolution of their clinical and laboratory abnormalities at the time of blood sampling. These cats were expected to have a T4 value within the RI or slightly below. The EIA T4 values were in the expected range in all 11 cases and the ELFA in 10 of 11 cases (Table 4). The T4 was still elevated in 1 cat. Once clinical signs are controlled under treatment, one would expect the T4 value to be in the lower half of the RI. The EIA provided such results in 7 cases and the ELFA in 6 cases. In 8 of 11 cats, the results were within the same span of the RI when measured with the EIA and ELFA (in 5 cases both results were in the lower range and in 3 patients in the upper range).
Age and T4 (total thyroxine) range and median values for the enzyme immunoassay (EIA) and enzyme-linked fluorescent assay (ELFA) for the different groups in cats.
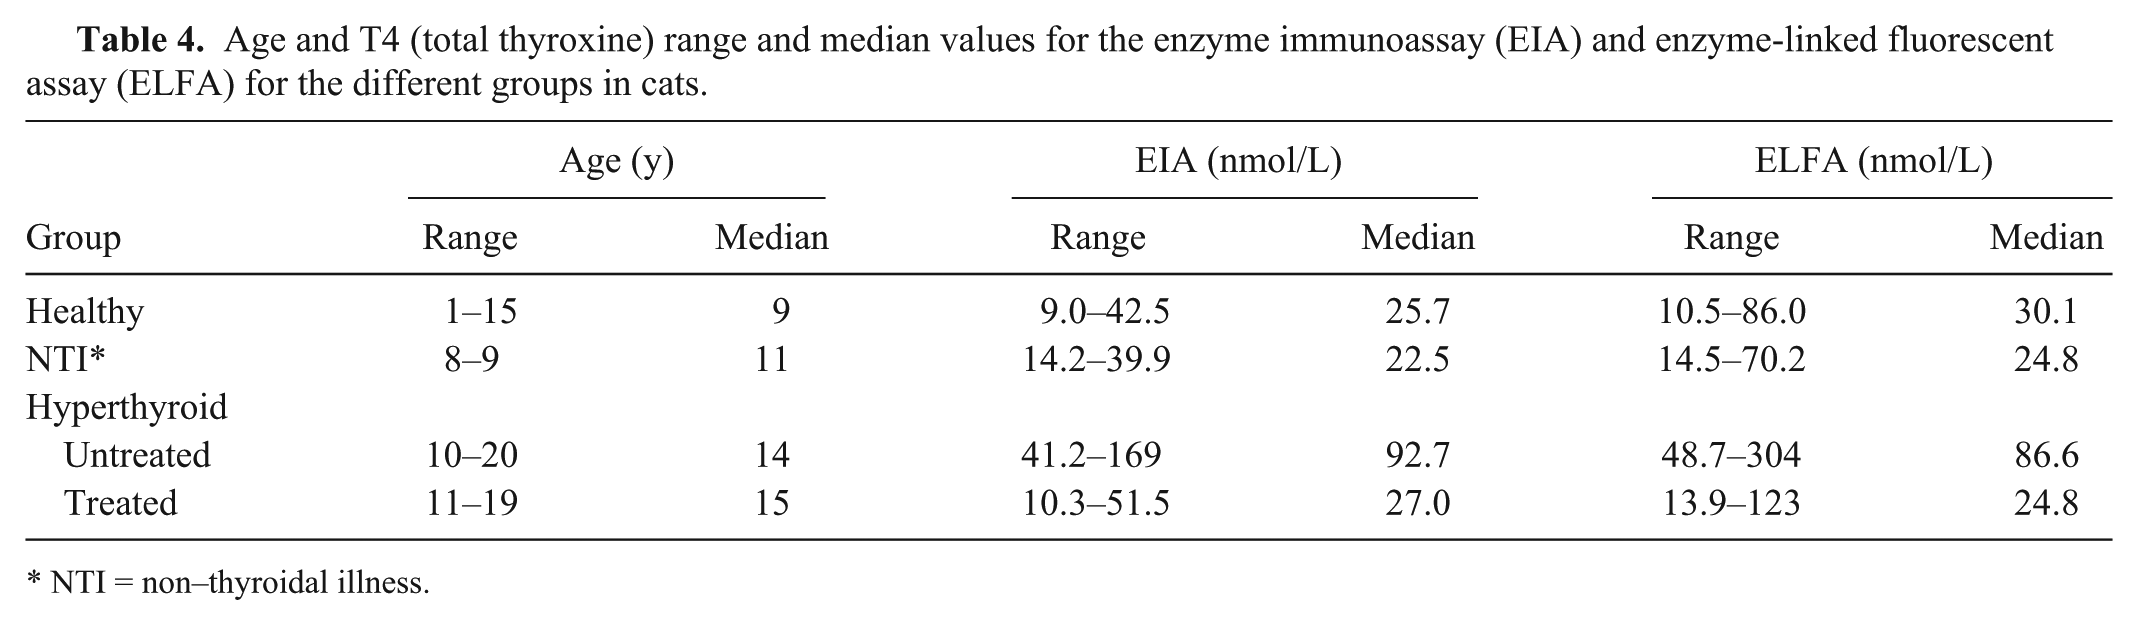
NTI = non–thyroidal illness.
Thirty-two dogs had been presented to the Clinic of Small Animal Medicine for routine annual health evaluation and were categorized as healthy. The dogs showed no signs of illness and no abnormalities on CBC and biochemistry profile. We expected the T4 value to be within the RI. The EIA provided T4 values in the RI in all 32 cases and the ELFA in 31 of 32 cases.
Six dogs were assessed to have NTI. These dogs were diagnosed with diseases other than hypothyroidism, namely cardiac disease (n = 3), other endocrine diseases (n = 2), and other diseases (n = 1). In 2 of the dogs, TSH was measured and yielded a low result (<0.5 ng/mL), and in 3 dogs, a TSH stimulation test had been performed 6 mo prior to our study and yielded normal stimulation. Their underlying disease was treated, and during the course of treatment no signs of hypothyroidism were present. In these dogs, we expected the T4 values to be within the RI or slightly below. Both the EIA and ELFA T4 values were as expected in all 6 cases. The EIA identified 3 of 6 dogs below RI and the ELFA 2 of 6. Both tests identified a low value in only 1 dog. Both tests identified a normal value in 2 dogs. In the other 3 patients, test results did not identify the same range (normal or below RI).
Three dogs were assessed as having untreated hypothyroidism. Blood sampling took place when those patients were presented with typical signs consistent with hypothyroidism. Of these, 1 had a normal TSH value but a low fT4d value (<4.8 pmol/L), and 1 had an elevated TSH concentration (1.06 µg/L). The third dog was diagnosed with macroadenoma of the pituitary gland, ischemic infarcts, and secondary Addison’s disease. Secondary hypothyroidism was highly suspected. Thus, its TSH concentration was low. The first 2 dogs were treated with oral thyroxine and showed resolution of their clinical and laboratory abnormalities. In all 3 dogs, we expected the T4 values to be low. The EIA T4 values were below the RI in all 3 cases and the ELFA in 2 of 3 cases. One test result was within the RI.
Seven hypothyroid dogs were currently under treatment with oral thyroxine. When the diagnosis was originally established, 5 dogs had an elevated TSH (>0.5 µg/L), and 2 dogs had a TSH within the RI. FT4d in those 2 dogs was low (<4.8 pmol/L). The dogs had complete resolution of their clinical and laboratory abnormalities at the time of blood sampling. These dogs were expected to have a T4 value within the RI or slightly above. The EIA T4 values were within the RI in all 7 cases and the ELFA in 6 of 7 cases. In 1 dog, the test result was below the RI. Two results were above the RI of the EIA and ELFA (same dogs).
Two dogs were diagnosed with iatrogenic hyperthyroidism (Table 5). Both had been diagnosed with hypothyroidism earlier by means of a TSH stimulation test. Both dogs were on a high dose of thyroxine (>20 mg/kg twice a day) and were fed with bone and raw food. Both dogs showed signs consistent with hyperthyroidism at the time of blood sampling. These signs resolved after a reduction of the thyroxine dose and a change to commercial dog food. In these dogs, elevated T4 values were expected. Both the EIA and ELFA T4 values were above RIs in both cases.
Age and T4 (total thyroxine) range and median values for the enzyme immunoassay (EIA) and enzyme-linked fluorescent assay (ELFA) for the different groups in dogs.
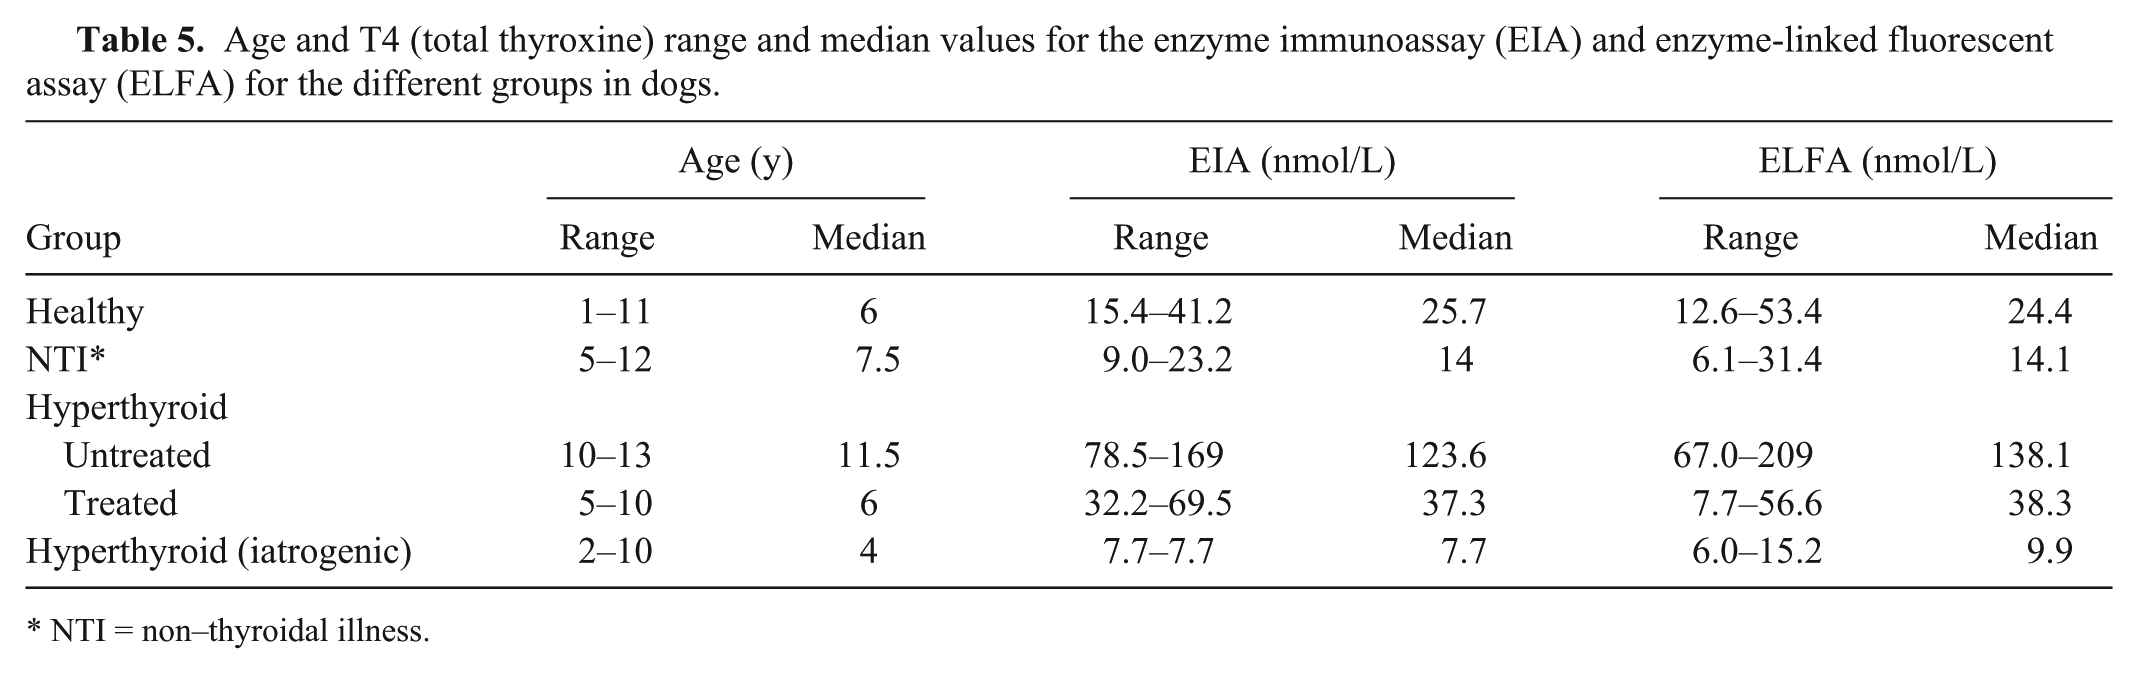
NTI = non–thyroidal illness.
Discussion
In cats and dogs, determination of total T4 concentration is accepted as the initial laboratory test when hypothyroidism or hyperthyroidism is suspected, and history, physical examination findings, and clinicopathologic data are indicative of either disease.22,25,27 Our study showed that the ELFA is a fast in-house method with high precision in feline and canine sera, and that its accuracy is acceptable given that the measured values correspond with the expected values in the majority of cases. The EIA precision for canine sera is very good, but is just on the edge of being acceptable in feline sera. However, its accuracy does not differ significantly from the accuracy of the ELFA. The methods cannot be used interchangeably, and individual RIs are needed.
Various method comparison studies have been performed using different criteria for the evaluation of agreement (Supplemental Table 1). A previous study 17 introduced guidelines for method comparison studies based on the Standards for Reporting of Diagnostic Accuracy (STARD) Initiative 6 that is widely accepted and has been used in more recent studies. 23 The correlation coefficient should not be used as a measure of agreement as it does not assess agreement but association, and a high correlation does not necessarily guarantee good agreement. 5 Nevertheless, a high correlation was often interpreted as good agreement in early method comparison studies.14,20,27 As the Pearson method is still mentioned in the majority of agreement studies, it was also performed in our study. Although significant results were obtained, the correlation coefficients were not high enough to suggest good agreement between the 2 methods. Unlike linear regression, Passing–Bablok regression is considered useful for comparing clinical methods because it allows measurement errors (imprecision) in both the X and Y variables, does not assume that measurement errors occur in normally distributed data, and is robust against outliers.1,26 The authors of a method comparison review paper 17 suggest the usage of Passing–Bablok regression when Pearson r < 0.975, which was the case in our study. For both species, the CUSUM test did not show significant deviations from linearity. Only in dogs, examination of Passing–Bablok regression analysis revealed that the ELFA showed both constant and proportional error when compared to the EIA. Bland–Altman analysis was performed because linear regression analysis alone is not always suitable for method agreement studies. The difference between the methods was plotted against the mean of the methods. This is recommended especially in cases in which none of the methods is considered to be a “gold standard.” 17 Currently, most laboratories use nonradioactive CIAs to measure T4 in dogs and cats. 18 In the past, RIA was considered to be a criterion-referenced standard.19,27,30
Data obtained by the Bland–Altman plot identified no overall bias in cats. But the 95% limits of agreement for all feline T4 values were clinically unacceptable. In dogs, data obtained by the Bland–Altman plot also identified no overall bias. The 95% limits of agreement for all canine T4 values were also wide, hampering acceptability of this test if results of the ELFA are compared directly to the EIA. Therefore, judging from the 95% limits of agreement in both Bland–Altman plots, the EIA and ELFA methods would neither agree in cats nor in dogs, and the methods cannot be used interchangeably.
As a direct comparison of test results was not possible, a full validation of the ELFA and, in parts, also of the EIA, was performed, implying assessment of imprecision and accuracy. When aliquots of the same sample are analyzed by 2 different methods, a variation in results of >15% is considered inappropriate according to most of the industry’s bioanalytical guidelines (https://goo.gl/VhxQ62). The CVs in our study were very low for the ELFA (2.4–5.8%) and low for the EIA (6.0–9.5%). Only the CV for the EIA inter-assay variation in cats (15.7%) was somewhat higher, and is above the maximum acceptable CV of 15%. The CVs of the ELFA indicate very good precision as they were markedly below the maximum acceptable CV and also below the CVs of many previous T4 method comparison studies.14,18,31,33 The ELFA and EIA both measure T4 linearly if samples are being diluted.
The calculated RI for the ELFA and the given RI for the EIA (provided by the reference laboratory) overlapped, but for both species the range for the ELFA was narrower. Standards of minimal patient numbers for calculating RIs have been met for dogs, but were not possible for cats. Therefore, in order to set up a RI, a robust statistical method was used. The clinical significance of a method’s accuracy is most important when a method is being evaluated. 9 From a clinical standpoint, it would be sufficient if an animal is correctly identified as being healthy or diseased. This approach has been implemented in our study by assessing if the measured T4 value would correspond with the expected T4 range of a patient that was based on history, clinical presentation, other laboratory tests (usually hematologic and biochemical evaluation and other endocrine test results [endogenous TSH and fT4d]), as well as response to therapy assessed at follow-up visits. Overall, both methods yielded acceptable results, but the EIA was more accurate than the ELFA.
For the 75 cats, EIA results matched the expected range in 97% of cases and ELFA results in 92% of cases. For the 50 dogs, EIA results matched the expected range in 100% of cases and ELFA results in 94% of cases. However, fewer than 10 patients were available for the untreated and treated hypothyroid and iatrogenic hyperthyroid group in dogs. This low case number makes an adequate judgement of test accuracy in the dog more difficult. In all other animals that were used for the method comparison, the expected T4 range could not be predicted retrospectively with certainty because follow-up was not available, clinical signs (potentially being associated with thyroid disease) persisted, or concurrent disease was present. In most of the remaining cats at the time of T4 analysis with the EIA, hyperthyroidism was excluded based on a normal T4 result and identification of another disease process explaining the presenting signs. However, those cats were excluded from the accuracy analysis if no follow-up was available, as it is possible that hyperthyroidism was present concurrently with another disease. The majority of dogs that were excluded from accuracy analysis had been presented for dermatologic problems. At the time of submission of the T4 by the EIA method, endogenous TSH was also assessed. If TSH was low and T4 was in the RI or slightly below, hypothyroidism was not thought to be a differential diagnosis. If clinical signs persisted or follow-up was not available, it was not possible to score the expected T4 in those animals as dogs with hypothyroidism can have normal or low TSH levels. Other dogs were already receiving thyroxine replacement therapy but had uncontrolled concurrent disease. In those dogs, it was also not possible to predict their T4 status. Overall, the EIA and ELFA methods can be recommended for the determination of T4 in feline and canine sera; however, the EIA will more often yield results that are consistent with the expected value.
The price for one T4 measurement obtained by the ELFA is ~7€ (~8 US$ at the time of manuscript preparation) per test, which is considerably lower than the price of an analysis with conventional methods performed at a commercial laboratory in our area.
The following limitations of the study must be addressed. First, the 2 methods have slightly different measurement ranges. The minimum detectable limit of the ELFA was lower than that of the EIA (ELFA: 6.0 nmol/L [0.46 µg/dL] vs. EIA: 9.0 nmol/L [0.7 µg/dL]). The ELFA measured T4 concentrations below the detection limit of the EIA in 10 cases. For statistical analysis, these measurements had to be removed from analysis because no absolute number was available for the EIA method. Second, the samples for the ELFA had been frozen and stored at −20°C until analysis. Previous studies indicate that sample storage in plastic tubes at −20°C for up to 3 mo as well as repeated freezing and thawing of samples over a period of 8 d does not alter T4 values in dogs.3,32 Moreover, stability of T4 was proven in samples stored at 4°C and room temperature (22–26°C) for up to 5 d. 3 None of the samples have been stored at room temperature for >36 h as collection and analysis of the samples was performed within 36 h by the commercial laboratory. Third, the ELFA was only compared with the EIA method, and we did not use any other method of measurement for T4 (RIA or CEIA) in our method comparison study. In previous studies, both RIA and CEIA have served as standard methods. To overcome the problem of an unavailable gold standard, we compared results of both methods to an expected T4 range (low, normal, or elevated) of a patient. This expected range was based on history, clinical presentation, other laboratory tests, and response to therapy. Fourth, the RI of the ELFA in cats was calculated with less than the recommended number of ≥120 patients. This was addressed by using a robust method within the statistical software. This method has been established especially for studies where <120 patients are available. Fifth, there were only small numbers of patients for some groups in dogs (n < 10), potentially hampering adequate assessment of accuracy in both methods.
Footnotes
Acknowledgements
We thank the laboratory staff members of the Clinic of Small Animal Medicine, Ludwig Maximilian University for their support.
a.
Vidas T4, bioMérieux, Marcy l’Etoile, France.
b.
miniVidas automated analyser, bioMérieux, Marcy l’Etoile, France.
c.
DRI thyroxine (T4) assay, Microgenics, Thermo Scientific, Fremont, CA.
d.
Modular P-Module, Roche, Basel, Switzerland.
e.
MedCalc for Windows v. 14.12.0, MedCalc Software, Ostend, Belgium.
Declaration of conflicting interests
The author(s) declared no potential conflicts of interest with respect to the research, authorship, and/or publication of this article.
Funding
The author(s) received no financial support for the research, authorship, and/or publication of this article.
References
Supplementary Material
Please find the following supplemental material available below.
For Open Access articles published under a Creative Commons License, all supplemental material carries the same license as the article it is associated with.
For non-Open Access articles published, all supplemental material carries a non-exclusive license, and permission requests for re-use of supplemental material or any part of supplemental material shall be sent directly to the copyright owner as specified in the copyright notice associated with the article.