
Abstract
Previous studies have determined that, compared to whole blood, serum or plasma used in a portable blood glucometer (PBG) may provide more accurate results. We investigated the accuracy of a veterinary PBG (AlphaTRAK 2; Zoetis) for the measurement of glucose concentrations in serum, plasma, and whole blood compared to plasma glucose concentration measured by a biochemical analyzer. Blood samples from 53 client-owned dogs were collected. Lin concordance correlation coefficient (ρc) and Bland–Altman plots were used to determine correlation and agreement between the results obtained for the different sample types. Glucose concentration in whole blood measured by the veterinary PBG was more strongly correlated with the glucose concentration measured by the biochemical analyzer (ρc = 0.92) compared to plasma and serum glucose concentrations (ρc = 0.59 and 0.57, respectively). The mean differences between the glucose concentrations in whole blood, plasma, and serum measured by the veterinary PBG and the glucose concentration determined by the biochemical analyzer were 1.0, 6.3, and 6.7 mmol/L (18, 113, and 121 mg/dL), respectively. Our findings suggest that, when using this veterinary PBG, the accuracy of a glucose measurement obtained is higher when using whole blood compared to plasma or serum. Use of whole blood allows for more correct assessment and diagnosis, which are necessary for appropriate therapeutic intervention.
Blood glucose concentration is measured frequently in dogs, given that many diseases are associated with hypoglycemia and hyperglycemia. Use of a biochemical analyzer is the gold standard for determining blood glucose concentration. Most clinicians have access to a biochemical analyzer; however, potential disadvantages of the method include the need for a larger sample size, longer turnaround time, and cost to the client.
Portable blood glucometers (PBGs) are small, handheld devices that allow for quick, cost-effective, and easy obtainment of blood glucose concentrations in canine patients in the hospital and home setting in patients with glucose homeostatic disorders such as diabetes mellitus. 2 Given that blood glucose measurements are employed to alter insulin dose and that inappropriate changes can have life-threatening implications, accuracy is crucial.
Glucometers are replacing biochemical analyzers in the emergency setting. Human PBGs are often utilized in the veterinary setting for clinical decision-making. Several studies have evaluated the accuracy of human PBGs for obtaining blood glucose measurements in dogs, and results have been variable. Although some studies determined that treatment decisions would likely be unaltered if a human PBG was used,6,8,9,18 others found substantial differences in accuracy, which could lead to altered treatment decisions.1,3,4,7 Veterinary PBGs marketed for use in non-human species are available. Overall, veterinary PBGs are more accurate for measurement of glucose in dogs.3,8,9 However, some studies have found that veterinary PBGs can be inaccurate in dogs and lead to inappropriate clinical interpretation.3,7,9 Therefore, careful assessment of PBGs, even those developed for use in veterinary species, is needed.
Many factors affect PBG accuracy, 15 and RBC interference with measurement of glucose concentration by PBG is well recognized. 14 Sample optimization may be possible to obtain the most accurate results. For example, despite the recommendation by the manufacturers to use whole blood, use of serum or plasma compared to whole blood yielded more accurate results for measurement of glucose concentrations in dogs for several human PBGs.1,17 On the other hand, use of plasma in a PBG cannot be assumed to be the better sample type because even small changes between models can alter which sample type is optimal. 11 To our knowledge, the effect of sample type on accuracy of blood glucose measurements has not been assessed using a veterinary PBG. Although glucometers are often used at home where plasma or serum cannot be obtained, if the use of serum or plasma provided more accurate results with a consistent bias, a formula could be created by which concentrations obtained at home on whole blood samples could be corrected.
We investigated the accuracy of a veterinary PBG for measurement of glucose concentrations in whole blood of dogs compared to glucose concentration measured by a biochemical analyzer. In addition, we sought to determine if use of plasma or serum compared to whole blood would optimize the results of the veterinary PBG. We hypothesized that the accuracy of the results obtained with the veterinary PBG would be greater when using serum or plasma samples compared to whole blood.
Materials and methods
Animals
Our study was performed between May 2016 and April 2017. We enrolled client-owned dogs examined at the Auburn University (AU) College of Veterinary Medicine (Auburn, AL, USA) that were presented for clinical reasons unrelated to the study and that required blood to be drawn for diagnostic purposes. Signalment and reason for hospital visit were not considered, but samples from diabetic dogs were sought. Some samples were convenience samples obtained in the course of routine standard clinical patient care, and blood used was the residual remaining after diagnostic samples were obtained. For samples that were drawn specifically for the study, the study protocol was approved by the AU Clinical Research Review Committee and the AU Institutional Animal Care and Use Committee, and all blood samples were obtained following client consent; for convenience samples, specific client consent and approval were not required. The exclusion criterion was the existence of concern that performing a venipuncture to obtain a blood sample would be detrimental.
Sample size calculation
A power calculation was performed using a 2-sided paired t-test to determine the number of samples necessary to detect a difference of ≥0.83 mmol/L (>15 mg/dL) between glucose concentrations determined by the biochemical analyzer and by the veterinary PBG. The calculation was based on the mean ± SD glucose concentration used to establish the reference interval (RI) for the biochemical analyzer. Assumptions made were a power of 0.8, type 1 error rate of 0.05, correlation of 0.7, and a ratio of 1 between the veterinary PBG and the biochemical analyzer results. The minimum sample size was determined to be 44 dogs.
Experimental protocol
Immediately following each blood draw, blood was placed in a standard tube containing lithium heparin for submission to the AU Clinical Pathology Laboratory, and a drop of whole blood was analyzed by the veterinary PBG (AlphaTRAK 2; Zoetis); blood was also used to fill a heparinized capillary tube and a non-heparinized capillary tube. The capillary tubes were centrifuged within 5 min after collection to determine the packed cell volume (PCV) and to harvest serum (non-heparinized tube) and plasma (heparinized tube) to obtain a glucose concentration measured by the veterinary PBG. Within 10 min following each blood draw, heparinized plasma was submitted to the AU Clinical Pathology Laboratory for determination of the glucose concentration with a biochemical analyzer (Cobas c311; Roche), which was considered the gold standard.
PBG
A single unit of the veterinary PBG was dedicated to the study and used for all measurements. The veterinary PBG uses glucose dehydrogenase and a coulometric electrochemical method to measure glucose concentration in a linear range of 1.1–41.7 mmol/L (20–750 mg/dL). The average coefficient of variation of the PBG for dogs is 5.2% per the manufacturer. Any concentration that measured ≥41.7 mmol/L (750 mg/dL) was recorded as 41.7 mmol/L (750 mg/dL). One author (E. Carlson) obtained blood samples and operated the veterinary PBG. Briefly, the veterinary PBG–specific test strip was inserted into the meter. A 0.3-μL sample then was applied directly to the test strip and a result obtained. The veterinary PBG was operated as specified by the manufacturer’s guidelines, apart from using plasma and serum samples as well as whole blood. The veterinary PBG was calibrated according to the manufacturer’s directions using the provided control solution when a new box of test strips was opened. Each test strip box contained 50 test strips; therefore, 16 dogs were tested using 1 box. All 3 test strips needed for an individual dog came from a single box of test strips.
Biochemical analyzer
The biochemical analyzer quantified blood glucose concentration via hexokinase and a photometric method to measure glucose concentration in a linear range of 0.1–41.7 mmol/L (2–750 mg/dL). The analyzer required 50 μL of plasma. The RI for blood glucose established by the laboratory for dogs was 4.2–6.4 mmol/L (76–116 mg/dL), consistent with euglycemia; values <4.2 mmol/L (76 mg/dL) and >6.4 mmol/L (116 mg/dL) being consistent with hypoglycemia and hyperglycemia, respectively.
Statistical analysis
The distributions of the glucose concentration for each sample type (whole blood, plasma, and serum) and analyzer (veterinary PBG and biochemical analyzer) were assessed for normality by utilizing the Shapiro–Wilk test and were determined not to be normally distributed; results are reported as median and range. Concentrations measured on the veterinary PBG using whole blood, plasma, and serum, and concentrations measured by the biochemical analyzer were compared using a repeated-measures ANOVA on ranks. A post-hoc test using the Dunnett method was performed, using the concentrations measured by the biochemical analyzer as the control group. For whole blood measurements, the differences between the veterinary PBG reading and the gold standard result were compared by use of a signed rank test for samples that were euglycemic and hyperglycemic, as determined by the gold standard method.
Lin concordance correlation coefficients (ρc) 12 and Bland–Altman plots were used to determine correlation and agreement between the results obtained in the different sample types. Additionally, Lin concordance correlation was used to evaluate the association of low and RI PCV on whole blood samples taken with the veterinary PBG to the blood glucose obtained by the biochemical analyzer. The RI for PCV was defined as 0.39–0.59 L/L, with anemia being defined as a PCV <0.39 L/L. For each Lin concordance correlation analysis, the coefficient and associated 95% confidence interval (CI) and bias, defined as the absolute difference of blood glucose concentration obtained by the veterinary PBG versus glucose concentration obtained by the biochemical analyzer, were generated. For ρc, a value of >0.99 was considered almost perfect, >0.95–0.99 was considered substantial, 0.90–0.95 was considered moderate, and <0.9 was considered poor. 6 The Clarke error grid (EG) analysis was performed to assess clinical accuracy for all sample types (whole blood, plasma, and serum) against the biochemical analyzer. All analyses were performed using Python (https://www.python.org/), Statistical Calculators (https://niwa.co.nz/our-services/online-services/statistical-calculators), and Excel 2016 (Microsoft). Values of p ≤ 0.05 were considered significant.
Results
Glucose concentration was measured in blood samples obtained from 53 client-owned dogs via the veterinary PBG and biochemical analyzer. Each dog was sampled once. Median age for the dogs was 9 y (range: 0.5–16 y). Median weight was 9.3 kg (range: 1.7–52 kg). We included in the study 4 each of Chihuahuas, Yorkshire Terriers, and Maltese; 3 each of Labrador Retrievers, Miniature Schnauzers, Shih Tzus, and mixed breeds; 2 each of Pomeranians, Cocker Spaniels, Golden Retrievers, German Shepherd Dogs, and Weimaraners; and 1 each of the following breeds: English Bulldog, Australian Shepherd, Brittany Spaniel, Cairn Terrier, Toy Poodle, Miniature Poodle, Border Collie, Standard Schnauzer, Boston Terrier, Boxer, Bouvier des Flandres, Scottish Terrier, Dachshund, Beagle, French Bulldog, Shetland Sheepdog, Pembroke Welsh Corgi, Cavalier King Charles Spaniel, and Jack Russell Terrier. Twenty-two castrated males, 28 spayed females, and 3 intact females were included.
The glucose concentration measured with the biochemical analyzer was within the RI for 36 samples (68%), was >6.4 mmol/L (116 mg/dL) for 16 samples (30%), and was <4.2 mmol/L (76 mg/dL) for 1 sample (2%). The PCV of the hypoglycemic sample was 0.38 L/L. Three whole blood samples were noted to be in the hypoglycemic range on the veterinary PBG (1 measured 2.6 mmol/L [47 mg/dL] and 2 measured 3.9 mmol/L [71 mg/dL]). The corresponding concentrations when measured by the biochemical analyzer were 2.2 (39 mg/dL), 4.4 (80 mg/dL), and 4.6 mmol/L (83 mg/dL; i.e., 2 were in the RI); the PCVs for the 2 samples that were in the RI were 0.50 and 0.56 L/L, respectively. For the 37 samples noted to be within the RI when measured by the biochemical analyzer, the corresponding number of plasma and serum samples on the veterinary PBG that were noted to be >6.4 mmol/L (116 mg/dL) were 36 of 37 (97%) and 37 of 37 (100%) samples, respectively. For the one sample noted to be hypoglycemic per the automated biochemical analyzer, the corresponding glucose concentration measured in whole blood and plasma by the veterinary PBG was also in the hypoglycemic range. Conversely, the corresponding serum sample concentration was within the euglycemic range.
The glucose concentrations measured in plasma and serum readings on the veterinary PBG were significantly (p < 0.001; Table 1) different than the concentration measured by the biochemical analyzer; concentrations measured in whole blood on the veterinary PBG were not significantly different from the concentrations measured by the biochemical analyzer. Using Bland–Altman analyses, the mean differences between the glucose concentrations in whole blood, plasma, and serum measured by the PBG and the glucose concentration determined by the biochemical analyzer were 1.0 (18 mg/dL), 6.3 (113 mg/dL), and 6.7 mmol/L (121 mg/dL), respectively (Table 2, Fig. 1). Additionally, glucose concentration in whole blood measured by the veterinary PBG was more strongly correlated with the glucose concentration measured by the biochemical analyzer (ρc = 0.92) compared to plasma and serum glucose concentrations (ρc = 0.59 and 0.57 for plasma and serum, respectively; Table 2). In whole blood, the median difference between the veterinary PBG and gold standard results for samples that were euglycemic as judged by the gold standard method was 0.3 mmol/L (6 mg/dL); the median difference for samples that were hyperglycemic was 0.9 mmol/L (15.5 mg/dL). The differences were not significantly different (p = 0.317).
Glucose concentration measured in whole blood, serum, and plasma from 53 dogs by a veterinary portable blood glucometer (PBG) and the plasma glucose concentration measured by a biochemical analyzer.
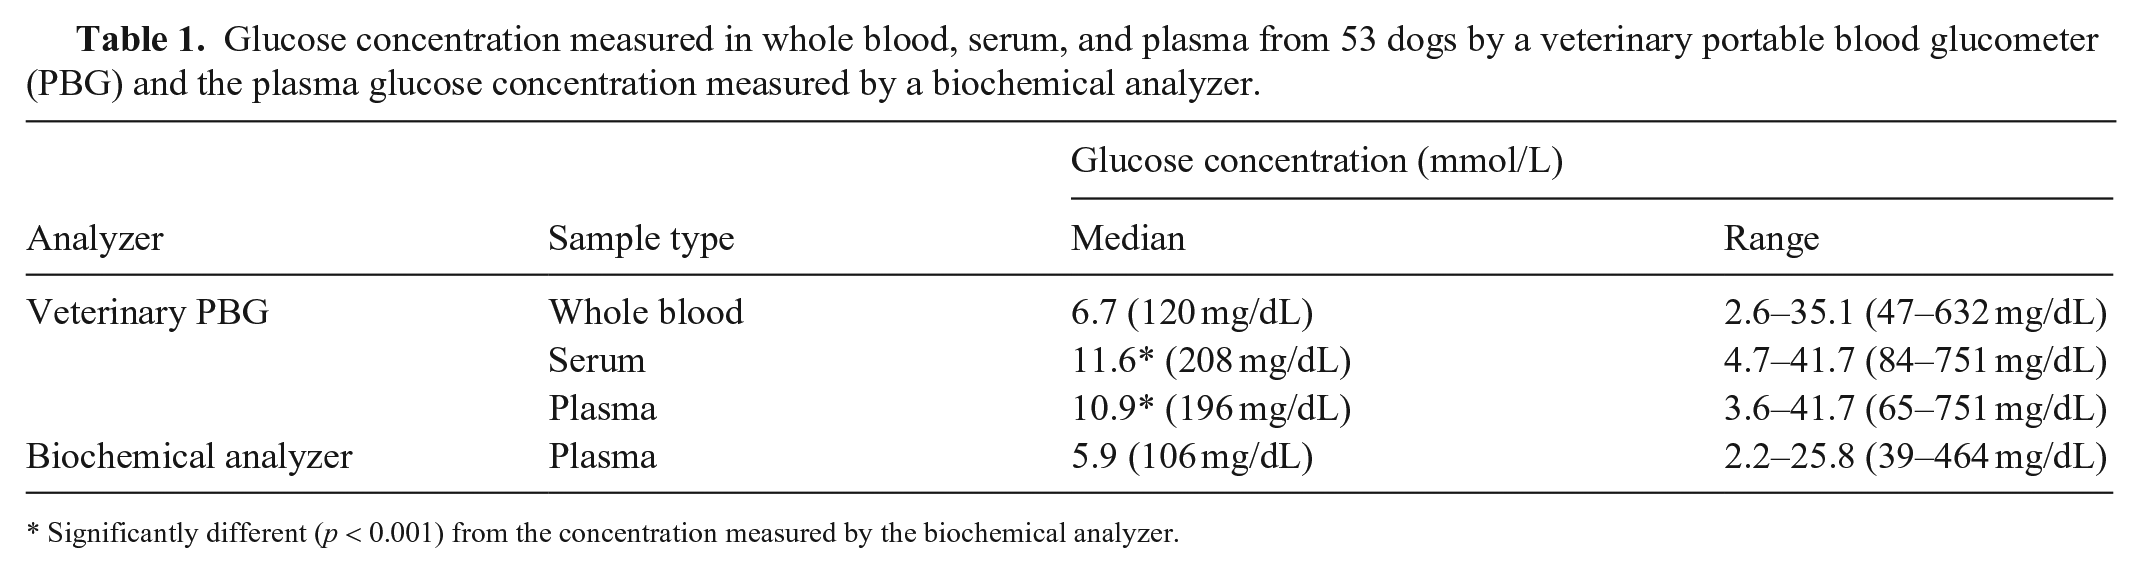
Significantly different (p < 0.001) from the concentration measured by the biochemical analyzer.
Results of the Lin concordance correlation analyses (ρc) and bias by Bland–Altman plots between glucose concentrations measured in whole blood, plasma, and serum from 53 dogs by the veterinary portable blood glucometer (PBG) and glucose concentration measured by an automated biochemical analyzer.
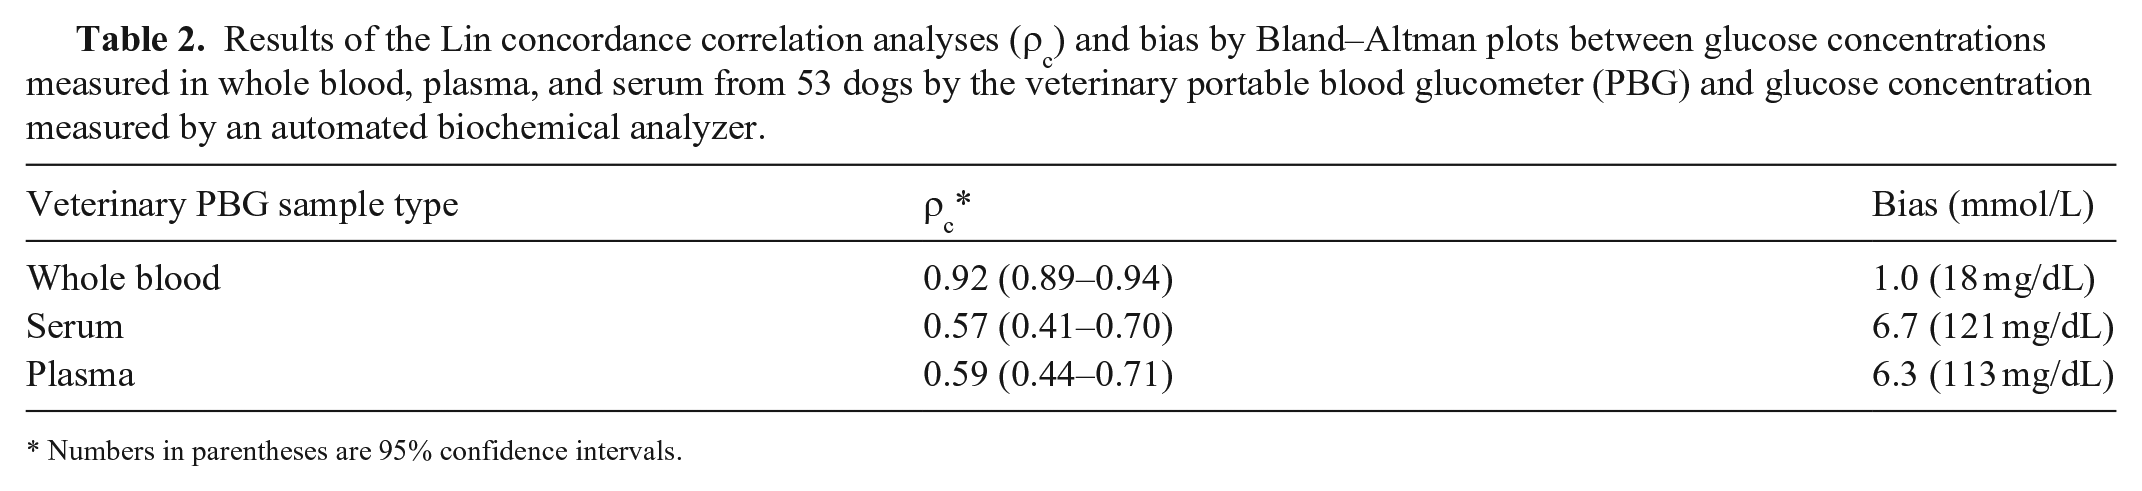
Numbers in parentheses are 95% confidence intervals.
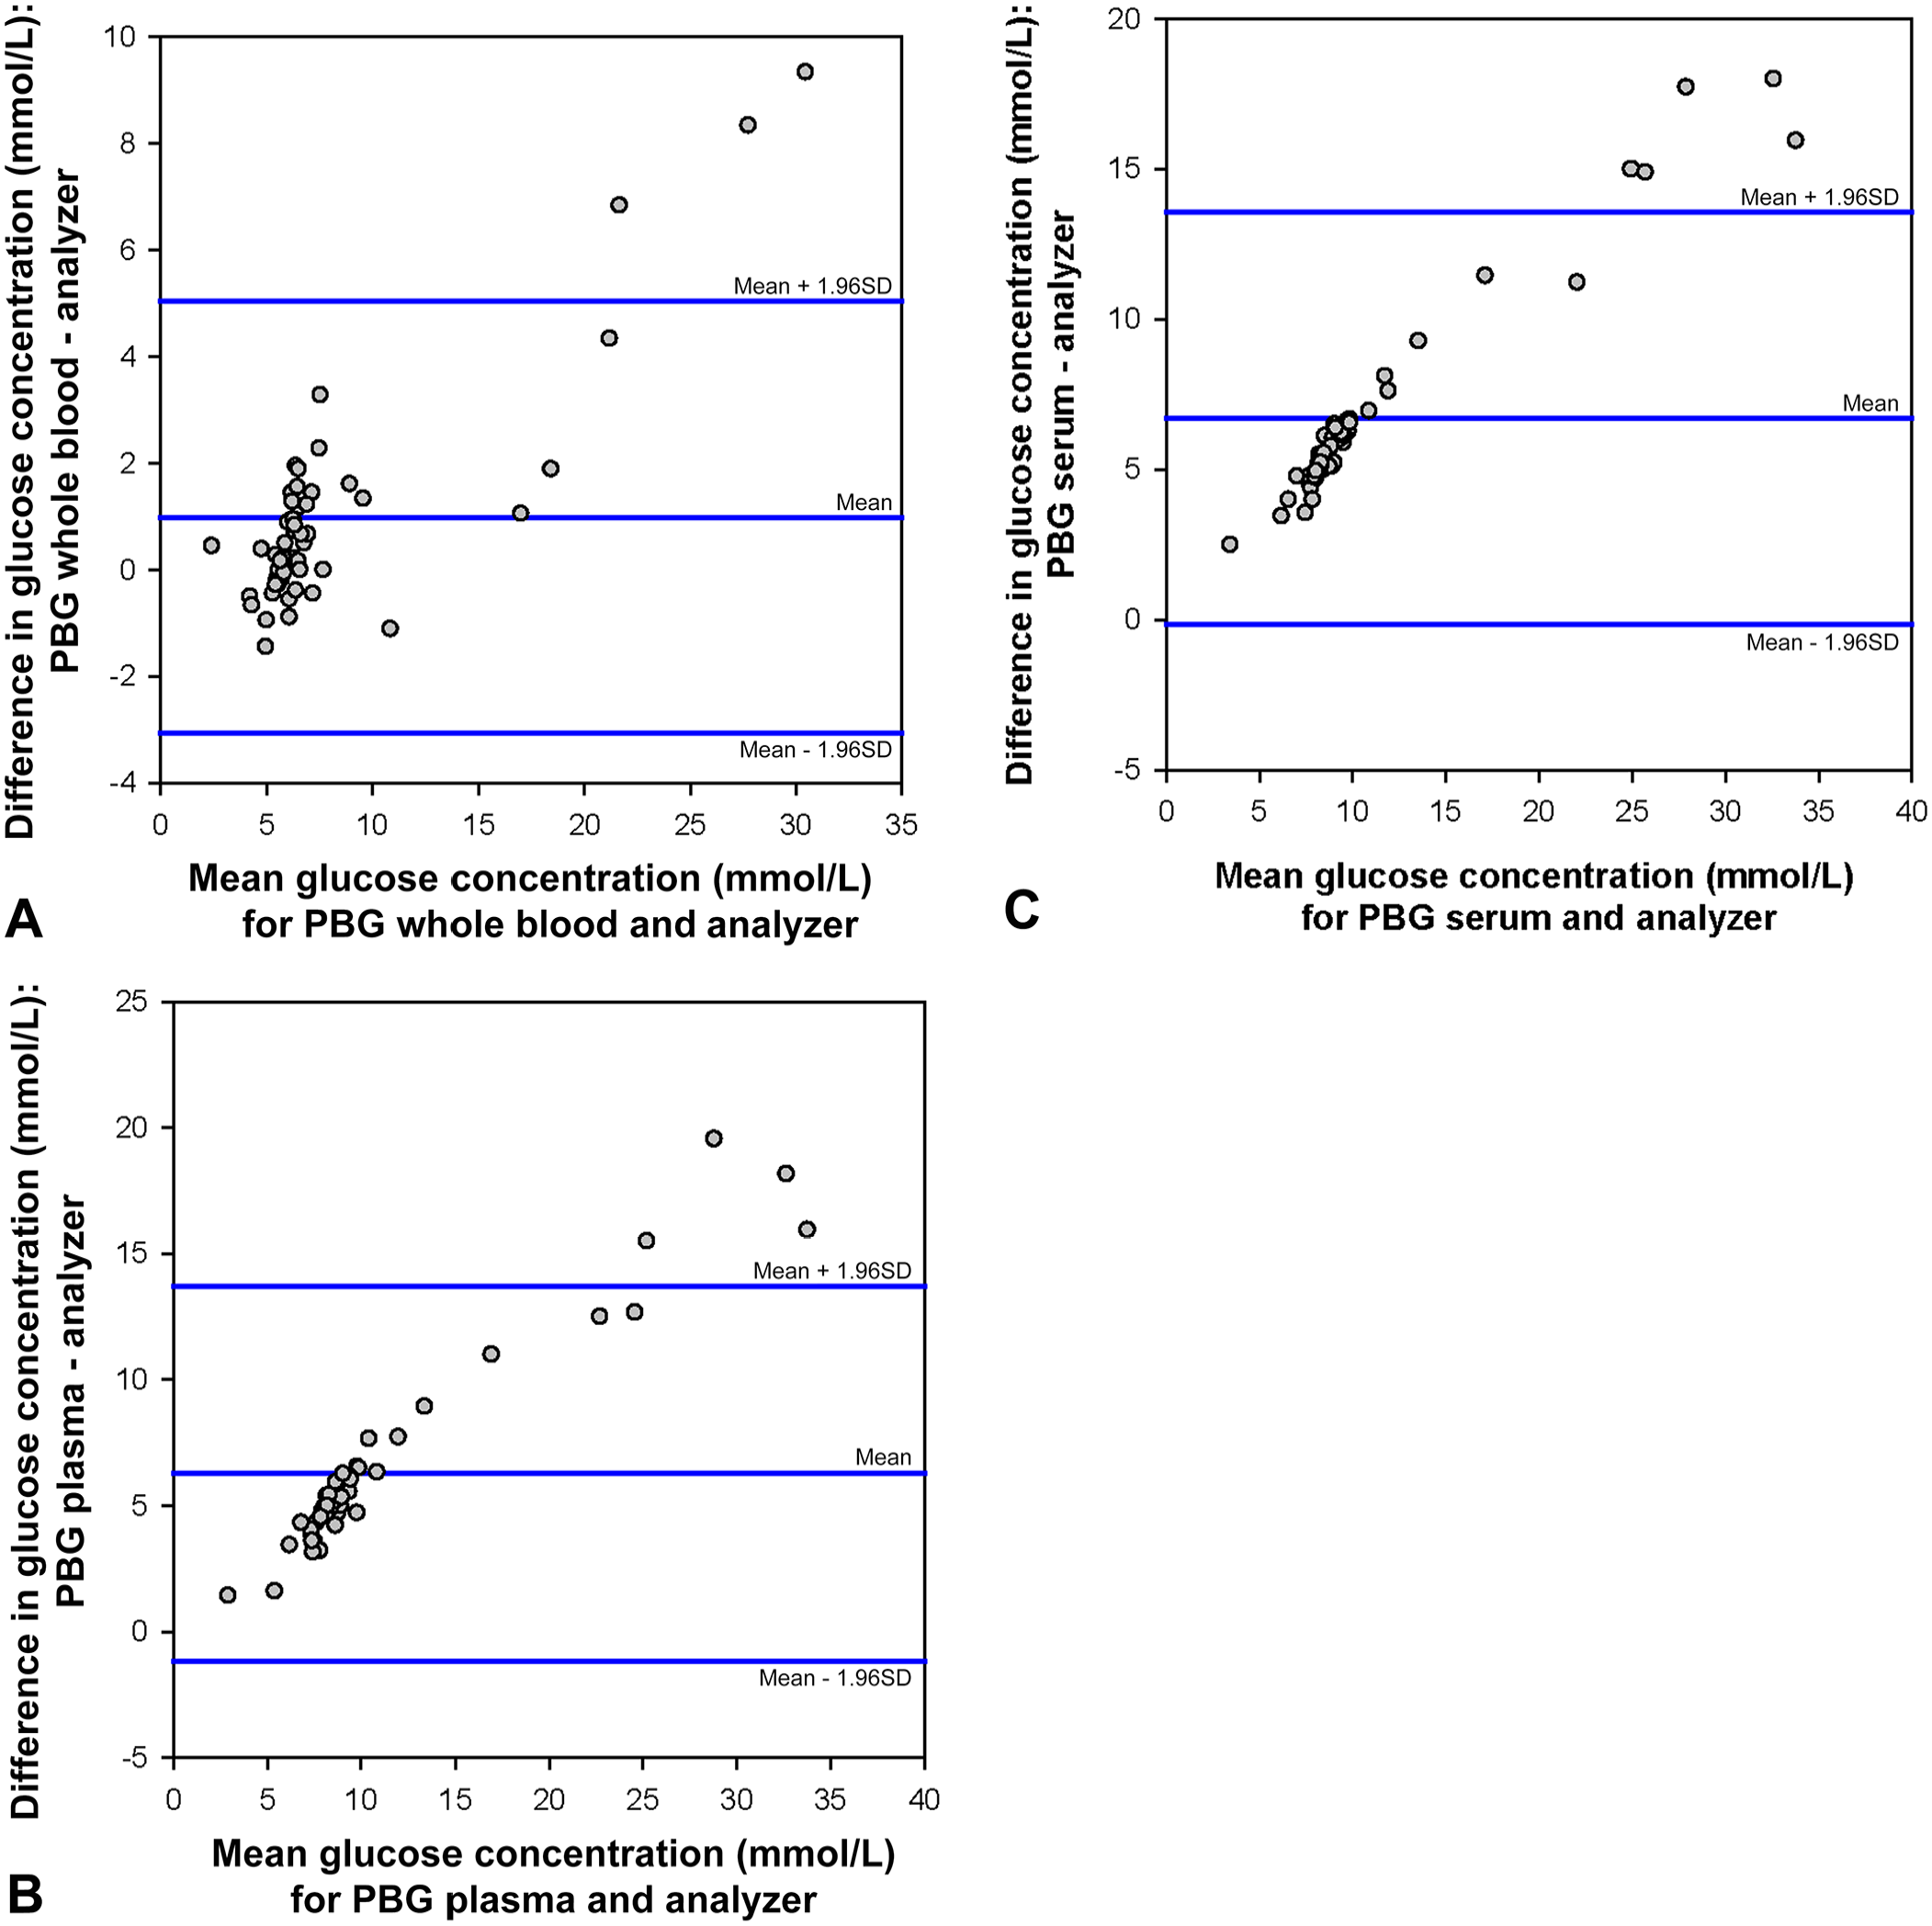
Bland–Altman plots depicting the difference between the glucose concentration in
For the EG analysis, zones A–E represent different clinical consequences of a discrepancy in obtained blood glucose measurement. The gold standard concentration is plotted against the concentration measured by a different method (i.e., a PBG). Resulting data points can fall into 1 of 5 zones. If a point falls in zone A, the PBG result deviates from the reference method by <20%, and the discrepancy between the methods would have no effect on clinical outcome. If a point falls in zone B, the PBG result deviates from the reference method by >20%, and the clinical decision would be different but likely with no effect on clinical outcome. Zone C represents an altered clinical action with a likely effect on clinical outcome. Specifically, overcorrecting an acceptable blood glucose value if a point falls in upper zone C and failing to correctly increase the insulin dose if a point falls in lower zone C. Zone D represents an altered clinical action with the potential for significant medical risk where the reference method value is outside the clinically acceptable level but the PBG result fell into the clinically acceptable level. Zone E represents an altered clinical action that could lead to dangerous consequences because the PBG result is opposite to the reference method result. For whole blood samples measured on the PBG, the vast majority of data points occurred in zones A and B and a small number fell into zone D (Table 3, Fig. 2). For plasma and serum, the opposite was true; a minority of data points fell in zones A and B with the majority falling in zone D.
Percent of blood glucose concentrations as measured by a veterinary portable blood glucometer falling within zones A–E on Clarke error grid analysis for whole blood, plasma, and serum samples compared to an automated biochemical analyzer.
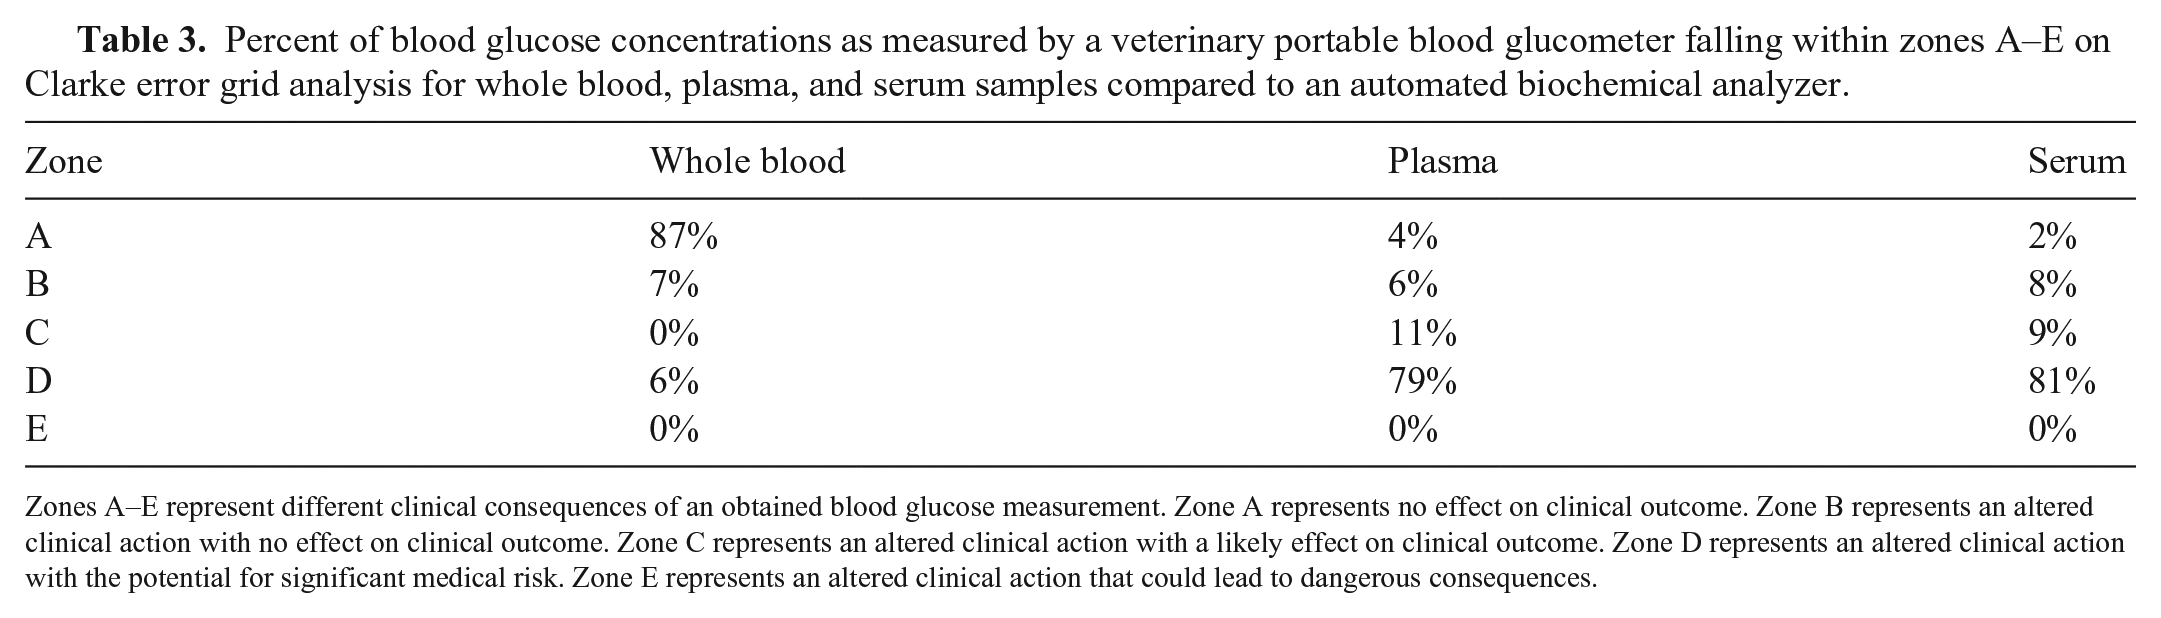
Zones A–E represent different clinical consequences of an obtained blood glucose measurement. Zone A represents no effect on clinical outcome. Zone B represents an altered clinical action with no effect on clinical outcome. Zone C represents an altered clinical action with a likely effect on clinical outcome. Zone D represents an altered clinical action with the potential for significant medical risk. Zone E represents an altered clinical action that could lead to dangerous consequences.
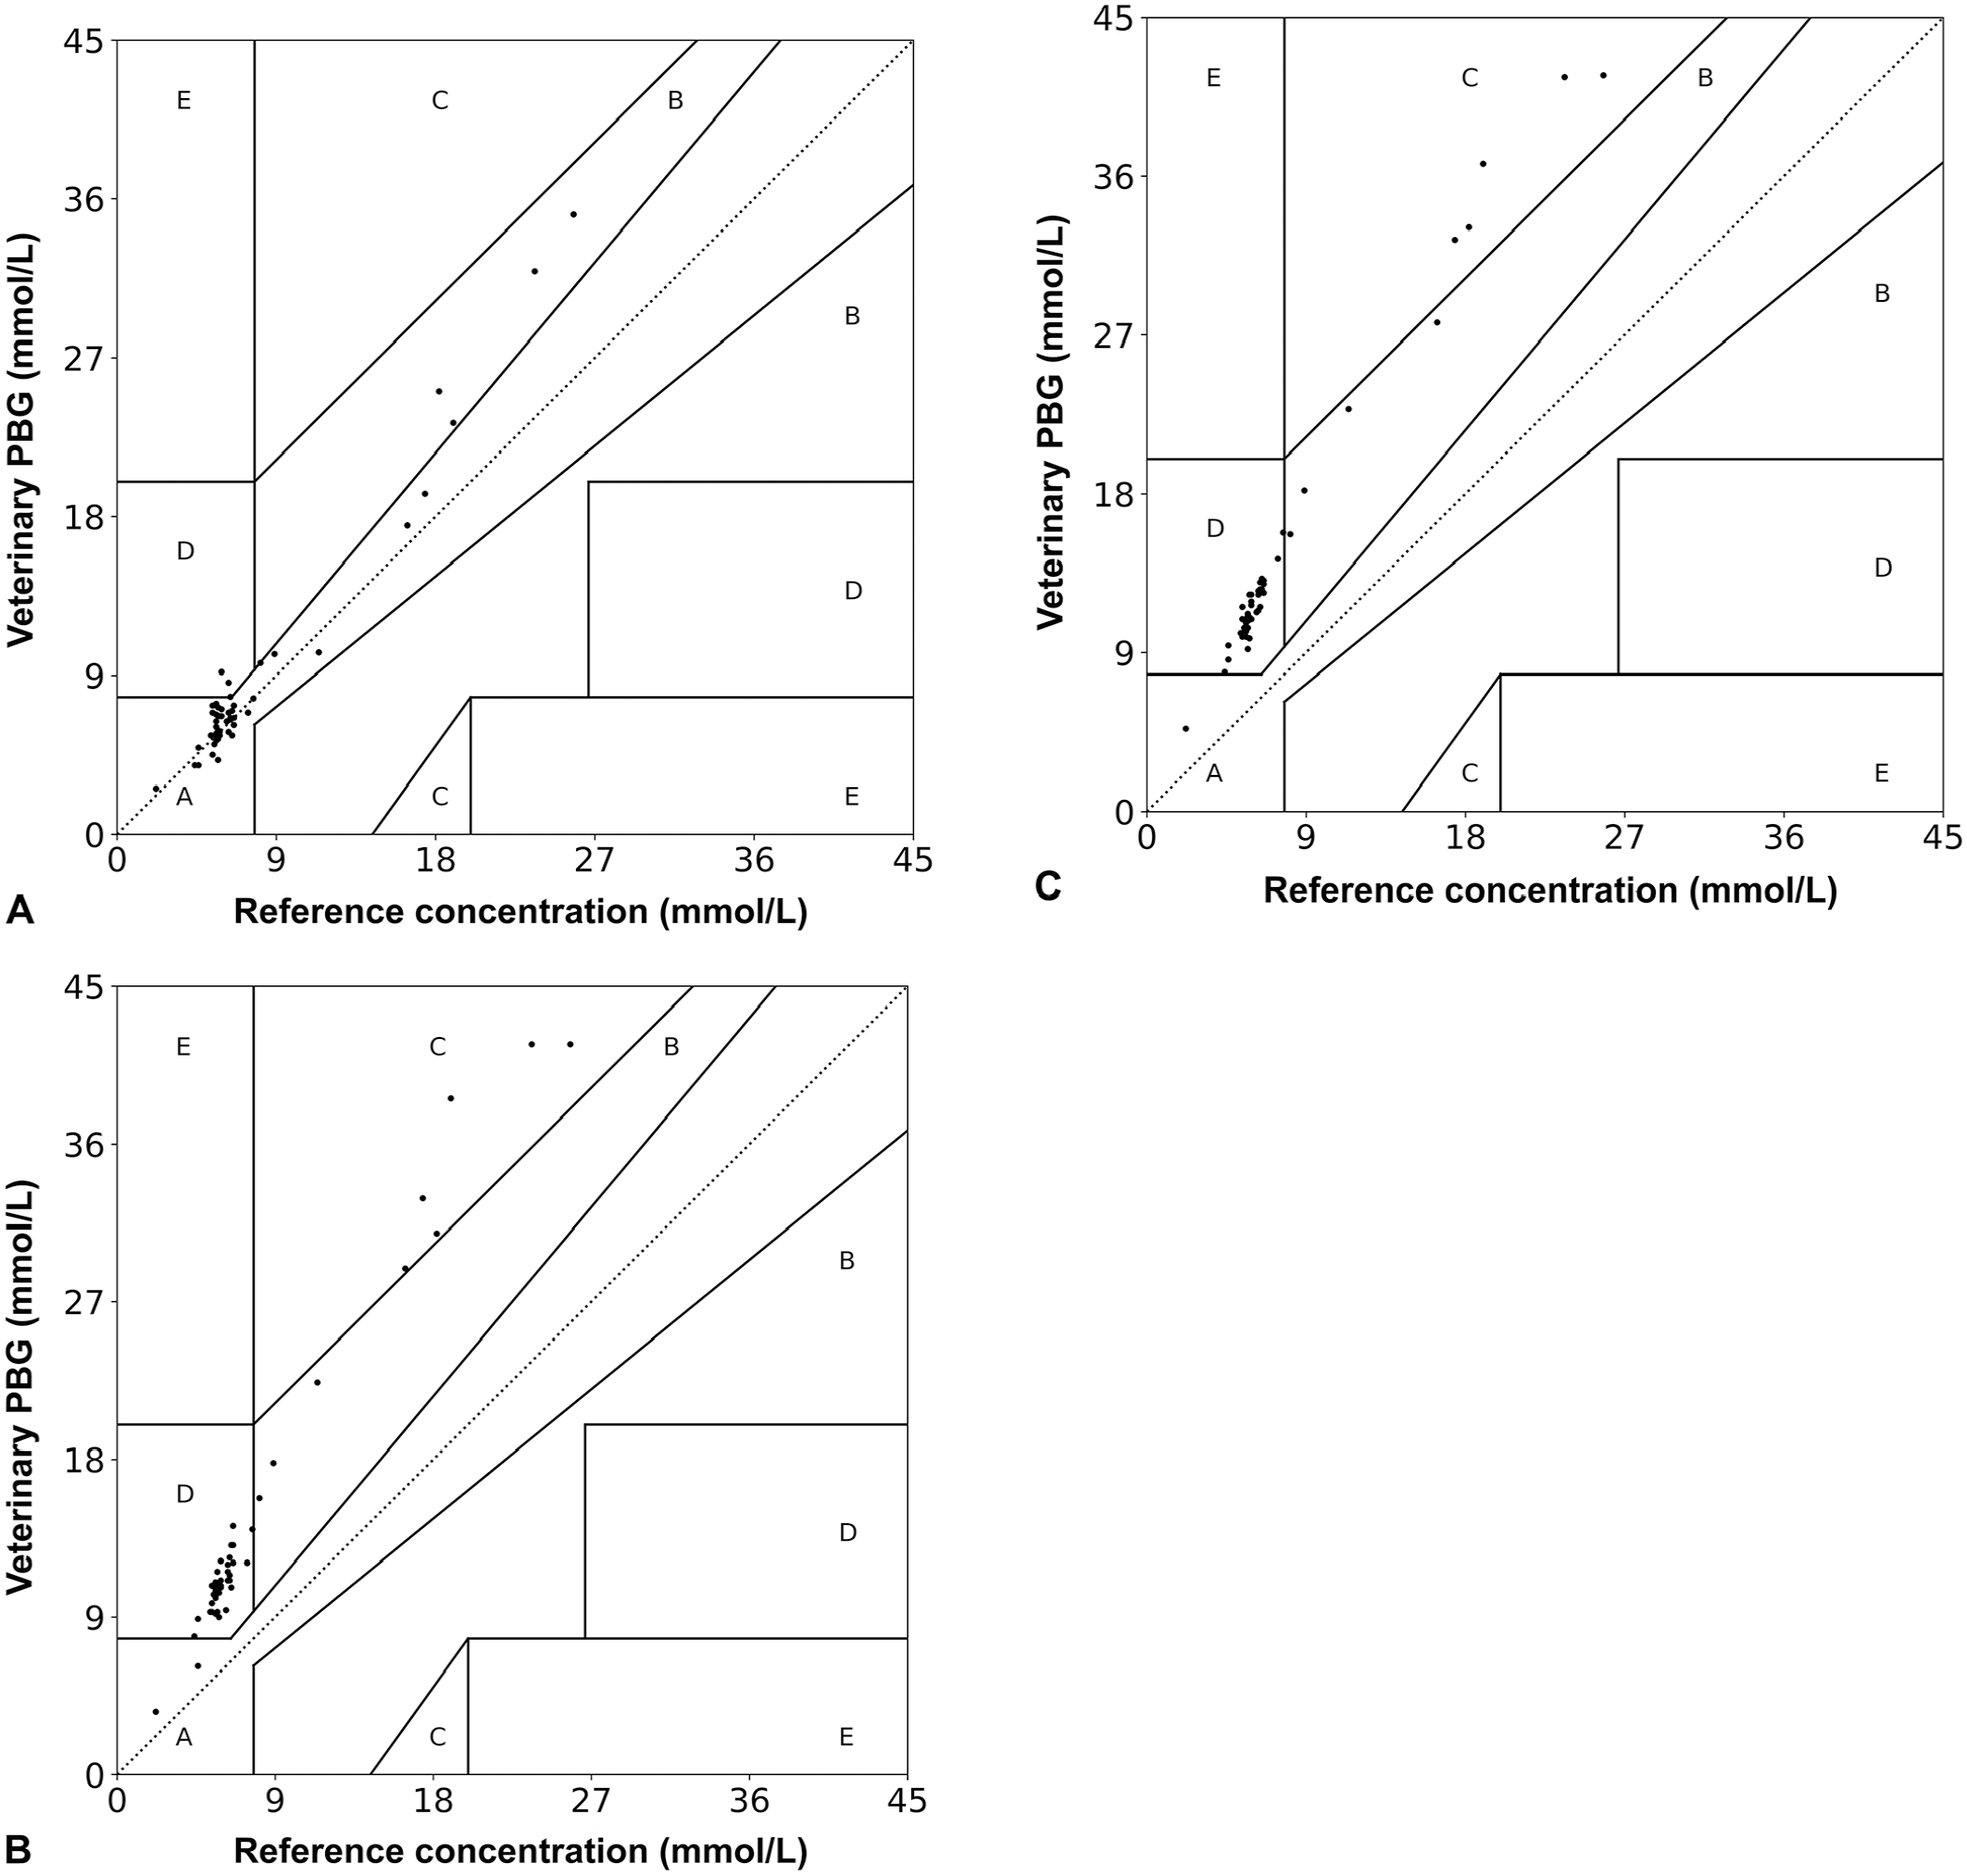
Blood glucose concentrations as measured by a veterinary portable blood glucometer (PBG) falling within zones A–E on Clarke error grid analysis for
Thirty-nine samples (74%) had a PCV within the RI, and 13 samples (24%) had a PCV consistent with anemia. One sample (2%) had a PCV above the RI (>0.59 L/L) and was not included in the assessment of PCV. Median PCV of the anemic samples was 0.34 L/L (range: 0.18–0.38 L/L). The median difference between the reading on the veterinary PBG and the gold standard was 1.5 mmol/L (27 mg/dL) for samples with a low PCV. For samples with a normal PCV, the median difference was 0.2 mmol/L (4 mg/dL). There was substantial correlation (ρc = 0.96) between the whole blood glucose measured with the veterinary PBG and the blood glucose measured with the biochemical analyzer when the PCV was within the RI (n = 39), and poor correlation (ρc = 0.89) was noted for samples in patients with anemia (n = 13).
Discussion
We found that glucose concentration measured in whole blood by the veterinary PBG was more accurate and more strongly correlated with the glucose concentration measured by the biochemical analyzer compared to plasma and serum glucose concentrations.
To date, most veterinary studies have utilized whole blood samples for assessment of accuracy of a PBG in dogs,4,6–9,16,18 likely as a result of ease of sampling and clinical applicability given PBG use in the home setting. Use of plasma improved the accuracy of blood glucose measurements for some human PBGs.1,17 If, similarly, plasma is the better sample for use with the veterinary PBG, plasma should be obtained in veterinary clinics for glucose measurement. On the contrary, we found that the use of whole blood provided more accurate results. Species-specific variations occur in the distribution of glucose within the blood, plasma, and cells of various mammals. 5 Not all PBGs use the same technology to obtain a glucose measurement. In addition, even if the technology is the same, different algorithms are applied after obtainment of the measurement to provide values relevant for the species. Thus, disagreement between our study and the ones using human PBGs may be related to different technology or different algorithms employed.
Inaccurate measurements can adversely affect treatment decisions. Subsequently, we used EG analysis to determine how clinical decisions would be altered by the sample type used in the veterinary PBG utilized in our study. EG analysis placed 94% of the whole blood samples in zones A or B; most samples for plasma and serum were placed in zone D (79% and 81%, respectively). Thus, although not confirmed by assessing the effect of PBG on clinical decision-making in patients, using whole blood on the veterinary PBG is likely much safer than using plasma and serum.
Hematocrit can affect blood glucose measurements obtained by PBGs; hemodilution falsely increases the measurement obtained, and hemoconcentration falsely lowers the measurement.7,9,10,13 Similarly, we found stronger concordance between the gold standard and measurements from whole blood of normal PCV compared to measurements from whole blood with a low PCV. Thus, for anemic patients, a blood glucose measurement obtained on the veterinary PBG is suspect and should be checked in a reference laboratory.
The blood glucose concentration measured in whole blood on the veterinary PBG for 2 samples was within the hypoglycemic range, whereas the results from the biochemical analyzer were within the RI. Although underestimation of glucose concentration may help clients doing home glucose curves for their diabetic dogs avoid hypoglycemic episodes (i.e., a dog would be fed before serious hypoglycemia develops), it may lead to inappropriate lowering of the insulin dose. If a patient’s clinical signs do not match the readings obtained by a PBG, we recommend confirming the PBG reading in a reference laboratory.
Limitations exist to our study. First, we used a single unit of the veterinary PBG to remove variability introduced by using multiple units. It is possible that the bias observed by the single veterinary PBG was unique to the specific device. However, this seems unlikely. Second, we used only one model of veterinary PBG. The effect of sample type varies among PBGs, even between models made by the same manufacturer.11,17 Therefore, similar studies should be conducted on all veterinary PBGs. Third, given the potential life-threatening complications of not detecting hypoglycemia, inclusion of samples with a blood glucose concentration below the RI would have been ideal. Fourth, the effect of a hematocrit above normal could not be determined in our study. Last, the EG analysis utilized in our study was designed for human use. Subsequently, different results and conclusions with a canine-specific EG analysis cannot be excluded.
Use of whole blood provided the most accurate measurements of blood glucose on the veterinary PBG, especially when PCV was within the RI. Glucose concentrations measured in serum and plasma had poor correlation with, and a large bias in comparison to, the gold standard concentration. Additionally, when using whole blood on the veterinary PBG, only a small number of clinical decisions would have been altered in a manner possibly leading to significant medical risk compared to the high number that would have resulted from use of plasma and serum samples. Thus, use of whole blood in the AlphaTRAK 2 PBG will allow for more correct assessment of blood glucose in dogs, enabling appropriate therapeutic intervention in a timely and cost-effective manner. Future studies investigating the use of whole blood on other veterinary PBGs in dogs should be considered to ensure acceptable accuracy of the PBGs in the home and critical care setting.
Footnotes
Acknowledgements
We thank Erik Hofmeister for statistical assistance. Presented in part in abstract form at the 2017 American College of Veterinary Internal Medicine Forum, National Harbor, MD, June 2017.
Declaration of conflicting interests
The authors declared no potential conflicts of interest with respect to the research, authorship, and/or publication of this article.
Funding
The authors received no financial support for the research, authorship, and/or publication of this article.