
Abstract
Radial immunodiffusion (RID) is used to quantify IgG concentration in neonatal beef or dairy calf serum; variability has been noted that may affect the precision and accuracy of assay results. We determined the source, range, and homogeneity of variance in the results of a commercial bovine IgG RID assay (Triple J Farm). To estimate the variance in the precipitin ring diameter, we used 6 sera, measured 28 times across 8 plates and 4 lots, and 3 standards with known IgG concentrations, measured 75 times across 69 plates and 5 lots. The source of diameter variance was determined using variance partition coefficients for lot, plate, and repetition. We used 11 different methods to generate standard curves to convert RID precipitin ring diameters to IgG concentrations. The Levene test of homogeneity of variance (α = 0.1) was used to evaluate the equality of variance between the standards or serum precipitin ring diameters and calculated IgG concentrations. Lot and plate contributed minimally to the diameter variance. Precipitin ring diameters had equal variance. Calculated IgG concentrations for serum not requiring dilution had equal variance. A linear equation from aggregated standards, performed within the same day, had greater accuracy for the calculated IgG concentrations of the standards compared to other equation methods. Regardless of standard curve methodology or IgG concentration, variability inherent to the assay limits its clinical usefulness.
Radial immunodiffusion (RID) was first used in 1965 to quantify immunoglobulin G (IgG) concentrations by allowing immunoglobulins in serum to diffuse through an agarose gel impregnated with anti-IgG antibodies until a precipitin ring formed.10,18 The diameter of the precipitin ring was used to calculate a corresponding IgG concentration. The quantification of IgG concentrations in neonatal bovine calf serum using RID has been used routinely to identify calves with failure of passive transfer of immunity (FPT) since 1969. 17 Calves with FPT are associated with an increased risk for morbidity and mortality prior to weaning.8,12 Additionally, RID is used to validate other tests for FPT, such as refractometry. 4 Therefore, errors in RID assays may lead to misclassification errors in other tests for FPT.
RID assays can be performed to an endpoint characterized by either antibody-excess or antigen-excess. Antibody-excess RID allows an antigen a fixed amount of time, generally 6–18 h, to diffuse before measuring the precipitin ring. 10 Antigen-excess RID allows an antigen to diffuse until all free antigen is bound and the precipitin ring no longer expands.18,22 Thus, the diameter of the precipitin ring is proportional to the IgG concentration of the serum. 26 When quantifying IgG concentrations, the antigen-excess method has been noted to be more sensitive, accurate, and reproducible than the antibody-excess method. 3
Variability in assay results was observed when RID was first used to quantify immunoglobulins; RID was noted to have a “probable error of 10%”. 10 In 2022, poor correlation of RID results was reported for the same serum at 2 separate facilities. 7 Additionally, discrepancies in the standard curve for RID have been noted since the earliest publications.10,18 Typically, 3–5 standards with known IgG concentrations are plated concurrently alongside serum with unknown IgG concentrations to establish a standard curve from which IgG concentrations can be estimated from the measured precipitin ring.3,21,24 From the earliest publications, different standard curve methods have been utilized. 18 Linear, quadratic, logarithmic, and exponential standard curves using the precipitin ring diameter or diameter squared as the independent variable have been used to determine the IgG or log10 IgG concentration.9,15,21,25
The multiple ways of developing a standard curve to calculate IgG concentration from RID have led to uncertainty in results and concerns about the precision and accuracy of the reported values. 1 Our objective was to determine the source, range, and homogeneity of variance in a commercial bovine IgG RID assay.
Materials and methods
A commercial RID assay was evaluated (lots 7284A10, 7284B09, 7284B20, 7284B30, 7284B40; Triple J Farm). Each commercial kit included 3 IgG standards, with IgG concentrations of 28.0, 14.7, and 1.8 g/L (lots 7286G3, 7286G2, 7286G1, respectively), an anti–IgG antibody-impregnated RID plate with 24 wells, and a package insert with instructions on how to perform the test. Sera were applied to the well and allowed 24 h to form a precipitin ring. The diameter of the precipitin ring was measured using a handheld caliper.
Variation in the precipitin ring diameter of standards with known IgG concentrations
A complete block design was used to evaluate variation in the precipitin ring diameter of the IgG standards. All valid precipitin ring diameters for all standards from RID assays (lots 7284A10, 7284B09, 7284B20, 7284B30, 7284B40) performed in the research laboratory from the same standard lot (lots 7286G3, 7286G2, 7286G1) were used. There were 13, 43, 6, 6, and 2 plates for lots 7284A10, 7284B09, 7284B20, 7284B30, and 7284B40, respectively. Each plate had a minimum of 3 standards. Standards from plates that were considered invalid (e.g., if one or more protein standards failed to produce a precipitin ring) were excluded.
To identify the source of variance in the standard precipitin ring diameter, we used a linear mixed-effects model with precipitin ring as the dependent variable, standard identification number as a fixed effect, and lot and plate within lot included as random effects (Proc MIXED, SAS 9.4; SAS Institute). Standard identification number was included as a fixed effect to account for variance caused by diameter differences between standards as a source of variation. Variance partition coefficients were calculated for the hierarchical structure of lot, plate within lot, and sample repetition by dividing the variance at a level by the total variance. We concatenated 5,000 replications of unrestricted random sampling (Proc SURVEYSELECT, SAS 9.4) by standard identification number. The concatenated data were used to produce simulated 95% credible intervals (CrIs) by using the 2.5th and 97.5th percentiles for the calculated variance partition coefficients.2,14 Equality of variance between the standard’s precipitin ring diameters was tested using the Levene test for homogeneity of variance (Proc GLM, SAS 9.4). Significance was set at α = 0.10 to reduce the chance of a type II error. If the result of a Levene test was not significant, indicating homogeneity of variance, then the average CV of the standard precipitin ring diameter was calculated by averaging the CV for each IgG standard.
Variation in the precipitin ring diameter of serum with unknown IgG concentrations
Blood was collected via jugular venipuncture from 817 U.S. commercial beef breed calves, 2–7-d-old, across 4 herds (1 in Nebraska, 3 in Mississippi). The blood was allowed to clot; serum was separated by centrifugation, pipetted into sterile 1.5-mL conical vials, and stored at −80°C for further analysis.
A complete randomized block design was used to evaluate the variance in serum precipitin ring diameter. Using preliminary data, an a priori sample size calculation was performed to detect a 1.0 g/L difference in a serum’s x̄ with a SD of 1.5 g/L between 2 lots, with α = 0.05 and power of 0.95. The required number of replications was 14 per lot. 11
A random number generator (Excel 2016; Microsoft) was used to randomly select representative sera from the following serum IgG strata: low-serum IgG stratum with previously measured IgG concentrations >5.0 g/L and <15.0 g/L, and requiring no dilution; moderate-serum IgG stratum with a previously measured IgG concentration of 35.0–45.0 g/L and requiring 1 dilution; high-serum IgG stratum with a previously measured IgG concentration of 60.0–70.0 g/L and requiring 2 dilutions. The low-, moderate-, and high-serum IgG strata had 39, 182, and 109 eligible sera, respectively. Initially, a single serum was selected randomly from each of the serum IgG strata; however, the selected sera from the low-serum IgG strata had generated a precipitin ring greater than the highest standard. Therefore, 3 additional sera that did not produce precipitin rings greater than the highest standard were selected randomly from the low-serum IgG stratum. In total, 4 sera were selected from the low-serum IgG stratum, 1 serum from the moderate-serum IgG stratum, and 1 serum from the high-serum IgG stratum. Three sera from the low-serum IgG stratum were plated 7 times on 2 plates from 2 separate lots (lots 7284A10, 7284B40) for a total of 28 observations per serum. A single serum from the 3 strata (low-, moderate-, and high-serum IgG) were plated 7 times on 2 plates from 2 separate lots (lots 7284B20, 7284B30) for a total of 28 observations per serum. For simplification, the serum from each serum IgG strata evaluated on lots 7284B30 and 7284B20 will be referred to as the mixed-serum IgG stratum trial, and the 3 sera from the low-serum IgG stratum evaluated on lots 7284B40 and 7284A10 will be referred to as the low-serum IgG stratum trial.
The sera were thawed at room temperature (RT) for 1 h. Plates were removed from the refrigerator and allowed to come to RT for ~30 min, per the manufacturer’s instructions. Three IgG standards and 3 sera, plated 7 times each, were applied to each plate (Fig. 1). Each vial of serum was pulse vortexed before 5 μL of serum was pipetted into the plate well. After all wells were filled, the plate was placed in a foil bag, sealed, and marked with the time of completion. The sealed bag sat at RT for 24 h before the precipitin ring diameters were measured. Precipitin ring diameters were measured on a black benchtop with a lit magnifying glass by a single evaluator to the nearest 0.1 mm using a handheld vernier caliper with a ruler scale. The accuracy of the caliper was tested against standard brass bars with a reference dimension. The caliper had an accuracy of +0.01 mm with a precision of ±0.2 mm. The caliper was marked to the nearest 1.0 mm. The same individual plated the sera and measured the resulting precipitin rings. Plates were considered valid if all IgG standards produced a precipitin ring. Samples from plates that did not meet this criterion were repeated on separate plates. A serum with a precipitin ring diameter greater than the highest standard was diluted 1:1 with PBS and re-evaluated until the precipitin ring diameter was within the range of the standards.5,20
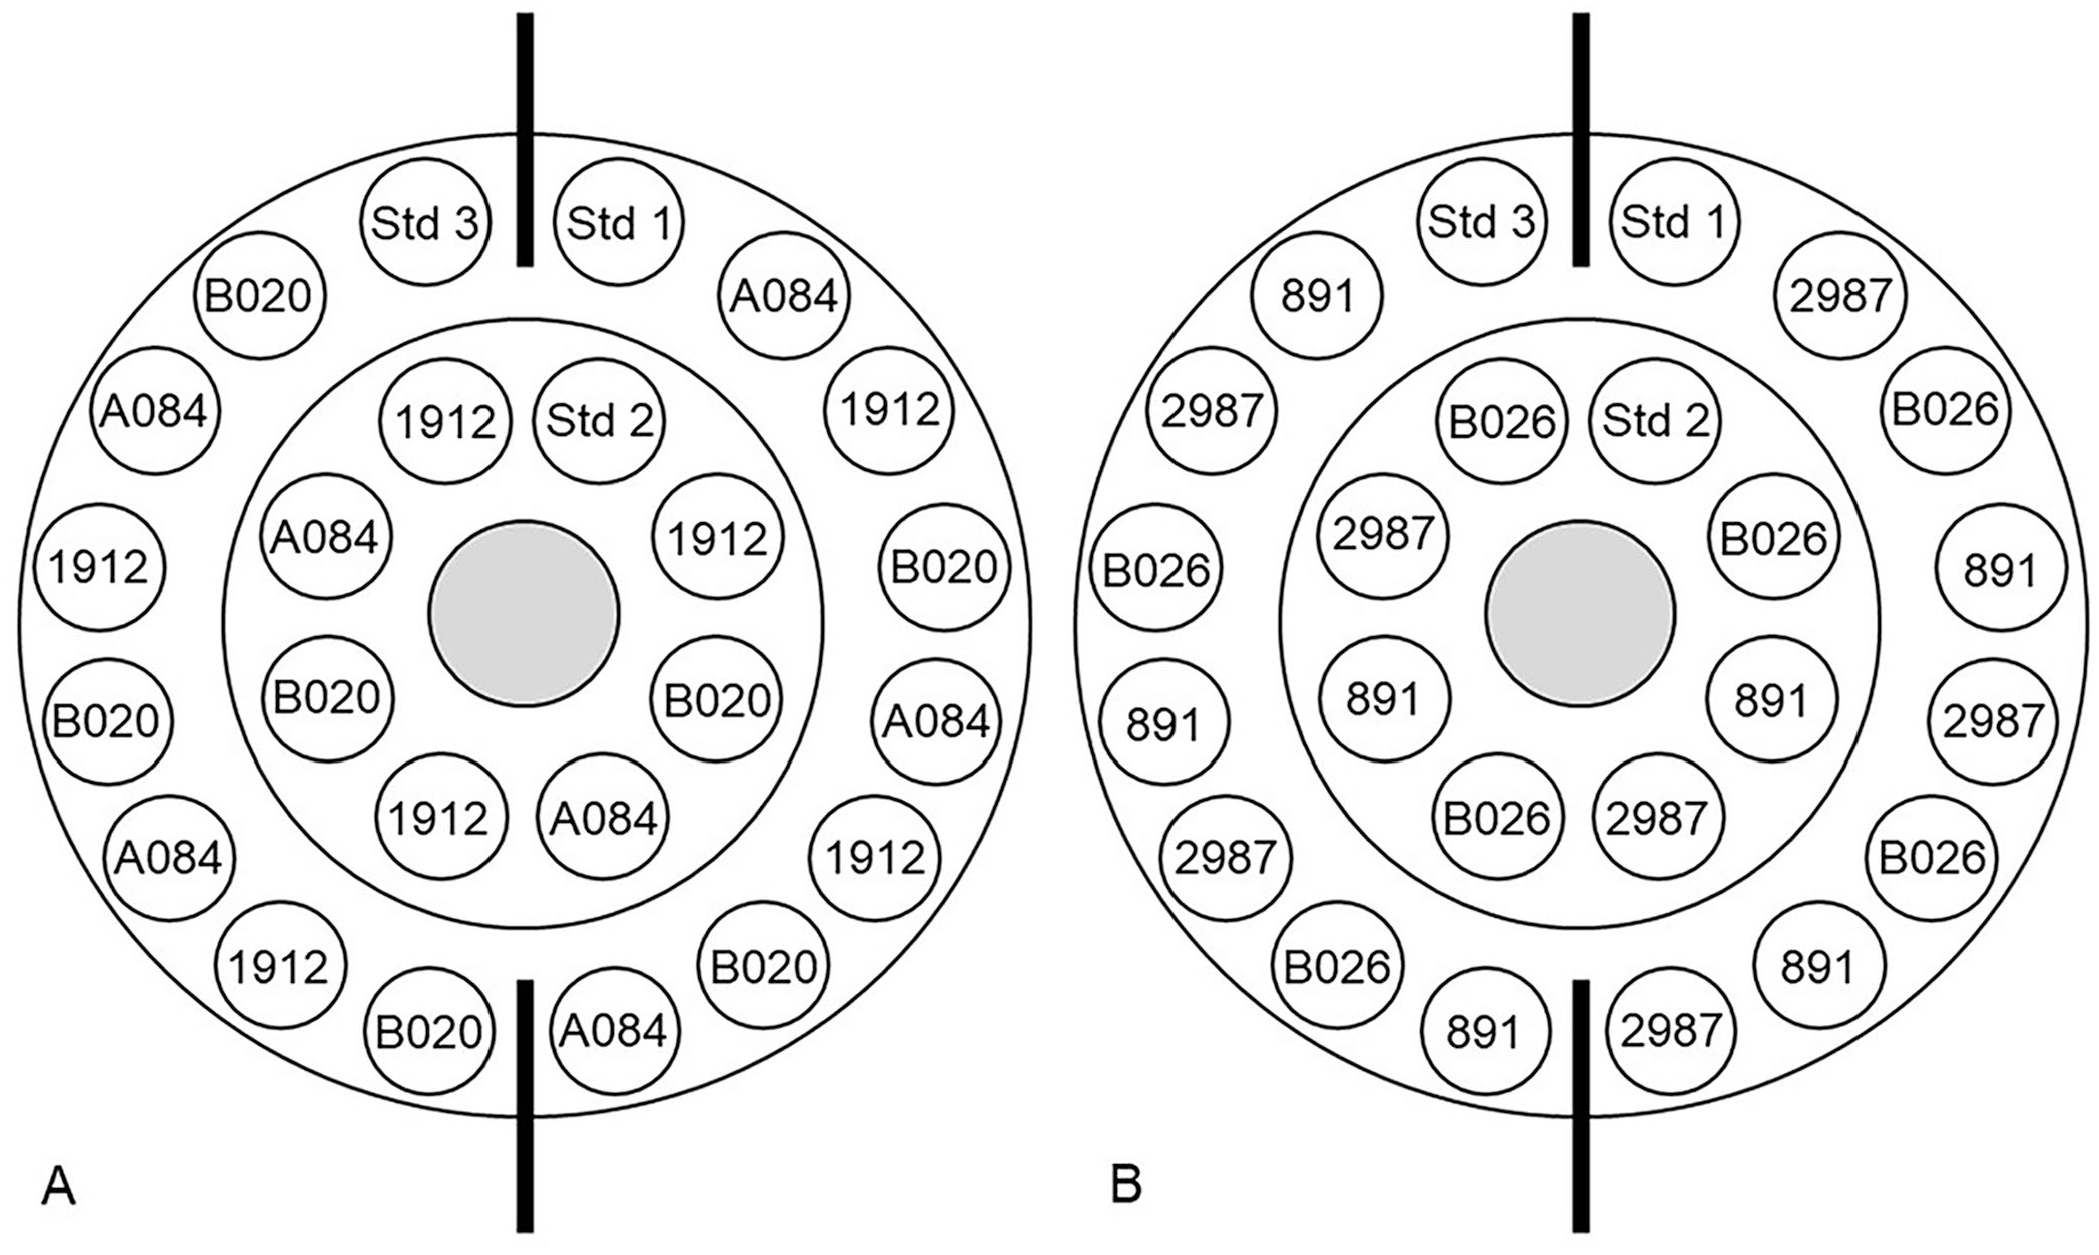
Assay schematic of a commercial bovine IgG radial immunodiffusion assay. Standards (Std) 1–3 were included with the test kit and had known IgG concentrations of 1.8 g/L, 14.7 g/L, and 28.0 g/L, respectively.
To identify the sources of variance in the non-diluted serum precipitin ring diameter, we used a linear mixed-effects model with precipitin ring diameter as the dependent variable, serum identification number as a fixed effect, and lot and plate within lot included as random effects (Proc MIXED, SAS 9.4). Variance partition coefficients were calculated separately for the serum from lots 7284A10 and 7284B40 and from lots 7284B20 and 7284B30. Variance partition coefficient 95% CrIs were calculated as described previously. The effect of lot and plate on the precipitin ring diameter was evaluated in separate univariate general linear models (Proc GLM, SAS 9.4). Equality of variance between the non-diluted and diluted serum precipitin ring diameters was tested using the Levene test for homogeneity of variance (Proc GLM, SAS 9.4). Significance was set at α = 0.10 to decrease the chance of a type II error. If the result of a Levene test indicated homogeneity of variance, then the average CV of the serum precipitin ring diameter was calculated as described previously.
Variation as a result of the standard curve
The precipitin ring diameters were converted to IgG concentrations using standard curves generated by 11 methods (Table 1). The final dilution diameter was used for serum requiring dilution, and the calculated IgG concentration was multiplied by the dilution factor. Constants within linear (y = mx + b) and quadratic (y = ax2 + bx + c) equations were calculated using linear regression (Proc REG, SAS 9.4) with the independent variable being diameter squared or the log10 of the diameter squared and the dependent variable being the known IgG concentration of the standards. Constants within logarithmic equations (y = a × ln[x] + b) were calculated (Excel 2016; Microsoft) with the independent variable being diameter squared and the dependent variable being the known IgG concentration of the standards.
Standard curve methods using standards with known IgG concentrations to determine by radial immunodiffusion assay the IgG concentrations in serum with unknown IgG concentrations.
Trendlines were generated using SAS v.9.4 (linear, quadratic; SAS Institute) or Excel (logarithmic; Microsoft) with the dependent variable as IgG concentration. The trendlines are the following formulas: linear (y = mx + b), quadratic (y = ax2 + bx + c), logarithmic (y = a × ln(x) + b).
Method 1 is the lot equation provided by the manufacturer of the radial immunodiffusion assay. The equation is given with the independent variable as the IgG concentration. For our study, we rearranged the equation to have IgG concentration as the dependent variable.
Low-serum IgG stratum has 4 sera with previously measured IgG concentrations <15.0 g/L, >5.0 g/L, and requiring no dilution.
Moderate-serum IgG stratum has 1 serum with a previously measured IgG concentration of 35.0–45.0 g/L and requiring 1 dilution. High-serum IgG stratum has 1 serum with a previously measured IgG concentration of 60.0–70.0 g/L and requiring 2 dilutions.
Equality of variance between the calculated IgG concentrations for each method for all sera, sera not requiring dilution (low-serum IgG stratum), sera requiring dilution (moderate- and high-serum IgG strata), and the standards was tested independently with the Levene test for homogeneity of variance (Proc GLM, SAS 9.4). The level of significance was set at α = 0.10 to decrease the chance of a type II error. If the result of a Levene test indicated homogeneity of variance, then the average CV of the calculated IgG concentration was calculated as described previously. The margin of error was calculated for each serum using the SD and a 2-tailed t-score for α = 0.05. Individual serum margins of error were averaged to calculate the overall margin of error for each method.
Results
Variation in the precipitin ring diameter of standards with known IgG concentrations
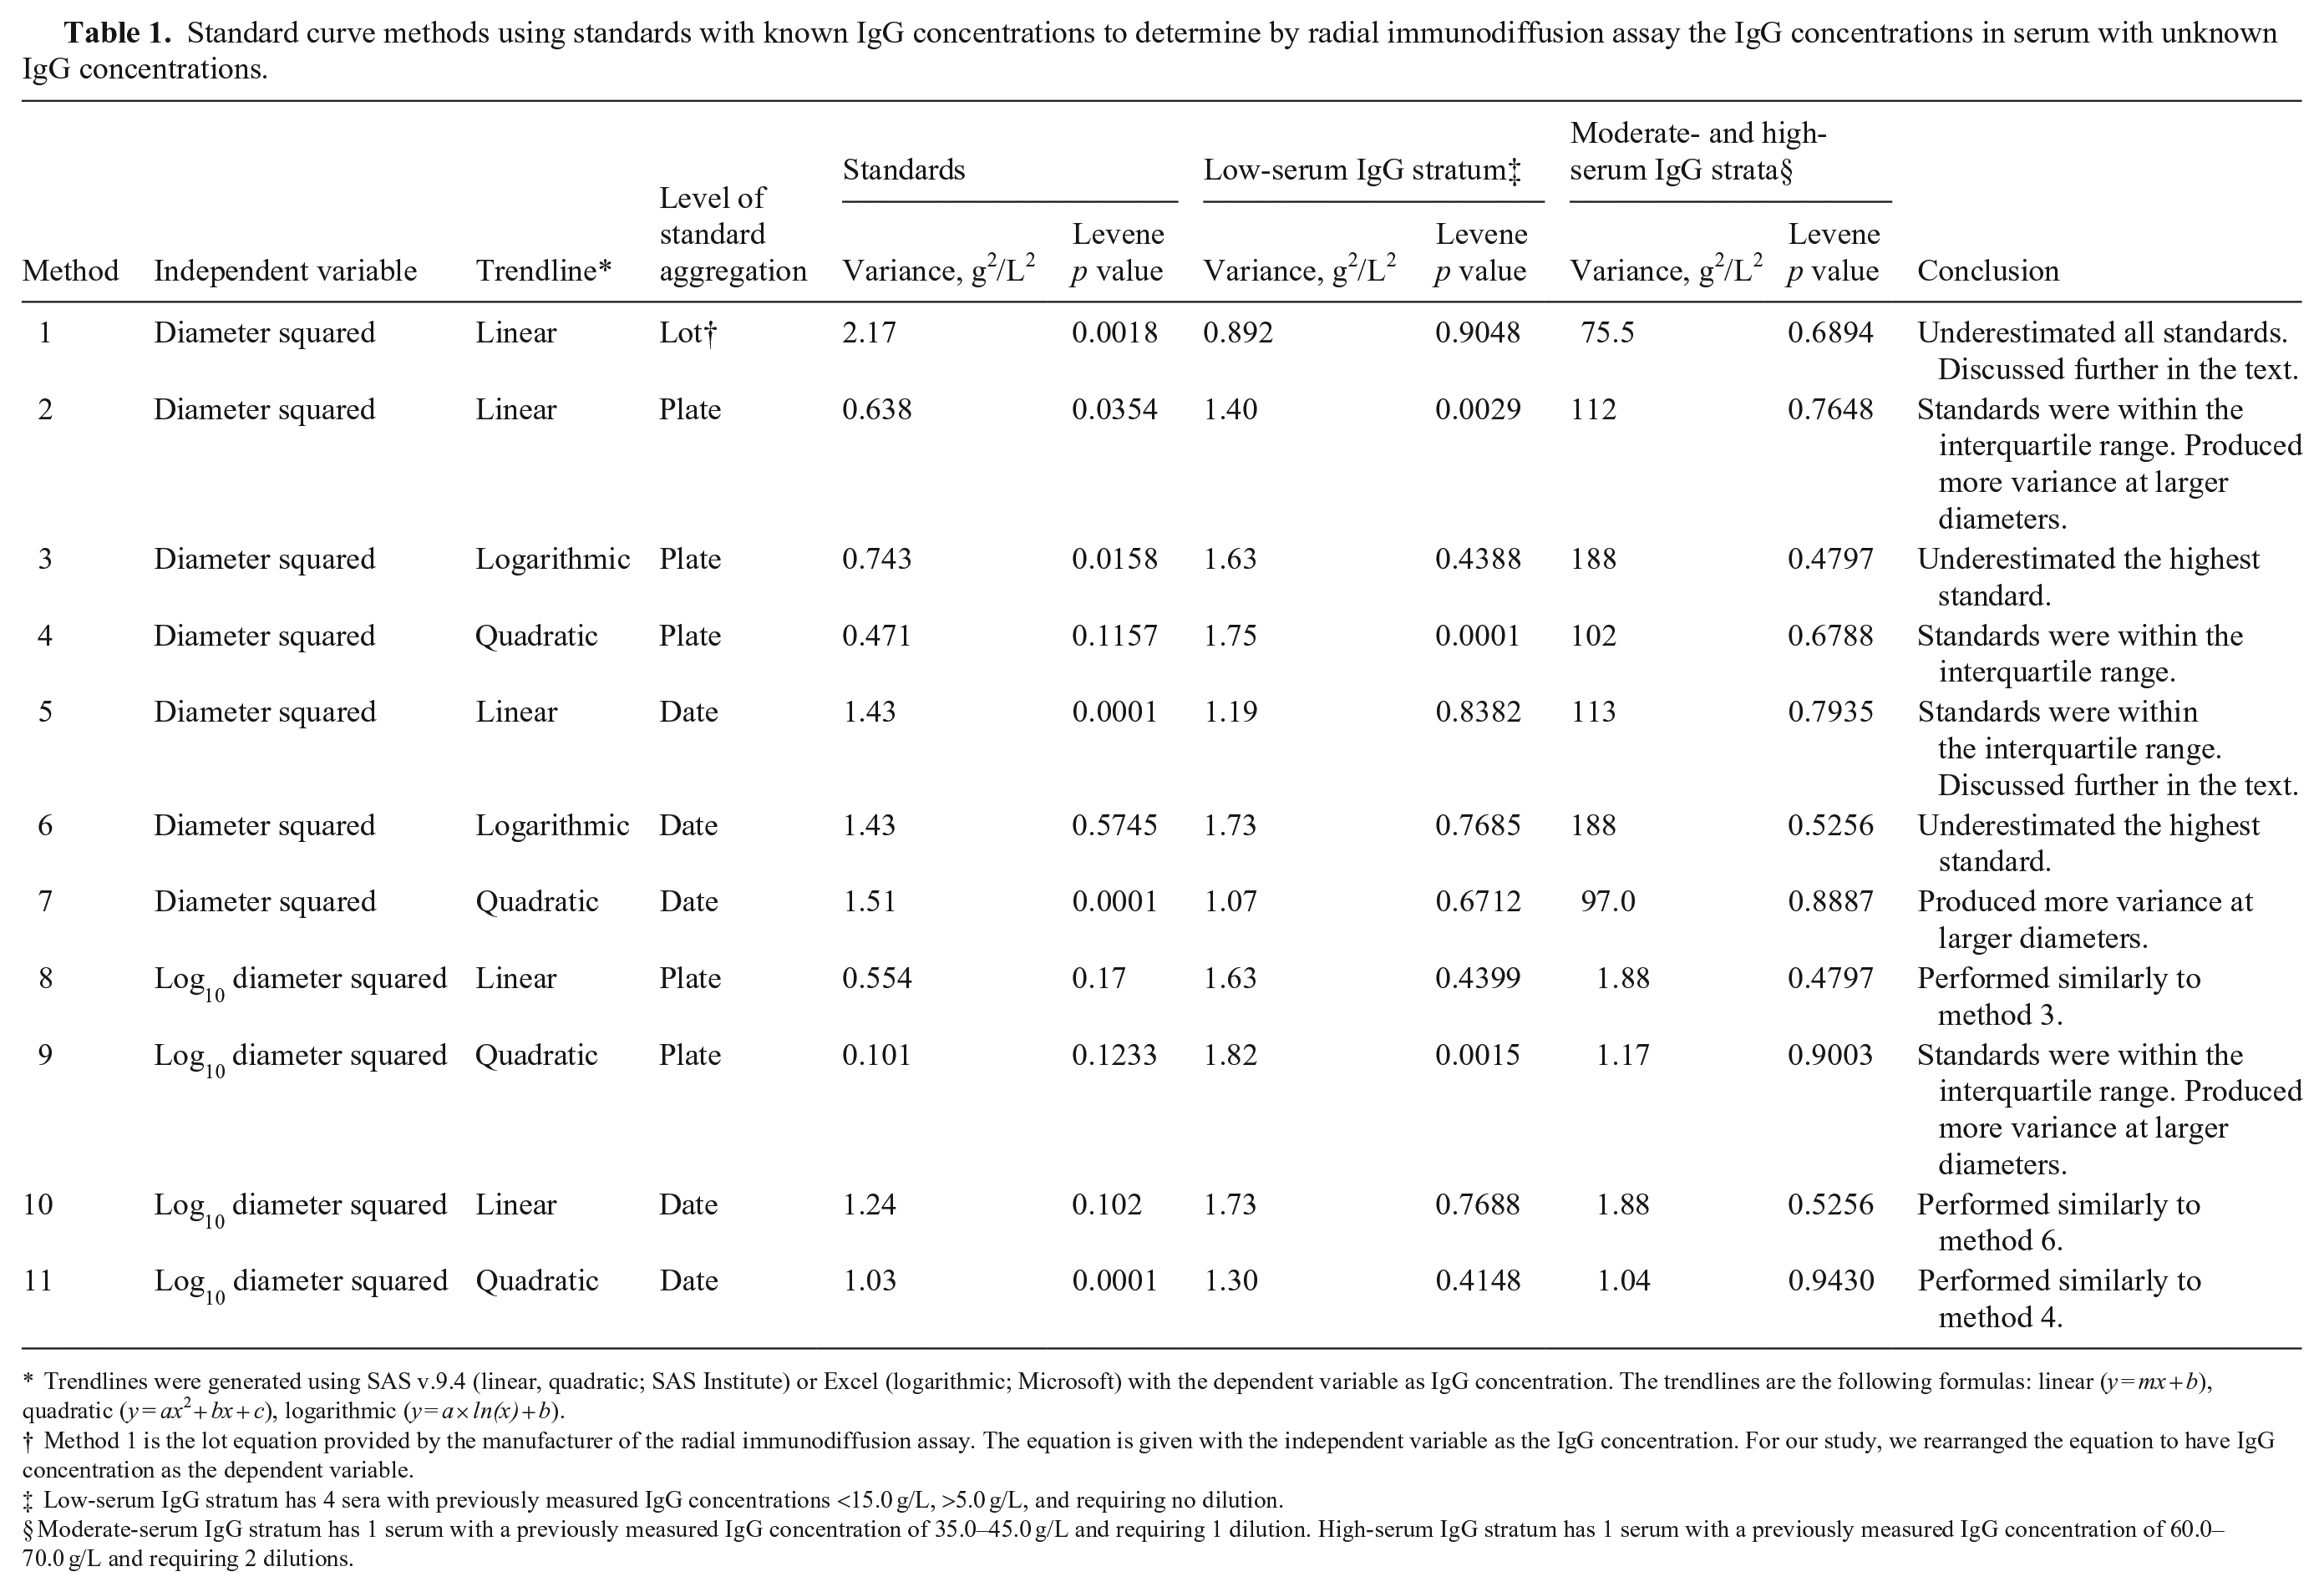
We included 75 observations of each standard from 69 plates and 5 lots in the analysis (Fig. 2). Analysis of variance partition coefficients indicated that the main source of variance for the standards was within the precipitin ring diameter measurements of a standard (100%; CrI: 71.3–100%). Lot (0%; CrI: 0–1.7%) and plate within lot (0%; CrI: 0–28.4%) contributed minimally to the measured variance. The Levene test analysis determined that the variance in precipitin ring diameter between the standards did not differ (p = 0.14, 0.0625 mm2, SD = 0.25 mm, CV = 4.6%).
Range of precipitin ring diameters from a commercial bovine IgG radial immunodiffusion assay for 3 included standards with known IgG concentrations measured 75 times across 69 plates and 5 lots. The known IgG concentrations for the standards were 1.8 g/L (low), 14.7 g/L (middle), and 28.0 g/L (high).
Variation in the precipitin ring diameter of serum with unknown IgG concentrations
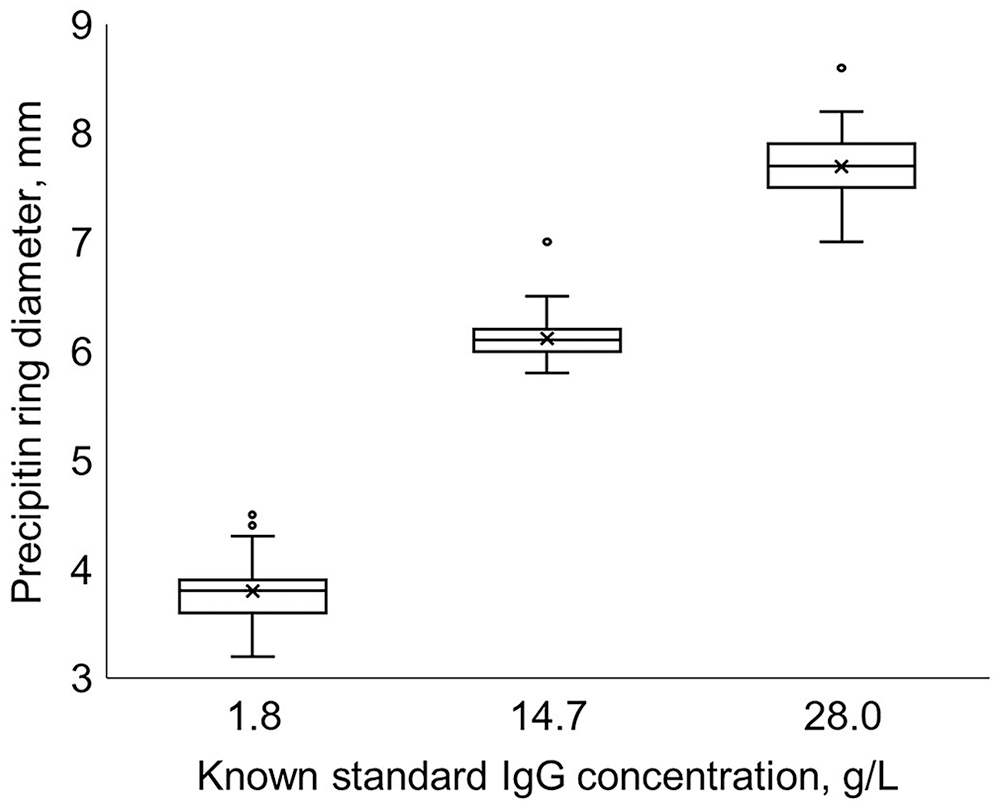
We included 28 observations of each serum in the analysis (Fig. 3). Serum A084 in the low-serum IgG stratum required a 1:1 dilution for 1 observation. Sera 891, 2987, and B026 in the low-serum IgG stratum did not require dilution. Serum 1912 from the moderate-serum IgG stratum required sixteen 1:1 dilutions and twelve 1:3 dilutions. Serum B020 from the high-serum IgG stratum required eight 1:1 dilutions and twenty 1:3 dilutions.
Range of non-diluted precipitin ring diameters from a commercial bovine IgG radial immunodiffusion assay for 6 sera measured 28 times across 4 plates and 2 lots, arranged lowest to highest. Sera were selected by the number of 1:1 serum-to-PBS dilutions required for the precipitin ring to be within the standards: none (891, B026, 2987, A084), 1 (1912), and 2 (B020).
Analysis of variance partition coefficients indicated that the main source of variance was within the precipitin ring diameter measurements of a serum for the mixed-serum IgG strata trial (98.3%; CrI: 81.4–100%) and the low-serum IgG stratum trial (68.4%; CrI: 45.5–85.0%). Lot (0%; CrI: 0–8.6%) and plate within lot (1.7%; CrI: 0–16.6%) contributed minimally to the measured variance for the mixed-serum IgG strata trial, but did not affect precipitin ring diameter significantly (p = 0.93, p = 0.86, respectively). Lot (4.3%; CrI: 0–23.7%) and plate within lot (27.3%; CrI: 6.3–51%) contributed moderately to the measured variance for the low-serum IgG stratum trial, but did not affect the precipitin ring diameter significantly (p = 0.36, p = 0.54, respectively). The Levene test analysis determined that the variance between the initial diameters of the 6 sera did not differ (p = 0.34, 0.0625 mm2, SD = 0.25 mm, CV = 3.6%). The Levene test determined that the variance between the final diameters of the 6 sera differed significantly (p < 0.0001). Homogeneity of variance was present between the precipitin ring diameters of serum in the low-serum IgG stratum (p = 0.78, 0.042 mm2, SD = 0.21 mm, CV = 3.6%). Homogeneity of variance was present between the diluted precipitin ring diameters of serum in moderate- and high-serum IgG strata (p = 0.86, 0.375 mm2, SD = 0.61 mm, CV = 9.0%).
Variation as a result of the standard curve
The 225 standard precipitin ring diameter observations were used to produce standard curves, and the standard curves were applied to the serum precipitin ring diameters (Table 1). Method 9 had equal variance for the standards (p = 0.123) and produced the smallest average variance for the standards compared to other methods (10.2 g2/L2, SD: 3.0 g/L). Regardless of the method, the sera had unequal variance (p < 0.1). However, separating the serum by low-serum IgG stratum and combining the moderate- and high-serum IgG strata resulted in some methods (1, 3, 5–8, 10, 11) having equal variance (p > 0.1) for the low-serum IgG stratum, and all methods having equal variance for the moderate- and high-serum IgG strata (p > 0.1). The method with the smallest variance for the different strata was method 1; however, this method underestimated the known values of the standards and did not contain them within the 90% range of calculated IgG concentrations (Fig. 4A). Method 5 had an unequal variance (p < 0.001) for the standards but was one of the 4 methods to contain the known value of all IgG standards within their respective calculated interquartile range (Fig. 4B). Additionally, method 5 had equal variance (p = 0.838) for the low-serum IgG stratum (1.18 g2/L2, SD: 1.09 g/L, margin of error: 2.59 g/L, CV: 10.2%) and the moderate- and high-serum IgG strata (1.12 g2/L2, SD: 10.6 g/L, margin of error: 25.2 g/L, CV: 18.7%). The optimal method for generating a standard curve is method 5, a linear equation that aggregated the standards performed within the same day (Fig. 5).
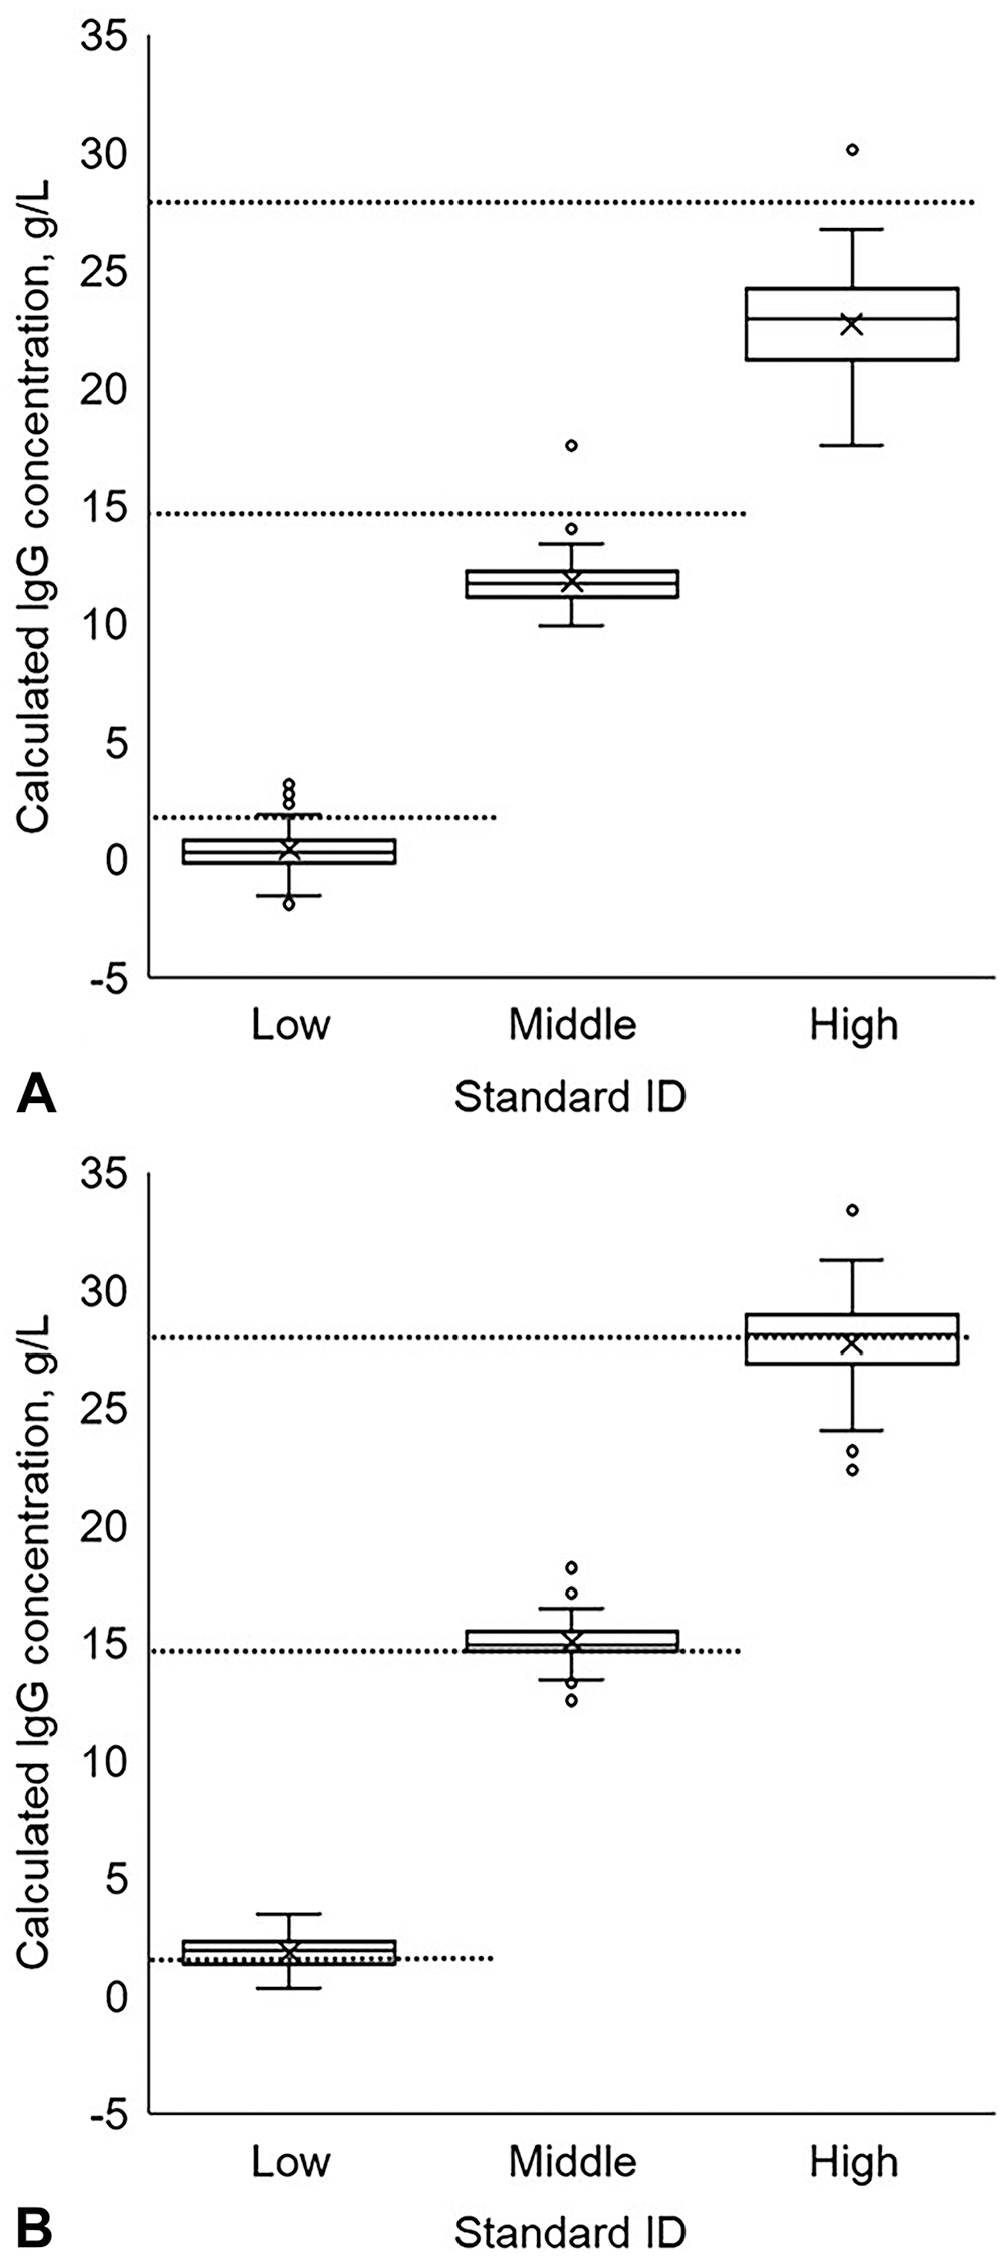
Range of the IgG concentrations of the standards with known IgG concentrations (75 observations per standard) from a commercial bovine IgG radial immunodiffusion assay when calculated using
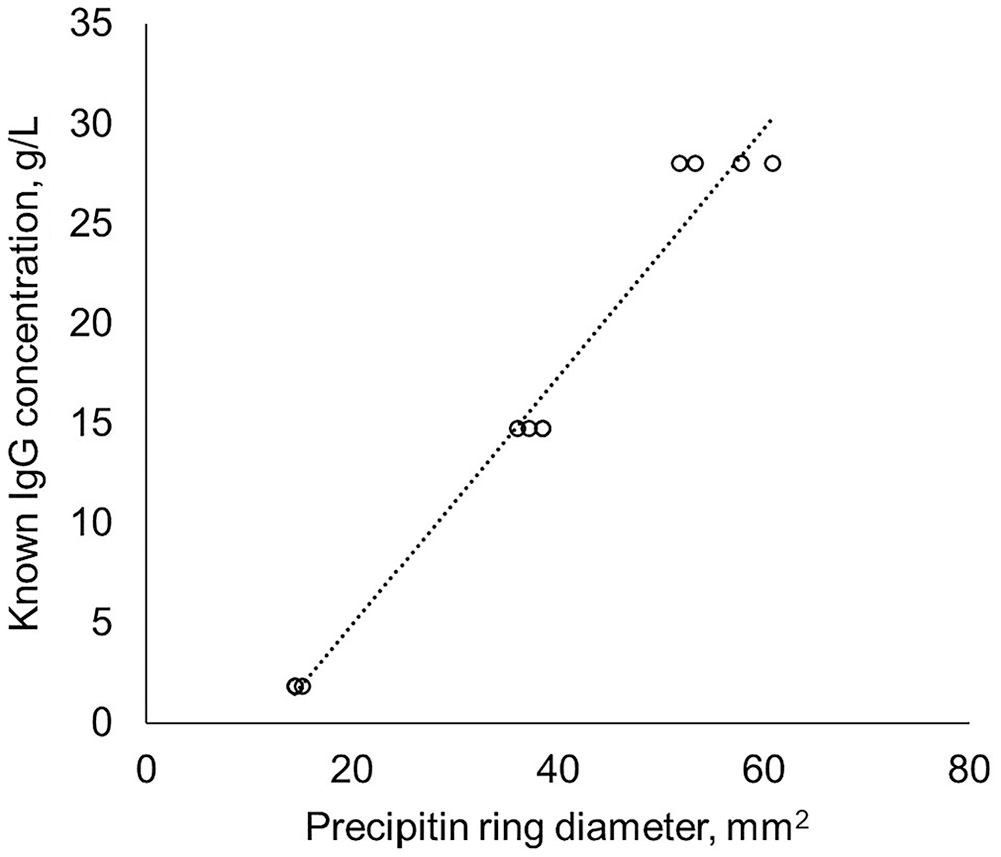
An example linear standard curve for the radial immunodiffusion assay generated from aggregated standards performed the same day.
Discussion
The precipitin ring diameter of the same sample varied with each repetition; lot and plate contributed minimally to variance. The equations used to convert the precipitin ring diameter to an IgG concentration amplified the variance in the diameters and affected the accuracy and precision of the calculated IgG concentrations.
The results from RID assay have inherent variability. Variance in standard precipitin ring diameters measured using RID has been reported, with CVs of 2–13.8%.16,18,23,26,28 Therefore, our CVs of the precipitin ring for the standards, the non-diluted serum precipitin ring, and diluted serum precipitin ring diameters were within the reported ranges for RID assays. The main source of variance was within replicates of a serum or standard, commonly referred to as intra-assay variance. Errors in obtaining the same precipitin ring diameter for a sample may be the result of poor delineation of the ring, which has been noted in previous RID assay studies.6,19 Although each serum was vortexed, lack of thorough mixing of antibodies within the vial might have contributed to the observed variability. However, research is lacking related to the length of time and type of mixing required to reach complete IgG suspension in serum. Similarly, unequal distribution of antigens within a gel could change the distance at which the precipitin ring forms. 27 We did not measure the distribution of antigens within the gel, which may be considered a limitation and source of bias; however, a SD of 0.25 mm for the diameter of the non-diluted precipitin ring is minimal and may be considered acceptable measurement bias. Other studies have reported minimal inter-assay variance with RID, which was supported by our study in which we observed a minimal and insignificant influence of plate and lot on the precipitin ring diameters as noted by the small variance partition coefficients.13,16,18
Variance in the precipitin ring diameter affected the standard curve and ultimately the accuracy and precision of the calculated IgG concentrations. Quadratic standard equations were accurate for the standards, especially for lines generated by plate; however, quadratic lines made from 3 points will form a perfect line with a coefficient of determination of 1. Logarithmic equations were not accurate, especially for the middle and highest standards. Additionally, linear lines using the log10 of the diameter squared performed similarly to the logarithmic lines. Linear equations and equations generated from aggregating standards performed the same day tended to be the most accurate for the standards. Lot and plate within lot contributed minimally to the variance but indicate that the standard curve from one plate may not accurately represent the IgG concentrations from serum or standards on another plate. Therefore, a standard curve should not be developed on one plate and applied to other plates.
Accuracy could not be evaluated for serum with unknown IgG concentrations, but the precision of the IgG concentrations calculated by the equations was assessed. IgG concentrations for serum from the low-serum IgG stratum had a lower margin of error compared to serum from the moderate- and high-serum IgG strata that required dilution. Regardless of IgG concentration, the observed variability in results may limit clinical usefulness.
Serum with precipitin rings greater than the highest standard were diluted because previous studies cautioned against extrapolating standard curve lines for diameters larger than the highest standard, which could result in inaccurate IgG concentrations.16,28 However, the lack of precision for serum with diameters greater than the highest standard could be the result of dilution, as indicated by the increased variance in precipitin ring diameter for diluted serum. Equations from >3 standards displayed reduced variance and improved precision in IgG concentrations for serum with larger diameters. Aggregation of standards from other plates performed in the same day could reduce the effect that plate has on the calculated IgG concentrations. Alternatively, adding a standard with an IgG concentration greater than the current highest standard would reduce the number of sera requiring dilution and may reduce the observed variance in serum with larger diameters. An interesting observation in our study was the extreme outlier in serum 1912. Under normal conditions, the presence of an extreme value measured with a RID would not be known because sera are generally plated only once. We maintained the severe outlier in our study to demonstrate the possibility that a reading could be a deviation from the true value of the serum.
A linear equation that aggregated the standards performed within the same day, compared to other methods of generating a standard curve, improved the accuracy of the calculated IgG concentrations for the standards. Regardless of standard curve methodology or IgG concentration, variability in results inherent to the tested RID assay may limit its clinical usefulness.
Footnotes
Acknowledgements
This paper is a product from the Beef Cattle Population Health and Reproduction Program at Mississippi State University.
Declaration of conflicting interests
The authors declared no potential conflicts of interest with respect to the research, authorship, and/or publication of this article.
Funding
Our project was supported by the Mikell and Mary Cheek Hall Davis Endowment for Beef Cattle Health and Reproduction, and the Mississippi State University College of Veterinary Medicine House Officer Grant Program.