
Abstract
Three groups of beef cow and calf pairs were studied to determine plasma vitamin E and blood selenium (Se) concentrations of calves at 1 month old. Group 1 was managed on irrigated pasture and calves received no Se/vitamin E injections at birth. Group 2 was managed on irrigated pasture, and the calves were injected with Se/vitamin E at birth. Group 3 was managed on dry foothill grasslands, and these cows were supplemented with 56.3 mg vitamin E and 3 mg Se daily, and the calves received a Se/vitamin E injection at birth. The plasma concentration of vitamin E in group 1 and 2 cows (9.5 ± 1.24 and 8.43 ± 1.0 μg/ml. respectively) was significantly higher than that of the group 3 cows (2.28 ± 0.42 μg/ml; P < 0.05). The blood Se concentrations in group 3 cows (169 ± 37 ng/ml) were significantly higher than those in group 1 and 2 cows (36.4 ± 15.9 and 31.1 ± 12.5 ng/ml, respectively; P < 0.05). Calf Se was highly correlated to cow Se (r = 0.965), and calf vitamin E was moderately correlated to cow vitamin E (r = 0.605). Calf vitamin E concentrations were consistently lower than cow vitamin E concentrations, and many values would be considered deficient.
Keywords
Vitamin E is an essential nutrient for beef cattle, and deficiencies have been associated with nutritional myodegeneration 1,9 (NMD; white muscle disease), decreased immune function, 17 and decreased reproductive performance. 5 Calves are born with low stores of vitamin E. because it crosses the placenta in limited amounts, 6,7 and colostrum is the primary source of vitamin E in neonatal calves. 6,7 Because colostrum is the primary source of vitamin E for newborn calves, and the body does not store vitamin E for extended periods, the vitamin E status of preruminant calves at approximately 30 days old is an important missing set of data for diagnostic interpretation. Selenium (Se) is another essential nutrient and important antioxidant for cattle and other mammalian species. Se is an integral part of the structure of glutathione peroxidase and other seleno-enzymes. 12 It is known to cross the placenta to the calf easily 10 ; however, it is not transferred well through colostrum or milk. 4,10 Therefore, the decline in Se stores of the beef calf from parturition onward is an important consideration, and further characterization of these changes would be helpful. This study was initiated to better define the vitamin E and Se status of month-old beef calves in common management systems.
The cattle used in this report were part of the University of California's Sierra Foothill Research and Extension Center beef cattle herd. The cattle ranch is located approximately 34 km east of Marysville, California, in the foothill grasslands. The herd is an early fall-calving. Angus and Angus-cross herd, and all cattle were grazed on dry foothill range or irrigated pasture. Cattle selected for the routine blood sampling were clinically normal cow and calf pairs. Three groups of 10 cow and calf pairs were randomly selected for inclusion and sampling. All cows had been grazed on their respective pastures for 10 weeks before sampling. The calves were approximately 34 days old at the time of sampling (mean = 33.8 ± 5.4 days old). Group 1 consisted of 10 primiparous cow/calf pairs on irrigated pasture that received no supplements of any kind, and the calves were not given a Se/vitamin E injection at birth. Group 2 consisted of 10 primiparous cow/calf pairs on the same irrigated pasture as group 1. They received no supplements of any kind, and the calves received 2.5 mg Se and 25 mg vitamin E as a subcutaneous injection at birth. a Group 3 consisted of 10 multiparous cow/calf pairs grazing dry foothill pastures and consuming an average of 454 g of molasses-based supplement per cow per day. This supplement contained vitamin E (118 mg/kg) and Se (6.9 mg/kg) on an as-fed basis. Therefore, the average daily consumption of supplemental vitamin E and Se by these cows was 53.6 mg and 3.1 mg, respectively. Group 3 calves were also administered 2.5 mg Se and 25 mg vitamin E subcutaneously at birth. a The cow/calf pairs were sampled on the same day. Blood was collected via jugular venipuncture in ethylenediamine tetra-acetic acid (EDTA) tubes (Se analysis) and heparin tubes (vitamin E). b The plasma in the heparin tubes was separated immediately and transferred to tubes wrapped in tinfoil, frozen, and transmitted to the laboratory for analysis.
Blood Se was analyzed by inductively coupled argon plasma emission spectroscopy c using hydride generation. 18 Vitamin E analysis was performed using a previously reported method. 19 In brief, vitamin E (α-tocopherol) was extracted from plasma with petroleum ether after precipitation of proteins with ethanol. The concentrations of vitamin E were determined by high-performance liquid chromatography d using fluorescence detection. e Results for vitamin E were reported as μg/ml (ppm) and results for Se were reported as ng/ml (ppb).
Serum vitamin E and whole blood selenium (Se) concentrations in 3 groups of cows housed on irrigated pasture with no supplement (groups 1 and 2) or native dry range with a molasses-based supplement containing vitamin E and Se (group 3).
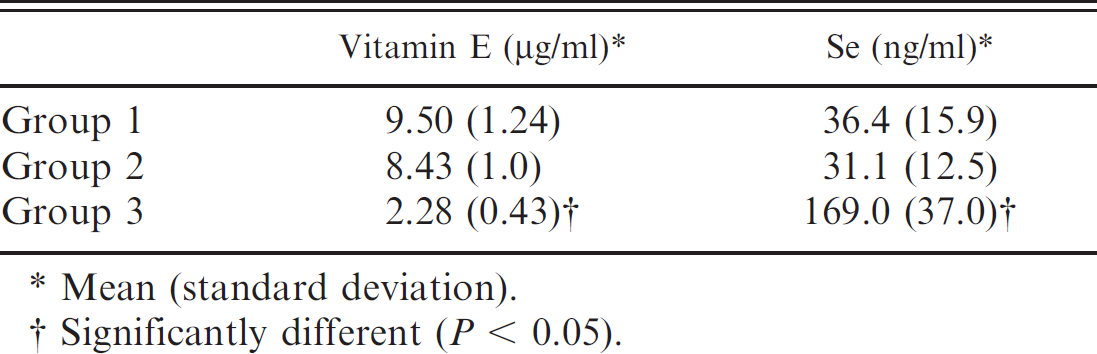
Mean (standard deviation).
Significantly different (P < 0.05).
Data was entered into and analyzed using a commercially available software program. f Mean and standard deviation for vitamin E and Se were calculated separately for cows and calves in each treatment group. Means were compared using a one-way analysis of variance. The Bonferroni method was used for post-hoc analysis to adjust for multiple comparisons. Pearson's correlation coefficient was calculated to assess the degree of linear association between variables. Results were considered significant if the P value was less than 0.05.
Cows on dry foothill pastures (group 3) had lower vitamin E levels than cows on irrigated pasture (groups 1 and 2), despite being fed a vitamin E-containing supplement. However, the supplemented cows did have higher Se levels than the nonsupplemented cows (Table 1). Calves in all groups had relatively low concentrations of vitamin E, particularly calves nursing cows on dry pasture (group 3). Calves born to Se-supplemented dams and receiving Se/vitamin E injections at birth (group 3) had significantly higher (P < 0.05) Se concentrations than calves in groups 1 and 2 (Table 2). A number of significant correlations were detected (Table 3). The concentration of Se in cows was strongly correlated to Se concentrations in their calves (Fig. 1). The vitamin E concentration in cows was positively correlated to vitamin E concentrations in their calves (Fig. 2). Calf Se concentration was negatively correlated to cow vitamin E concentrations (Table 3), and cow Se concentration was negatively correlated to cow vitamin E (Table 3).
Serum vitamin E and whole blood selenium (Se) concentrations in 3 groups of 30-day-old calves nursing from cows housed on irrigated pasture (groups 1 and 2) or native dry range with a molasses-based supplement containing vitamin E and Se (group 3). Calves in groups 2 and 3 were administered 2.5 mg Se and 25 mg vitamin E subcutaneously at birth.
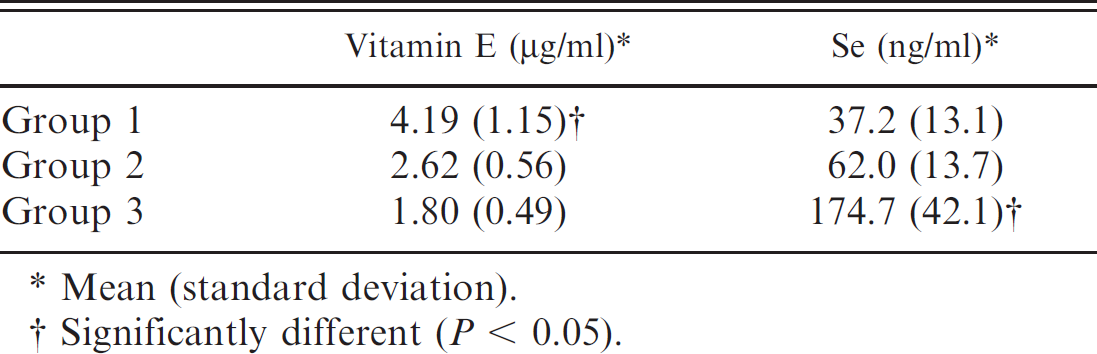
Mean (standard deviation).
Significantly different (P < 0.05).
Matrix of Pearson's correlation coefficients between vitamin E and selenium (Se) concentrations in cows and their calves.*
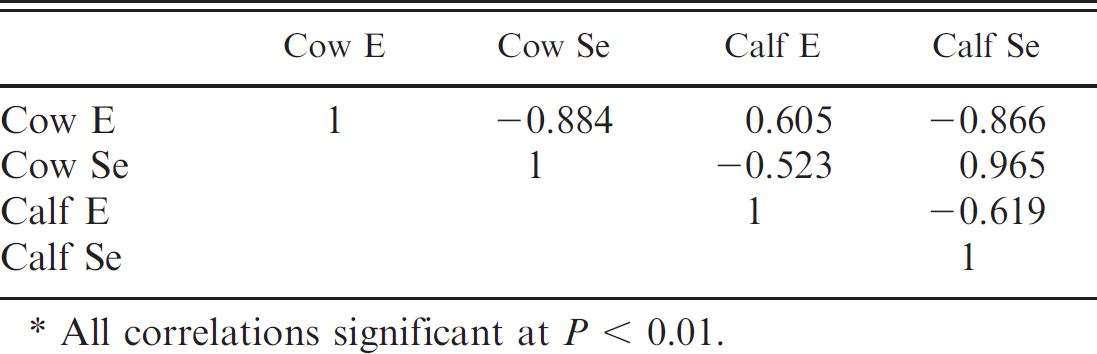
All correlations significant at P < 0.01.
Vitamin E is a term used to describe all tocol and tocotrienol derivatives that exhibit biologic activity similar to α-tocopherol. There are 8 naturally occurring vitamin E isomers. Of these 8 isomers, α-tocopherol is the natural isomer that has been proven most effective in preventing vitamin E deficiency syndromes and is the most biologically active isomer. Green pasture and fresh green feeds have very high contents of vitamin E compounds (particularly α-tocopherol), and hays, silages, and dry grasses are thought to have low concentrations of vitamin E. 11 These latter types of feeds can make up the entire diet of beef cows before and after calving. Calves are born with low stores of vitamin E, because it crosses the placenta in limited amounts, 6,7 and colostrum is the primary source of vitamin E in neonatal calves. 6,7 Plasma α-tocopherol concentrations of 0.6–1.6 μg/ml have been associated with NMD in calves in a feedlot environment. 2 Serum α-tocopherol concentrations of 1.0–1.5 μg/ml were associated with NMD in Irish cattle, 14 and values <2 μg/ml were considered deficient. 14 Serum α-tocopherol concentrations >4.0 μg/ml have been reported to be adequate in adult dairy cattle. 3 Canadian researchers testing 10 clinically normal cows from 5 different herds found mean serum vitamin E concentrations in the 5 herds to range from 2.19–5.3 μg/ml. 8 Another author estimated that serum vitamin E concentrations from 0.8–1.2 μg/ml should be the reference range for cattle. 15
The authors could not find reports in the literature that document expected plasma or serum vitamin E concentrations for beef calves of approximately 30 days of age. The vitamin E status of preruminant calves at approximately 30 days of age is an important missing set of data and the primary reason for this report. The mean concentrations in the 3 groups of calves in the present study ranged from 1.8–4.19 μg/ml. Some reports 15 would suggest that this is within the reference range for cattle, while others would suggest that values below 2 μg/ml are deficient. 2,14 It should be noted that these clinically normal month-old beef calves had vitamin E concentrations well below the values of their dams, irrespective of the nutritional or management program in place. Additionally, calves from cows on dry feed, despite being supplemented with 53 mg vitamin E per cow per day, had much lower concentrations than other calves (groups 1 and 2) and would be considered deficient by some reports. 14 This report demonstrates a positive correlation between cow vitamin E and calf vitamin E; however, it should be noted that preruminant beef calves can have low to deficient vitamin E concentrations under variable management systems.
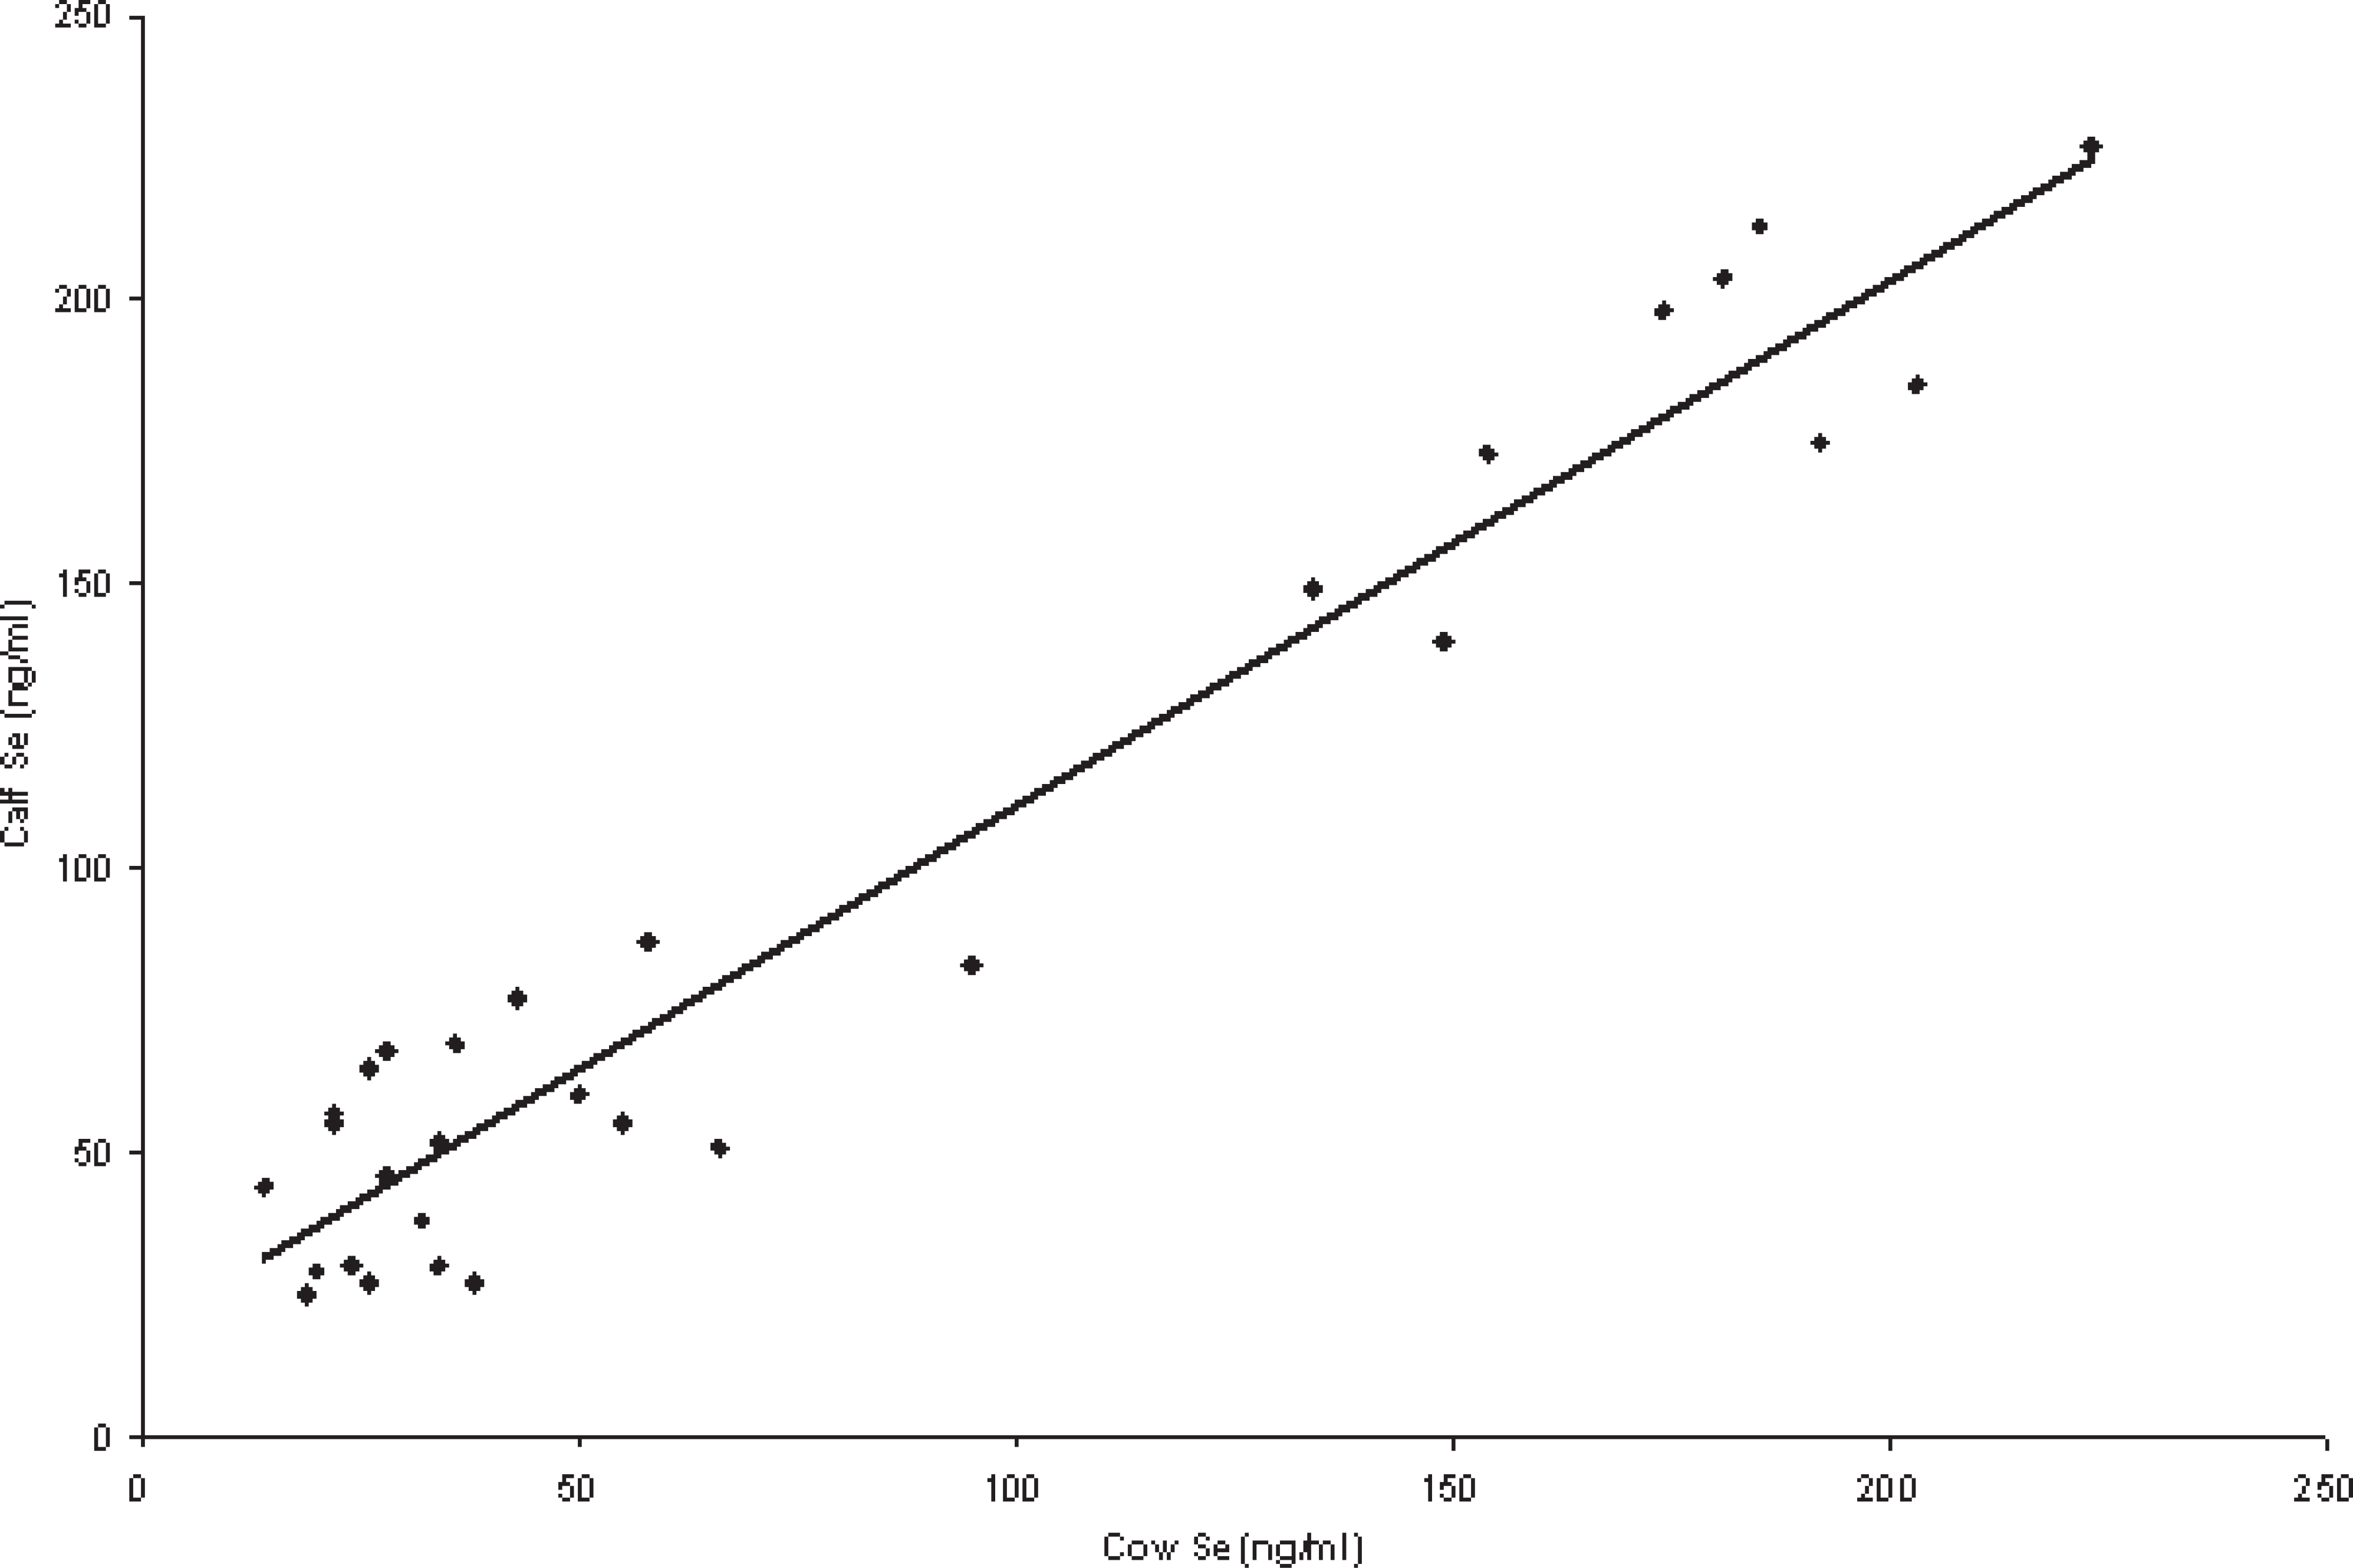
Plot of selenium concentrations in cows and their calves with the linear regression line superimposed.
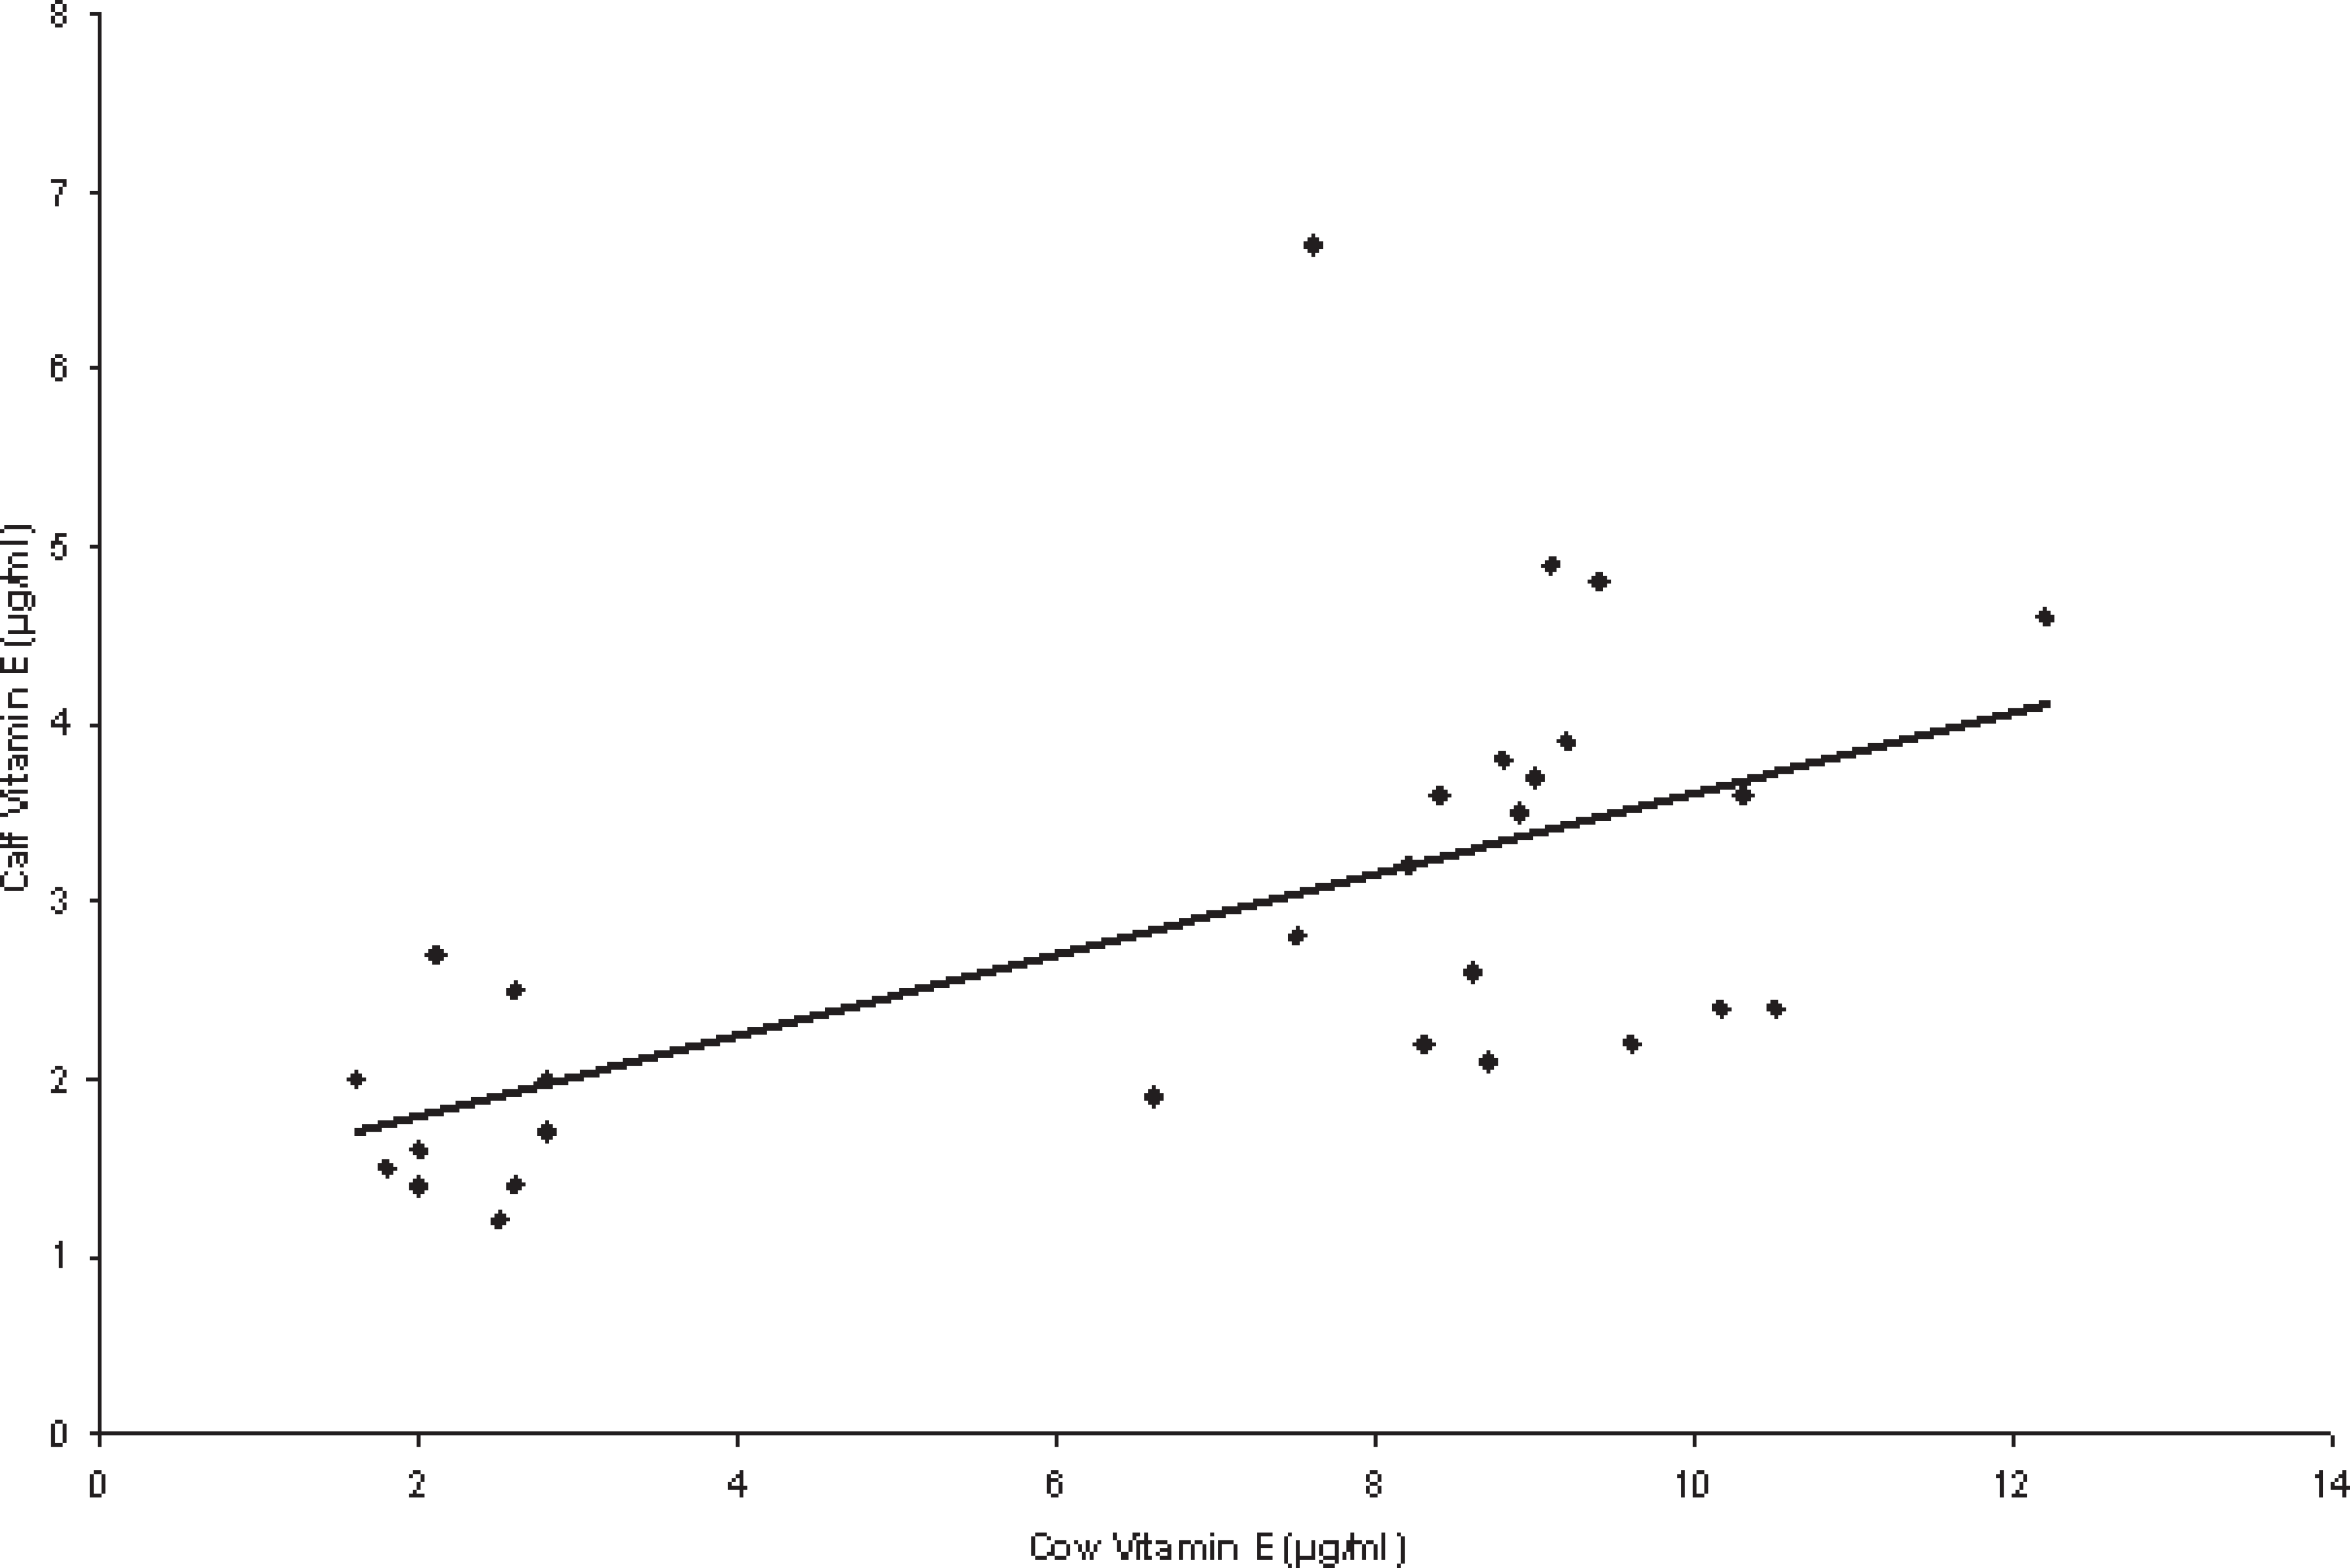
Plot of vitamin E concentrations in cows and their calves with the linear regression line superimposed.
It has been reported that blood Se concentrations <0.05 μg/ml (50 ng/ml) are considered diagnostic of frank deficiency, and clinical signs, such as NMD, can occur at these levels. 12 Others have suggested that the reference range for Se in cattle is 0.08–5.0 μg/ml (80–5,000 ng/ml) in blood. 12,16 Se is known to cross the placenta to the calf easily 10 ; however, it is not transferred well through colostrum or milk. 4,10 Therefore, the Se status of the cow before calving is an important determinant in the Se status of calves. 4,10 Additionally, the increase in blood Se concentration after Se injections is thought to be negligible after 28 days. 13 The blood Se concentrations of calves in groups 1 and 2 were considered deficient and marginal, respectively. 12,16 The calves in group 2 tended to have higher blood Se than those in group 1, and this difference was associated with a Se injection at birth for group 2 calves; however, this difference was not significant (P < 0.05). This finding is consistent with reports that increases in blood Se after injection wane at 28 days. 12
The negative correlations seen in the current study between calf Se and cow vitamin E, cow Se and cow vitamin E, and calf Se and calf vitamin E (Table 3) are almost certainly aberrations due to the management systems. The cows in group 3 on dry feed had very low vitamin E intake, but they were consuming 3 mg Se daily, and their calves were injected with Se at birth. These cows and calves (group 3) had much higher Se concentrations versus the cattle in groups 1 and 2; however, vitamin E was virtually lacking in their diets. In contrast, groups 1 and 2 had high dietary levels of vitamin E and were essentially Se deficient. Therefore, the reasons for the marked negative correlations were the nutritional differences in the 3 management groups.
This report supplies additional data relative to expected plasma vitamin E and blood Se concentrations in month-old beef calves in 3 common management systems. The data demonstrate a significant dependence on vitamin E and Se supplementation and dietary intake of both the cow and the calf on blood Se and plasma vitamin E concentrations. Therefore, information on supplementation and management systems should be provided as part of the case history to aid in the interpretation of diagnostic data. The data also suggest that plasma vitamin E concentrations in preruminant 30-day-old calves are not expected to be above 2–4.5 μg/ml on average. In addition, similar calves nursing from cows on dry feed are expected to be have plasma vitamin E concentrations below 2 μg/ml.
Footnotes
a.
Mu-Se, Schering-Plough Animal Health Corporation, Union, NJ.
b.
Vacutainer 369735 (heparin), 368381 (EDTA) Becton, Dickinson, Inc., Franklin Lakes, NJ.
c.
ARL, Accuris Model, Thermo Optek Corporation, Franklin, MA.
d.
Waters 2690 High Performance Liquid Chromatography, Waters Corp., Milford, MA or Agilent 1100 series High Performance Liquid Chromatography, Agilent Technologies, Inc., Santa Clara, CA.
e.
Waters 2475 Multi Fluorescence Detector, Waters Corporation, Milford, MA.
f.
SPSS 15.0 for Windows, SPSS, Inc., Chicago, IL.