
Abstract
We evaluated the performance of a third-generation fluorescence enzyme immunoassay kit (FEIA; Tosoh Bioscience) for progesterone (P4) measurement in canine serum to identify the day of luteinizing hormone (LH) peak and ovulation in bitches. We conducted P4 assays on 54 serum samples using a FEIA and a chemiluminescence immunoassay (CLIA; Siemens). For the FEIA kit, the linearity test, recovery test, inter- and intra-assay CVs, and total error observed (TEo) were calculated. Serum samples from 28 bitches were used to evaluate the association of P4 concentration with the day of LH peak and the day of ovulation based on P4 thresholds (P4 ≥ 2 ng/mL, and doubling at 4–8 ng/mL in the following 48 h), and with pregnancy length. Linearity was 75–97% and 86–94% for high (37.0 ng/mL) and medium (3.8 ng/mL) pool serum samples, respectively. Recovery was 86.4–119%. Intra-assay CVs were 2.6%, 3.3%, and 5.2% for low (0.23 ng/mL), medium (6.24 ng/mL), and high (38.3 ng/mL) pool concentrations. Inter-assay CVs were 2.22% and 2.53% for P4 concentrations of 2.70 ng/mL and 8.2 ng/mL, respectively. TEo was 8.72% and 22.7% for P4 concentrations of 2 and 8 ng/mL, respectively. The mean pregnancy length from the day of LH peak and ovulation were 64.6 ± 1.7 and 63.3 ± 1.1 d, respectively. The third-generation FEIA kit that we tested was highly reliable.
Ovulation time is often requested when bitches of reproductive value undergo long travel for mating with the chosen male, or when they undergo artificial insemination (AI) with fresh, chilled, or frozen-thawed semen. Detection of the ovulation day is especially important in cases of AI with low-concentration or low-quality semen or frozen semen. AI with fresh or chilled semen is usually performed 3–5 d after the LH peak. 7
At the beginning of proestrus, progesterone (P4) concentrations are low (0.2–0.4 mg/mL) and rise slowly until reaching 0.6–1 ng/mL before the LH peak. 4 Some authors consider the LH peak as the day on which P4 is >1.5 ng/ml, with a mean value of 2 ng/mL 10 ; others consider 3 ng/mL as a reference value. 17 In bitches, ovulation occurs 48–60 h after the LH peak, and has been correlated with different ranges of P4 values: 4–10 ng/mL, 8 6.44 ± 3.64 ng/mL, 10 4–8 ng/mL, 17 or >5 ng/mL at the first detection, even when previous P4 monitoring was not possible. 4 These differing P4 ranges may be the result of the various analytical methods used by different laboratories for the P4 assay.
The method used influences greatly the results obtained in a P4 assay.14,18 Among all assay methods, radioimmunoassay (RIA) is considered the gold standard because of its high sensitivity, specificity, and reliability. However, given the risks associated with radioactive waste, and the impossibility of performing daily analysis with quick results, many other methods are now used in clinical practice. The chemiluminescence immunoassay (CLIA) was the first alternative method to be validated for clinical use. 10 Many other immunoassays have since entered the market for P4 measurement in veterinary clinical settings,1,5,6,9,13,18 including the fluorescence enzyme immunoassay (FEIA).12,15 Performance of the various analytical methods is compared to RIA2,16 to validate kit methods1,5,16,18 and/or to determine a RI for LH peak or ovulation using different experimental methods. 6
Each analytical method has a different capacity to bind and quantify P4 in a given substrate; thus, many studies have reported comparison of the methods through analysis of correlations, linear regression, or level of agreement. Moreover, the performance characteristics of the different methods may change over time. Some authors have reported that P4 values obtained by CLIA are expected to be lower than those measured by RIA, 14 whereas others report the opposite results. 2 These differences may be the result of a change of the monoclonal antibody in the CLIA, together with the change from a 2-cycle to a 1-cycle competitive immunoassay in the CLIA method. The first-generation kit of the FEIA method was validated against liquid chromatography–tandem mass spectrometry in the canine species in 2016 15 ; however, since then, the manufacturer has modified and improved the P4 kit, with the release of a third-generation kit in 2016. We compared this third-generation human progesterone kit (ST AIA-PACK PROG-III, AIA-360 analyzer; Tosoh Bioscience) with the CLIA (Human progesterone assay, Immulite 1000; Siemens), which had been validated for bitches 10 and was in routine use in our laboratory before acquiring the new instrument. The analytical performance and the biological validation of this third-generation kit were the objects of our study.
The serum samples used were obtained from 6 healthy adult bitches, at different stages of the estrus cycle, who were presented to the Veterinary Teaching Hospital of the University of Padua, Italy for examination of the optimal breeding time or for a general health check-up. Owners and breeders of the bitches provided written consent for the use of the remaining stored sera in experimental procedures. Serum samples were assigned to one of the following P4 concentration categories: high (H = P4 >15 ng/mL), medium (M = P4 ≥3 and ≤6 ng/mL), and low (L = <0.1 ng/mL). Serum aliquots were thawed and mixed to obtain pools H, M, and L. Each pool was assayed again for P4 concentration to verify that its final concentration was within the pre-set criteria.
For the linearity test, 7 mL of L pool was used to dilute 2 mL of H pool and 1 mL of M pool to obtain 4 serial dilutions (1:2, 1:4, 1:8, 1:16) and 3 serial dilutions (1:2, 1:4, 1:8), respectively. For the recovery test, we obtained specific P4 concentrations (0.5, 1, 2, 4, 8, 10, 15 ng/mL) by successive dilutions in ethanol of 3 working solutions (10 μL, 40 and 20 ng/mL). One solution with P4 = 0 ng/mL, corresponding to 1 mL of pool L, was also made. For both recovery and linearity, each dilution point was analyzed in 5 replicates using the same kit. To determine intra-assay imprecision, 3 pools (36.2, 6.24, 0.23 ng/mL) were tested consecutively 3 times on the same day. For inter-assay imprecision, 2 pools (sample 1 concentration of 1–3 ng/mL; sample 2 concentration of 4–10 ng/mL) were measured for 5 consecutive days, with the samples maintained at +4°C.
For the comparison of methods, we used 54 samples, including samples from 49 bitches, in proestrus (n = 6), estrus (n = 22), diestrus (n = 9), pregnancy (n = 8), anestrus (n = 3), ovariectomy (n = 3), and unknown phase of the cycle (n = 5). They were split into 2 aliquots and analyzed by the same technician, once with the FEIA kit and once with the CLIA kit, according to the manufacturers’ instructions.
For the clinical performance of the FEIA kit, we investigated the association between the P4 concentration on the day of ovulation, or on the day of the LH peak, and the length of pregnancy. Serum samples from 28 healthy bitches were collected to monitor the optimal breeding or AI time. To evaluate the accuracy of the prediction of gestation length, the LH peak day was defined as the day with an initial increase in P4 concentration of ≥2 ng/mL. The day of ovulation was estimated to occur within 48–60 h after the LH peak or when the P4 concentration doubled in 24–48 h.8,15 Data on the date of birth of the first offspring were collected, and the interval between the observed or presumed LH peak and ovulation was calculated and included in statistical analyses. Data collected during the study period (October 2016–June 2019) included the estimated LH peak day, estimated day of ovulation, mating or AI, delivery of the first puppy, and litter size. Bitches with a single P4 monitoring value >11 ng/mL, or with a clinical outcome of pregnancy loss, reabsorption, miscarriage, or single puppy syndrome were excluded from data collection.
Statistical analysis was performed using SAS v.9.4 (SAS Institute). Mean ± SD, percentages of linearity, and percentages of recovery (both calculated as observed:expected, O:E %), CV, and a linear regression function were calculated for both linearity and recovery tests. For linearity, the slopes of the observed and expected regression curves were compared using analysis of covariance. Data were linearized using logarithmic transformation. Recovery was expressed as a regression curve between observed and expected P4 concentrations; a slope not statistically different from 1 was indicative of high assay accuracy. For inter- and intra-assay imprecision, x̄ ± SD and CV were calculated.
The total error observed (TEo) was calculated for 2 target levels of P4 (2 and 8 ng/mL). The formula used was TEo% = |bias| + 2*CV, in which bias = (target P4 concentration –measured)/target P4 concentration. For the comparison of the FEIA and the CLIA kits, a Passing–Bablok regression analysis was used to determine the constant and proportional error. The agreement between the results obtained using the 2 assays was measured using Cohen kappa. The prediction of parturition day was calculated by counting the ovulation-to-parturition (Ov-P) interval from the estimated day of ovulation or by the estimated day of LH peak.
The mean P4 concentrations obtained for the H, M, and L pools, measured on the day of the analysis, were 36.7 ± 1.2, 3.82 ± 0.12, and <0.1 ng/mL, respectively (Table 1). For linearity, the O:E ratio was 74.6–97.2%; correspondence was good between the expected and observed slopes of the validation curves of the H and M pools (Tables 1–3; Figs. 1, 2). For the recovery test, the O:E ratio was 86.4–120% (Table 2; Fig. 3). The slopes of the expected and observed concentrations were not statistically different from 1, indicating good correspondence between the expected and observed P4 results (Table 3). The intra-assay CVs of low, medium, and high serum samples were 2.55, 3.28, and 5.22%, respectively (Table 4); inter-assay CVs were 2.22 and 2.53% for P4 concentrations of 2.70 and 8.20 ng/mL, respectively (Table 5). TEo for P4 concentrations of 2 ng/mL was 8.72%, whereas it was up to 22.7% for P4 concentrations of 8 ng/mL.
Linearity of observed:expected (O:E) progesterone results for the fluorescence enzyme immunoassay third-generation kit in high (H) and medium (M) pool canine serum samples.
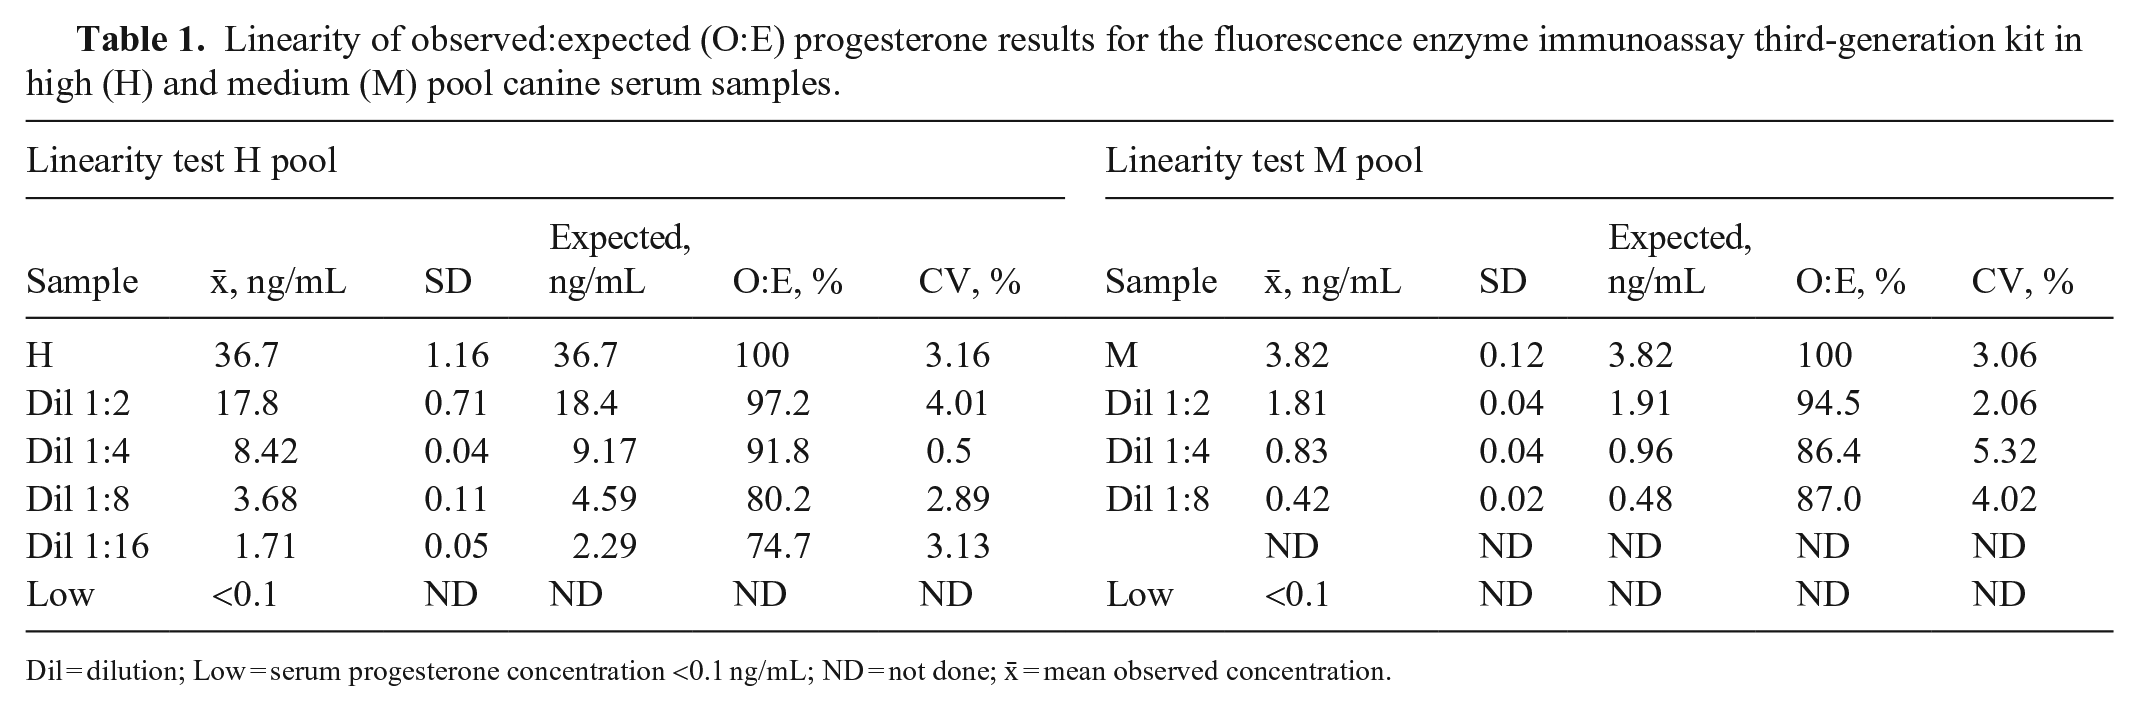
Dil = dilution; Low = serum progesterone concentration <0.1 ng/mL; ND = not done; x̄ = mean observed concentration.
Observed:expected (O:E) progesterone recovery results for the fluorescence enzyme immunoassay third-generation kit.
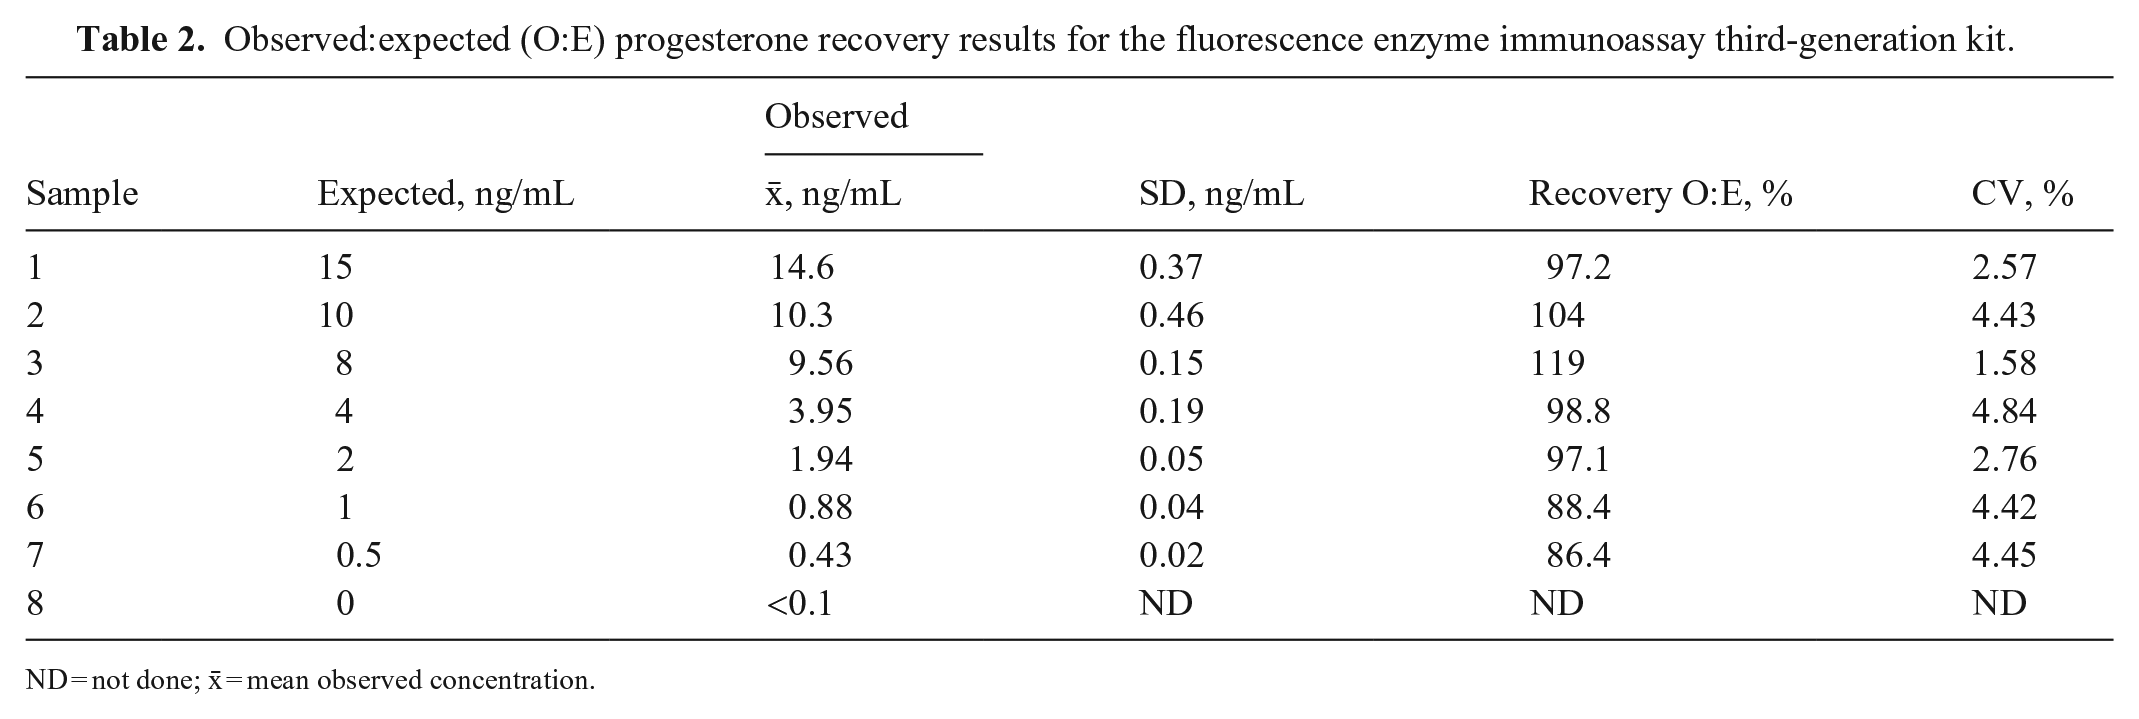
ND = not done; x̄ = mean observed concentration.
Validation of the progesterone fluorescence enzyme immunoassay third-generation kit for canine serum by analysis of covariance comparing the slopes of the expected and observed regression curves.
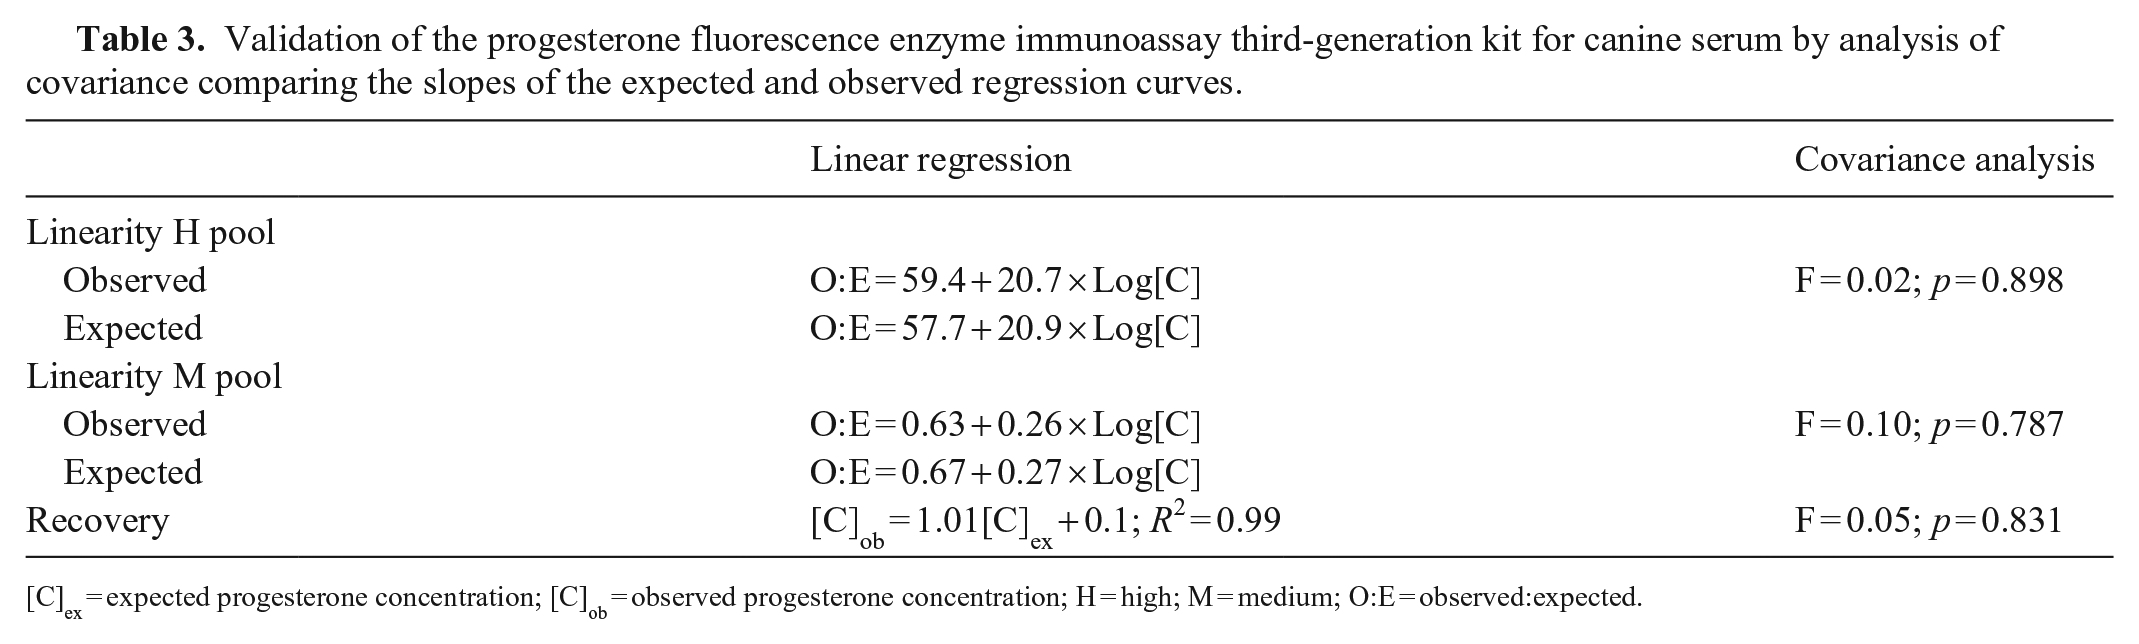
[C]ex = expected progesterone concentration; [C]ob = observed progesterone concentration; H = high; M = medium; O:E = observed:expected.
Intra-assay imprecision calculated on high, medium, and low progesterone concentration samples, analyzed 3 times on the same day with the third-generation fluorescence enzyme immunoassay kit.

x̄ = mean observed concentration.
Inter-assay imprecision calculated on 2 samples at different initial concentrations (sample 1 = 2.70 ng/mL; sample 2 = 8.20 ng/mL) analyzed on 5 consecutive days with the third-generation fluorescence enzyme immunoassay kit.
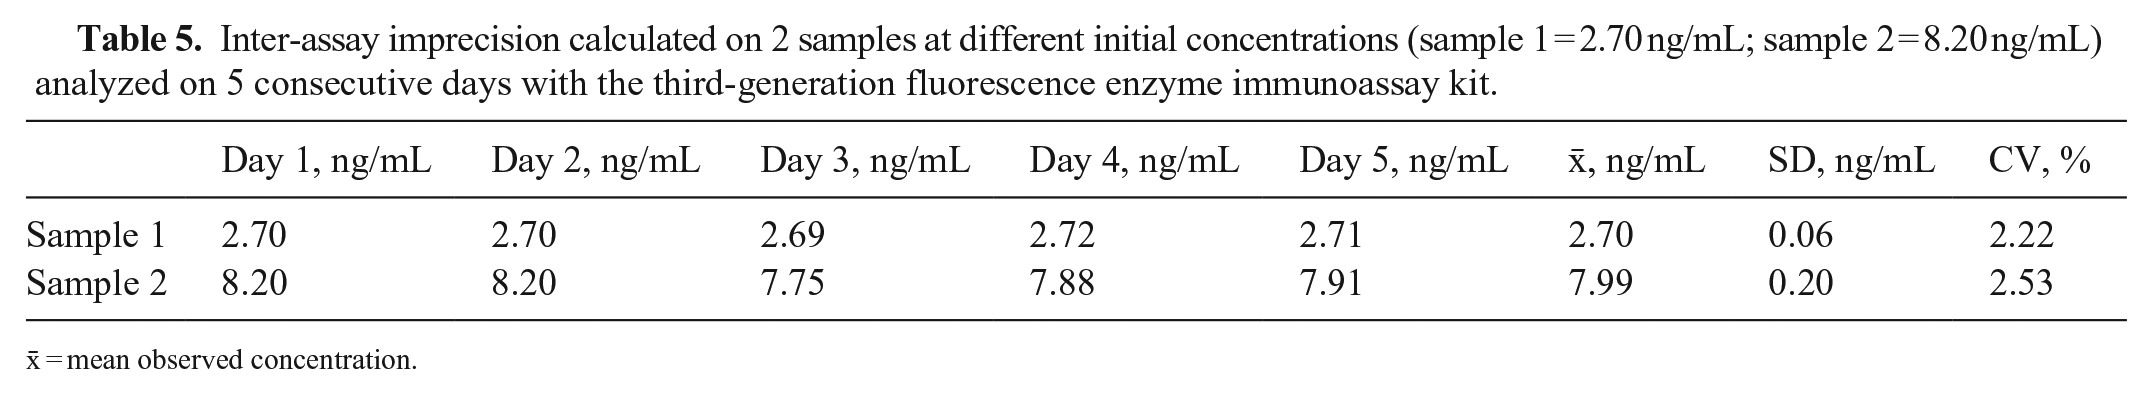
x̄ = mean observed concentration.
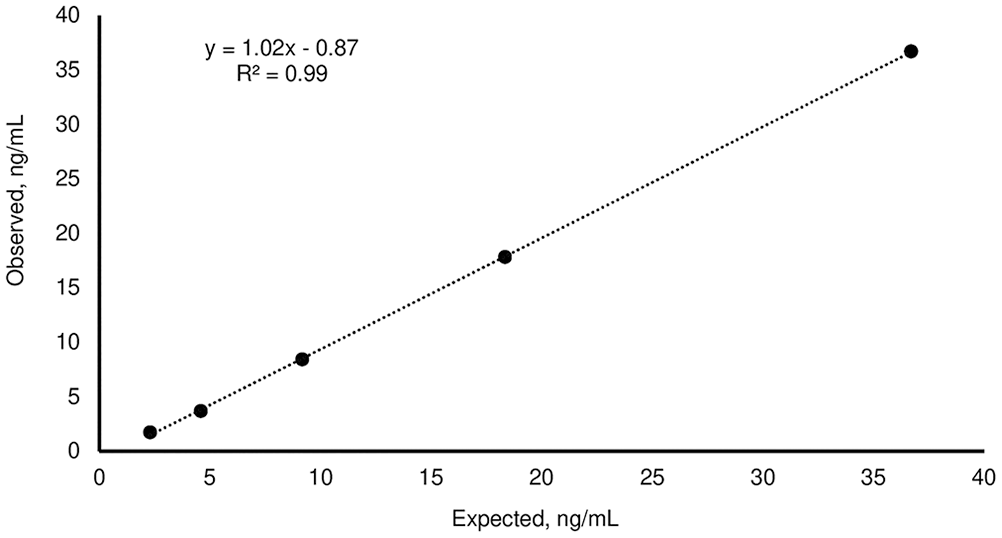
Linear regression of the observed:expected progesterone results for the third-generation fluorescence enzyme immunoassay kit, obtained by serial dilutions (1:2, 1:4, 1:8, 1:16) of the serum high with the serum “low”.
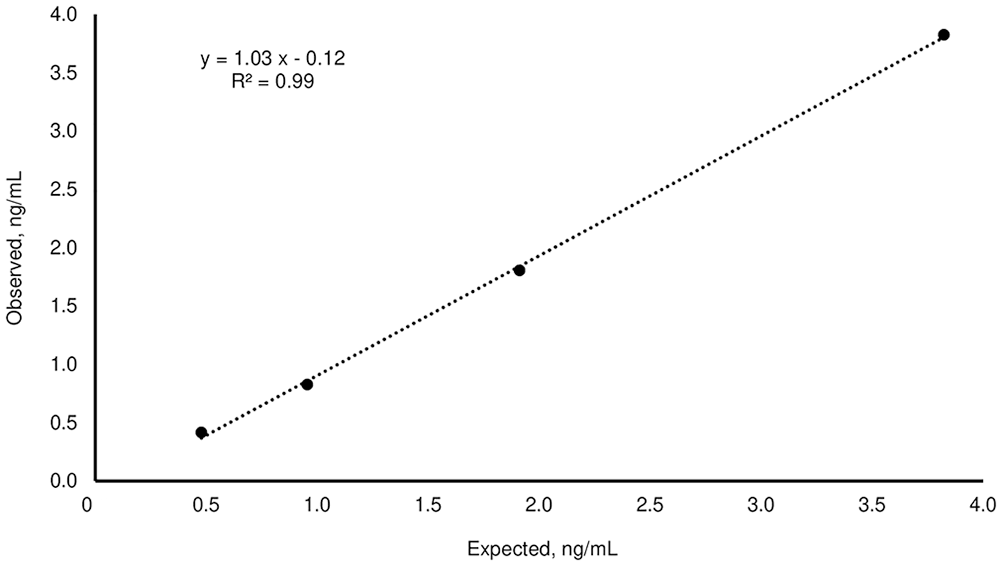
Linear regression of the observed:expected progesterone results for the third-generation fluorescence enzyme immunoassay kit, obtained by serial dilutions (1:2, 1:4, 1:8) of the serum medium with the serum “low”.
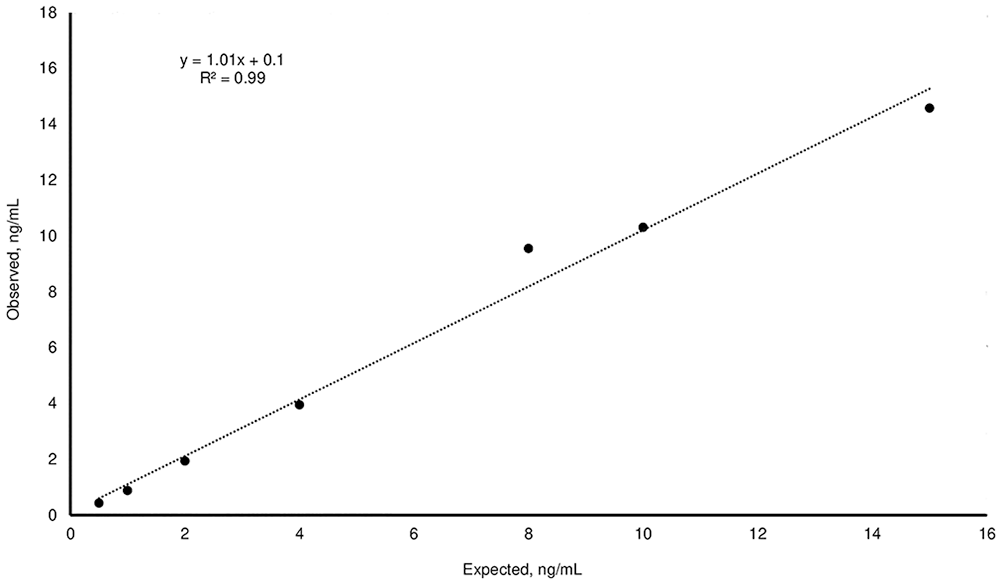
Recovery of the observed:expected progesterone results for samples at specific concentrations (0.5, 1, 2, 4, 8, 10, 15 ng/mL) analyzed with a third-generation fluorescence enzyme immunoassay kit. Dotted line is the linear regression.
The Passing–Bablok regression values of 0.46–27.3 ng/mL for the FEIA kit and 0.33–20 ng/mL for the CLIA kit (n = 54), generated a slope of 1.3724 (95% CI: 1.22–1.56) and an intercept (constant error) of −0.919 ng/mL (95% CI: −1.89 to −0.441). The agreement test revealed a low level of agreement (κ = 0.38, p = 0.004) when the values of both methods were within the range of clinical interest (>1.5 ng/mL and <10 ng/mL, n = 48).
We examined 18 estimated day of LH peak-to-parturition intervals (LH-P), and 20 estimated days of Ov-P intervals (Fig. 4). Mean pregnancy length of LH-P was 64.6 ± 1.7 d, distributed as follows: 65 ± 1 d in 11 of 18 cycles, 65 ± 2 d in 15 of 18 cycles, and 65 ± 3 d in 17 of 18 cycles. Mean pregnancy length for Ov-P interval was 63.3 ± 1.1 d, with a distribution in the range of 61–66 d as follows: 63 ± 1 d in 17 of 20 cycles, 63 ± 2 d in 19 of 20 cycles, and 63 ± 3 d in 20 of 20 cycles. The mean P4 concentration obtained on the estimated day of LH peak was 2.28 ± 0.76 ng/mL; the mean P4 concentration on the estimated day of ovulation was 7.80 ± 2.10 ng/mL. The average litter size was 7.1 ± 3.0 pups.
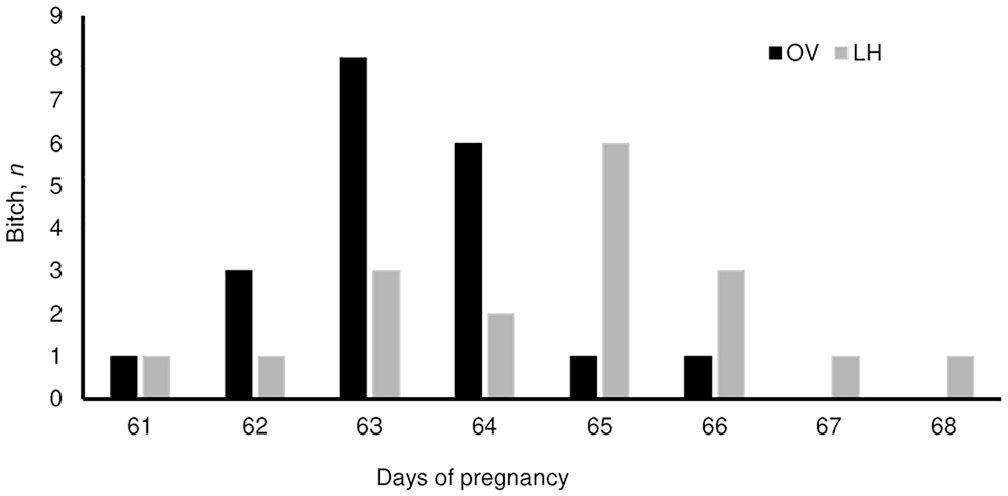
Distribution of the frequencies of pregnancy length based on the interval between estimated day of luteinizing (LH) peak and parturition (n = 18, gray bars) and between estimated day of ovulation (OV) and parturition (n = 20, black bars), calculated with the third-generation fluorescence enzyme immunoassay.
In our test plan, we defined a concentration range that was of clinical value for the identification of optimal ovulation and breeding time. 10 Most of our results were within the range considered normal for good linearity. The dilutions of 1:8 and 1:16 of the serum H pool are exceptions, with slightly lower linearity percentages. Our results were similar, although lower, than those reported by others, 12 who tested linearity at different concentration levels (34.7, 20.2, and 16.7 ng/mL).
The P4 concentrations considered in our recovery test were in the range of 0.5–15 ng/mL, which is useful for identifying ovulation together with the pre- and post-ovulation concentrations of P4. The CVs of 2.55–5.22% (intra-assay) and 2.22–2.53% (inter-assay) indicate optimal precision of the FEIA kit used for the P4 analysis. This is in line with CVs reported in other studies.1,12,15 We found the highest CV for those concentrations that were very close to the lower limit of detection of the kit, set by the manufacturer at 0.1 ng/mL.
Our results were precise in the prediction of the parturition day when counted from the LH peak and from the day of ovulation; 83% and 95% of described cases, respectively, are in the range considered normal in the literature. 3 Our results are in line with those reported elsewhere 15 ; a pregnancy length of 62.9 ± 1.8 d was reported from the day of ovulation, with an accuracy of 83.6%. 15 Numerous studies have shown that the day of the LH peak can be retrospectively estimated by measuring the P4 concentration. 10 A P4 concentration of 0.9–3.0 ng/mL corresponds to the day of the LH peak. The interval of LH peak-to-parturition obtained in our study is very similar to that reported by others. 11 Our calculation was for 67%, 90%, and 100% of cases at 65 ± 1, 65 ± 2, and 65 ± 3 d, respectively.
An abstract reported a high level of agreement between the results of the FEIA and enzyme-linked fluorescent assay methods, and that results of both methods led to the same clinical decisions. 11 In contrast to that study, we found a low level of agreement (κ = 0.38, p = 0.004) between the third-generation FEIA kit and CLIA, thus leading us to include the biological validation in order to understand the precision of the prediction of each method.
The limitations of our study include a low number of repetitions of the samples assayed to calculate the intra- and inter-assay CVs, which could have led to a low CV. The criteria that we adopted for the estimation of LH peak and ovulation were based on values reported in the literature.4,8,10,17
Our linearity and recovery test results showed the high reliability of the third-generation FEIA kit used with the AIA-360 instrument. In addition, the accuracy of the prediction of gestational length was very high, which suggested that the determination of ovulation was accurate. Further investigations are needed regarding the P4 value correlation and agreement between results obtained with the FEIA kit and other analytical methods.
Footnotes
Acknowledgements
We thank Futurlab and Dr. Davide Benin who provided the kits, and Dr. Barbara Contiero for statistical advice.
Declaration of conflicting interests
The authors declared no potential conflicts of interest with respect to the research, authorship, or publication of this article.
Funding
Financial support for this study was provided by the Italian Ministry of University and Research (MUR, DOR1779592/17).