
Abstract
Canine α1-proteinase inhibitor (cα1-PI), a proteolysis-resistant protein with a molecular weight similar to albumin, has been shown to be clinically useful as a marker for gastrointestinal protein loss in dogs. A competitive, liquid-phase radioimmunoassay was developed and analytically validated. Fecal samples were collected from 101 healthy pet dogs of various breeds and ages, and fecal cα1-PI (Fcα1-PI) concentrations were compared between dogs of different age groups. A reference interval for Fcα1-PI concentration was calculated using the central 95th percentile. Analytical sensitivity of the assay was 2.2 µg Fcα1-PI/g feces. Observed-to-expected ratios for the serial dilution and spiking recovery of 9 and 6 fecal extracts ranged from 90.4 to 152.0% and from 71.3 to 112.3%, respectively. Coefficients of variation for intra- and interassay variability for 6 fecal extracts were ≤10.8% and ≤12.5%, respectively. The reference intervals for the mean and maximum Fcα1-PI from fecal samples collected on 3 consecutive days were 2.2–13.9 µg/g and 2.2–21.0 µg/g, respectively. Fcα1-PI was significantly higher in dogs <1 year of age (P < 0.0001 for both mean and maximum Fcα1-PI for the 3 samples). The radioimmunoassay described is sensitive, linear, precise, reproducible, and accurate for clinical use, thus allowing reliable quantification of Fcα1-PI in clinical patients. Using this assay, a mean or a maximum Fcα1-PI for 3 sampling days of >13.9 µg/g or >21.0 µg/g, respectively, should be considered abnormal in dogs >1 year of age. Fecal cα1-PI concentrations in dogs <1 year of age were significantly higher and should be carefully interpreted in this age group.
Keywords
Introduction
Gastrointestinal protein loss can occur with a variety of gastrointestinal (GI) disorders (such as inflammatory bowel disease, intestinal lymphangiectasia, alimentary lymphoma, gastrointestinal parasitism, viral diseases, or chronic intussusception) as well as with non-GI diseases (e.g., venous hypertension due to cardiac disease) that lead to protein malabsorption, loss of proteins through the gastrointestinal mucosa, or both. 18 Aside from its diagnostic value, as patients with protein-losing enteropathy (PLE) may or may not present with typical clinical signs (e.g., small bowel diarrhea and weight loss), this loss of protein represents an objective measure for the assessment of disease progression. However, the diagnosis of PLE can be challenging, and it is desirable to assess GI protein loss as early as possible during the course of the disease, before the concentration of serum proteins has progressively decreased and patient morbidity increases as a consequence to severe hypoalbuminemia and the loss of other vitally important proteins (e.g., immunoglobulins).
As a “gold standard” diagnostic test, the excretion of 51Cr-albumin in feces to confirm GI protein loss is not only limited by practical constraints but is also reserved to be performed at tertiary veterinary medical institutions. Alpha1-proteinase inhibitor (α1-PI) is a proteolysis-resistant protein with a molecular weight that is similar to that of albumin. 11 The concentration of canine α1-PI in feces (Fcα1-PI) has been shown to be clinically useful as a marker for GI protein loss in dogs (Fig. 1), 13,14 and to be increased before the onset of clinical signs and/or hypoalbuminemia or panhypoproteinemia in Soft Coated Wheaten Terrier dogs with familial PLE (Vaden SL, Vidaurri A, Levine JF, et al.: 2002, Fecal α1-proteinase inhibitor activity in Soft-Coated Wheaten Terriers. J Vet Intern Med 16:382. Abstract). Thus, the measurement of cα1-PI in fecal samples has been reported to be useful for the early detection of GI protein loss.
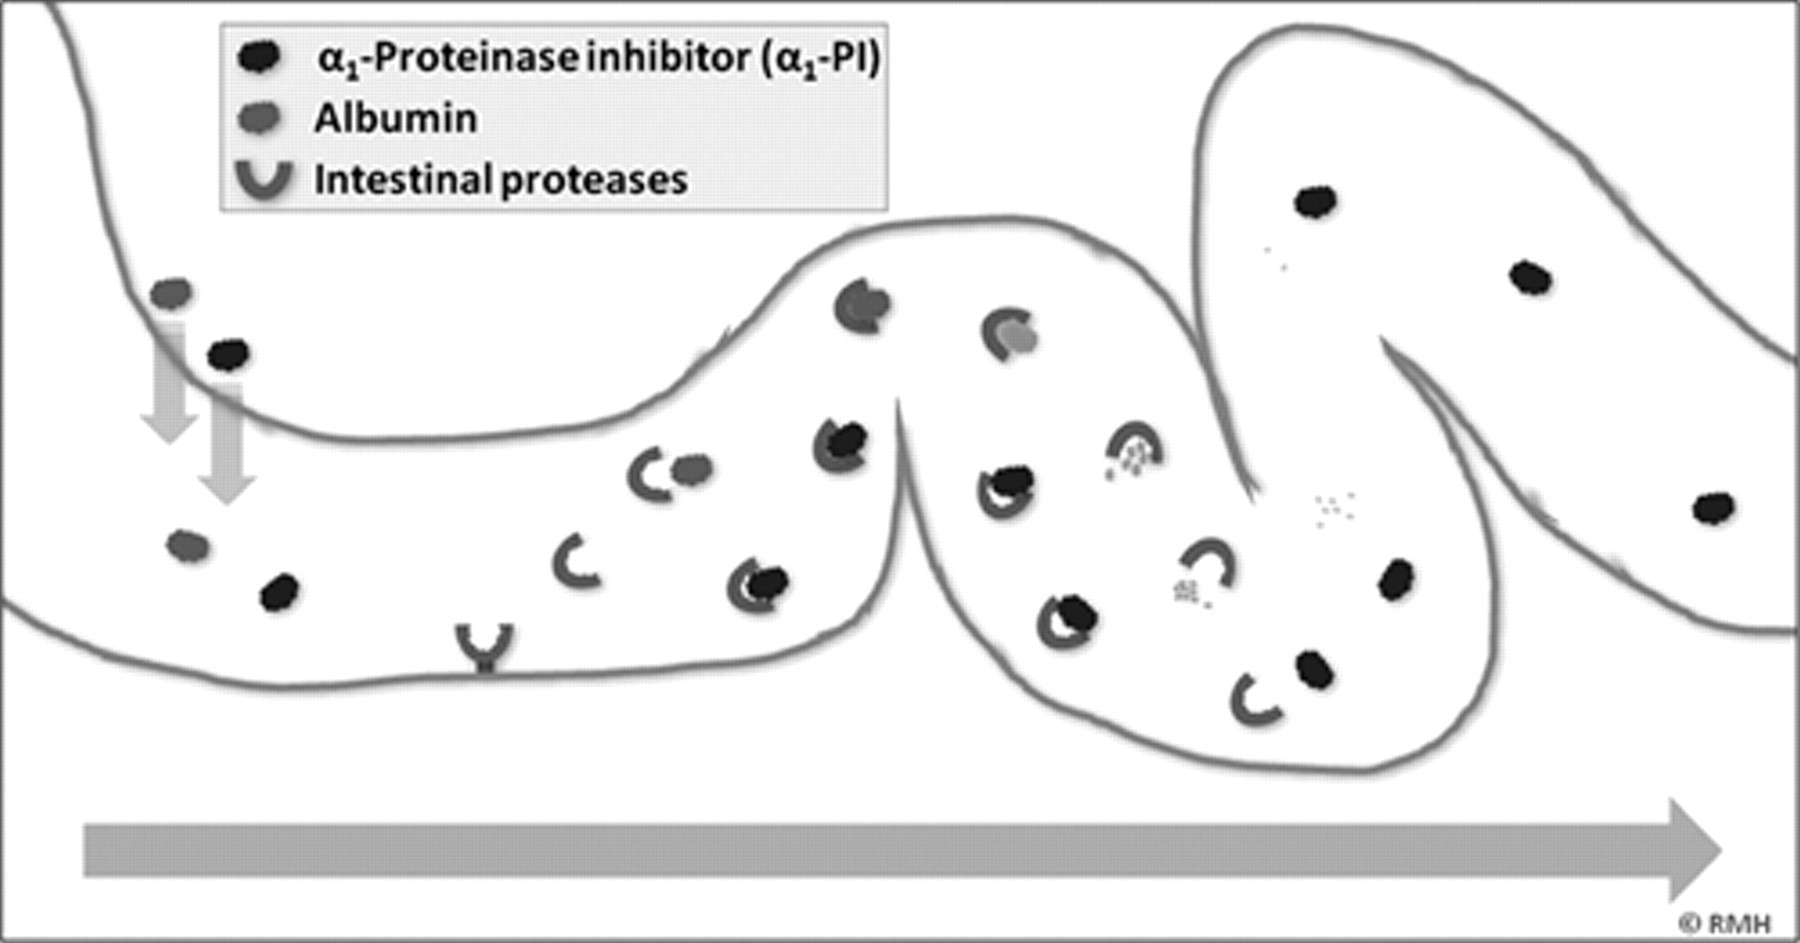
Canine α1-proteinase inhibitor (cα1-PI) has a molecular weight similar to that of albumin and is only present at high concentrations in the gastrointestinal lumen when there is loss of proteins as a result of gastrointestinal disease. Unlike albumin, cα1-PI resists proteolysis due to its inhibitory activity towards proteinases, and can therefore be quantitatively analyzed in fecal samples.
Radioimmunoassay (RIA) and enzyme-linked immunosorbent assay (ELISA) are both established immunologic methods with a high analytical sensitivity that both have inherent advantages and disadvantages. While ELISA methods usually are of higher analytical sensitivity, RIAs are usually easier to control and standardize than ELISAs. Although RIAs require special equipment and the use of a radioactive tracer, they have the advantage of not requiring purification and labeling of large amounts of antibodies from ideally 2 different individuals of a heterologous species, but usually only require a small volume of a heterologous antiserum. An ELISA for the measurement of cα1-PI concentration in fecal samples from dogs has previously been developed and analytically validated, 10 but due to the large amount of anti–cα1-PI antibodies needed, this small-scale manufacturing methodology was difficult to maintain long-term and has been discontinued, as the original source material was no longer available. Therefore, the current study was aimed at the development and analytical validation of a new RIA suitable for quantifying Fcα1-PI (as a clinical marker for GI protein loss in dogs) in a large number of samples, the de novo determination of a reference interval from a large number of healthy dogs, and to compare Fcα1-PI concentrations measured in healthy dogs above 1 year of age to that in healthy puppies, as it had been previously noticed that Fcα1-PI concentrations are occasionally increased in puppies, yet Fcα1-PI has never been studied in healthy puppies.
Materials and methods
Collection of fecal specimens from dogs
Samples of naturally passed feces were collected from 73 healthy adult pet dogs of various breeds (median age: 3.8 years, range: 1.0–17.3 years), and from 28 healthy pet dog puppies of various breeds (mean age: 6.1 months; range: 1.8–10.7 months). All dogs had been vaccinated and dewormed regularly prior to fecal sample collection, did not show clinical signs of GI disease, and did not receive any medications or had any medical conditions known to affect the GI tract. As a high intra-individual variability of cα1-PI in fecal samples has been reported (Steiner JM, Ruaux CG, Miller MD, et al.: 2003, Intra-individual variability of fecal α1-proteinase inhibitor concentration in clinically healthy dogs. J Vet Intern Med 17:445. Abstract), samples were collected from 3 bowel movements from 3 consecutive days for each dog, placed into pre-weighed polypropylene tubes, a and immediately frozen until extraction.
For extraction, feces were then thawed and extracted as previously described. 10 Briefly, aliquots of approximately 1.0 g wet weight were diluted 1:5 in phosphate buffered saline b (PBS) supplemented with 5% (v/v) newborn calf serum, c 1% (v/v) Triton X-100, d and 0.25 mM thimerosal. After homogenization by vortexing for 20 min at room temperature (approximately 23°C), the suspensions were centrifuged for 20 min at 2,100 × g and 5°C. Supernatants were collected using serum filters, e and were centrifuged again for 30 min at 10,600 × g and approximately 23°C. The final supernatants (fecal extracts) were stored frozen at −80°C until analysis.
Production of tracer
Canine α1-PI was purified from pooled canine serum as previously described, 11 and a tracer was produced by labeling purified cα1-PI with radioactive iodine (125I) using the chloramine T method. 7 Briefly, purified cα1-PI (1.0 mg/ml in PBS) was dissolved in 0.25 M sodium phosphate (pH 7.5). Chloramine T (2 mg/ml), sodium metabisulfite (0.4 mg/ml), potassium iodide (2 mg/ml), and bovine serum albumin (BSA; 10% [w/v]) were prepared in 0.05 M sodium phosphate (pH 7.5). The radio-iodination mixture consisted of 10.0 µg of cα1-PI, 10.0 µl of Na125I (1.0 mCi at the time of production), and 10 µl of chloramine T. After 30 sec of incubation at approximately 23°C, 100 µl of sodium metabisulfite (40 µg) and 860 µl of potassium iodide (1.72 mg) were added. 125I-labeled cα1-PI was separated from free 125I by loading the mixture onto a desalting column f equilibrated with 10% (w/v) BSA and using RIA buffer (RIAB: 0.05 M sodium phosphate, 0.02% [w/v] NaN3, 0.5% [w/v] BSA [pH 7.5]) as mobile phase. Fractions containing radio-labeled cα1-PI were tested with the antiserum and selected based on the percentages of nonspecific binding (NSB) and tracer (TC)-binding of the zero standard (B0/TC). The protein fraction with the lowest NSB (<5%) at a B0/TC ratio of approximately 50% was diluted in RIAB to approximately 40,000 counts/min (cpm), and stored at 4°C. The specific activity of the tracer was estimated using a previously described method. 4 Stability of the tracer at various storage conditions was determined over a 45-day period 1 : aliquots of tracer were stored at +4°C or −20°C at 2 radiochemical concentrations (approximately 0.2 and 3.5 mCi/l) in polypropylene g containers, and at +4°C and approximately 0.2 mCi/l in a non-inert glass bottle.
Polyclonal antibody production
Polyclonal antibodies against cα1-PI were raised in New Zealand White rabbits (Oryctolagus cuniculus) by repeated inoculation with pure cα1-PI that was emulsified in complete and incomplete Freund adjuvant. 19 To assess the serum antibody titer, a blood sample was collected from each rabbit 10 days after each inoculation. A simplified RIA was used to evaluate anti–cα1-PI antisera in serial dilutions to obtain a B0/TC of approximately 50% 2 and a low NSB (<5%). For the RIA, antiserum from the rabbit with the highest antibody titer at a B0/TC of approximately 50% was used at a final dilution of 1:24,000. This antiserum had been collected after the third booster injection.
Radioimmunoassay development
The RIA was conducted at room temperature (approximately 23°C) in polypropylene tubes. Each tube received 100 µl of cα1-PI standard (100.0, 50.0, 20.0, 10.0, 5.0, 2.0, and 1.0 µg/l; prepared from concentrated cα1-PI in PBS) or fecal extract (diluted 1:200 in RIAB), 100 µl of antiserum (diluted 1:8,000 in RIAB), and 100 µl of cα1-PI tracer (approximately 40,000 cpm). For the zero standard (B0), cα1-PI standard was replaced by RIAB, while the NSB tubes received 200 µl of RIAB and 100 µl of radio-labeled cα1-PI, and the total count (TC) tubes only contained 100 µl of tracer. TC, NSB, and B0 were prepared in quadruplicates as these values were used to transform the response; standards and fecal samples were assayed in duplicates. After an incubation of 4 hr, free and bound fractions in all tubes (except TC) were separated by centrifugation for 30 min at 3,360 × g and 10°C after 100 µl of normal rabbit serum h (diluted 1:100 in RIAB) and 1 ml of secondary antibody solution i were added. The supernatants were carefully decanted, and the radioactivity of the remaining pellets and TC were measured for 60 sec using an automated γ-counter k (82% counting efficiency). A quartic polynomial curve fit (y = f[x] = a + b × x + c × x2 + d × x3 + e × x4) was used with log transformed concentrations of cα1-PI standard solutions on the x-axis and y-values calculated as [y = (Bstandard/B0) × 100]. 12 Bstandard represents the NSB-subtracted cpm for each standard, and B0 is the NSB-subtracted cpm obtained for the zero standard. Results obtained from samples were plotted against the standard curve to determine cα1-PI concentrations (in µg/g feces). Aliquots of diluted fecal extracts with low, moderate, and high cα1-PI concentrations were stored frozen at −80°C, and were analyzed in each RIA serving as quality control samples to detect shifts in the assay.
Radioimmunoassay analytical validation
The RIA was analytically validated by determination of analytical sensitivity, working range, linearity, accuracy, precision, and reproducibility by evaluating the minimum and maximum concentration detectable by the assay, dilutional parallelism, spiking recovery, and intra- and interassay variability. Analytical sensitivity (lower limit of detection) was determined by analyzing 20 duplicates of B0 in the same assay, calculating the mean and standard deviation (SD) of precipitate counts at zero cα1-PI concentration, and finding the cα1-PI concentration that corresponds to the mean minus 3 SD transposed onto the standard curve. 17 The upper limit of the working range was determined by evaluating 20 duplicates of a sample containing 100 µg of cα1-PI/l in the same assay, calculating the mean and SD of precipitate counts at 100 µg/l, and finding the cα1-PI concentration that corresponds to the mean count plus 3 SD transposed onto the standard curve. To determine linearity, accuracy, precision, and reproducibility of the RIA, samples with various cα1-PI concentrations that spanned the working range of the assay were used. Assay linearity was determined using 9 different fecal extracts: 6 samples were evaluated at dilutions of 1:125, 1:250, 1:500, 1:1,000 and 1:2,000, while 3 samples with higher cα1-PI concentrations were evaluated at dilutions of 1:1,000, 1:2,000, 1:4,000, and 1:8,000. Assay accuracy was tested by spiking 6 different fecal extracts with known cα1-PI concentrations (0, 1.0, 2.5, 5.0, 10.0, and 25.0 µg/g). Standard recovery was calculated as [observed value (µg/g)/expected value (µg/g)] × 100%. Precision of the assay was evaluated by assaying 6 different fecal extracts from dogs 10 times within the same assay followed by calculating the intra-assay coefficients of variation (CV = [SD/mean] × 100%). Reproducibility of the RIA was determined by analyzing 6 different fecal extracts from dogs in 10 consecutive assays and calculating interassay CV.
Reference interval for fecal cα1-PI
Fecal cα1-PI concentrations were quantified in fecal samples obtained from 73 healthy pet dogs (>1 year of age), and the reference interval was established by calculating the central 95th percentiles 6 of both the mean and the maximum Fcα1-PI in fecal samples from 3 consecutive days (Steiner JM, et al.: 2003, Intra-individual variability of fecal α1-proteinase inhibitor concentration). Intra-individual variation of Fcα1-PI concentrations over time was evaluated in each dog by calculating the mean fecal concentration of cα1-PI and within-subject variation (i.e., CV) for 3 consecutive sampling days. Fecal cα1-PI concentrations were also determined in samples collected from 28 healthy pet dogs <1 year of age. Mean and maximum Fcα1-PI concentrations in fecal samples from 3 consecutive days were compared between healthy male and female dogs >1 year of age and between dogs of different age groups (dogs <1 year and >1 year of age; and dogs <6 months, 6–12 months, 1–3 years, 3–5 years, and >5 years). Normality was tested using a Shapiro–Wilk W test, and if necessary, data was loge transformed to obtain parametric data. A Bartlett test was used to test equality of variances. A t-test was utilized to compare mean and maximum Fcα1-PI concentrations in fecal samples from 3 consecutive days between the 2 gender groups and between dogs <1 year and dogs >1 year of age. A one-way analysis of variance followed by a Tukey–Kramer HSD (Honestly Significant Difference) post-hoc test was used to compare 3-day mean and maximum Fcα1-PI concentrations among the different age groups. Statistical analyses were performed using a statistical software program, l and statistical significance was set at P < 0.05.
Agreement to the cα1-PI ELISA
To evaluate the agreement between results obtained by the newly developed cα1-PI RIA and those obtained from the previously developed cα1-PI ELISA, 10 166 previously analyzed canine fecal samples that spanned the working range of the assay were re-tested on the RIA. For the cα1-PI RIA, samples were tested across 5 different assays run on different days, whereas the cα1-PI ELISA samples had been analyzed across 9 different plates. Canine α1-PI concentrations obtained in the RIA were plotted against those determined using the ELISA, and a Spearman correlation coefficient ρ was calculated followed by a Passing–Bablok regression. m,15 Fecal samples with cα1-PI concentrations above the minimum detection limits of both assays (n = 150) were subsequently analyzed to assess any bias observed between the 2 assay methods. 3 The same approach was used to evaluate repeatability of the cα1-PI RIA by re-testing 30 canine fecal samples using the same tracer, and by repeated analysis of 27 fecal samples and 2 different tracers. Normality of the differences was evaluated using a Shapiro–Wilk W test. To establish the validity of the newly developed cα1-PI RIA a kappa statistic was used as a measure of diagnostic agreement between both methods. A quadratic weighted kappa coefficient to determine the degree of agreement between both methods on a 3-point ordinal scale was calculated 5,16 using the mean and maximum cα1-PI concentrations obtained for 3 consecutive fecal samples from 54 dogs. The decision limits used for the cα1-PI ELISA were Fcα1-PI concentrations of 9.4 and 15.0 µg/g (Steiner JM, et al.: 2003, Intra-individual variability of fecal α1-proteinase inhibitor concentration) up to which Fcα1-PI is considered normal, and 12.5 and 20.0 µg/g (mildly increased Fcα1-PI concentration), respectively. For the cα1-PI RIA, the 97.5th percentiles calculated (13.9 and 21.0 µg/g, respectively) and Fcα1-PI concentrations of 18.0 and 25.0 µg/g, respectively (mildly increased Fcα1-PI), were used as cut-off values. Interpretation of the weighted kappa coefficient was based on a previously published guideline. 9
Results
Radioimmunoassay development and validation
Immunization of the New Zealand White rabbits with pure cα1-PI using a standard vaccination protocol yielded a high anti–cα1-PI antibody titer with the antiserum in excess (1:500 dilution) binding slightly more than 85% of the cα1-PI tracer. The specific activity of the tracer ranged from 8,270 to 11,358 Ci/mmol (mean: 9,549 Ci/mmol; determined for 4 different tracers). Repeated B0/TC determination revealed the least stability of cα1-PI tracer when stored undiluted at +4°C or −20°C, whereas an improved stability was observed when the tracer was stored diluted at +4°C or −20°C regardless of the storage container used. Thus, the following conditions for tracer storage were used for the remainder of the experiments: +4°C, (non-inert) glass container, and approximate radioactivity of 0.2 mCi/l. Under these conditions, radio-labeled cα1-PI yielded a good sensitivity of the RIA up to 25 days with no effect on NSB, allowing for use of the tracer for approximately 3 weeks without refractionation.
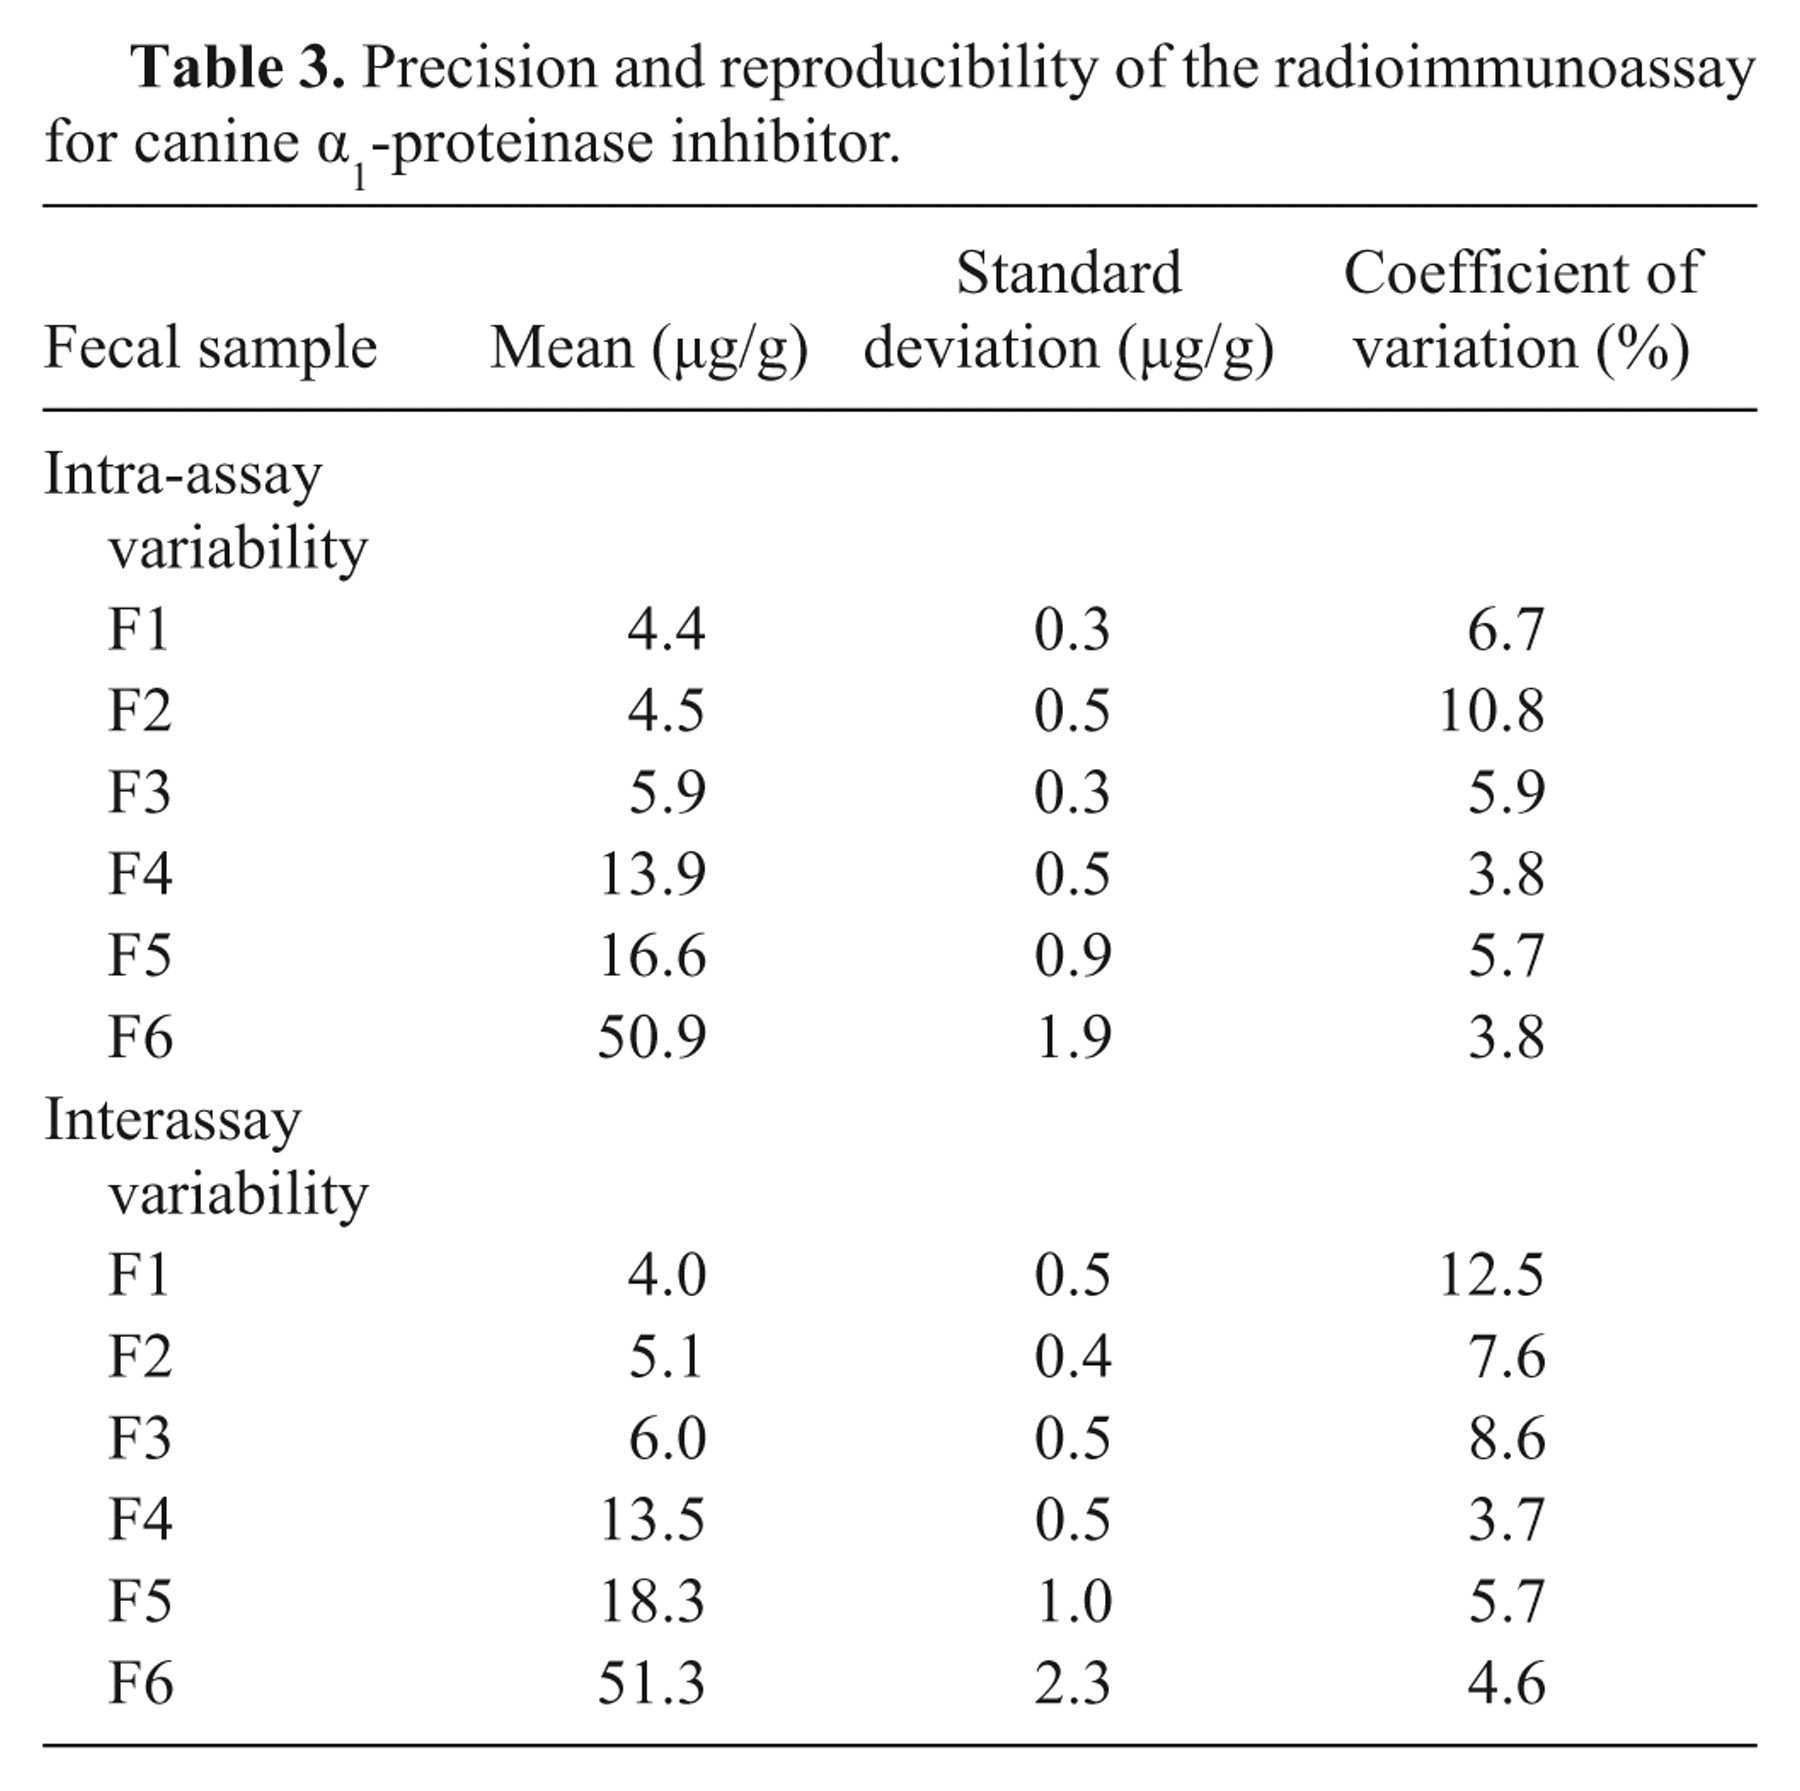
The standard curve (Fig. 2) yielded a working range between 2.2 and 79.1 µg/l. As samples were diluted 1:1,000 before quantitation, analytical sensitivity and maximum detection limit of the RIA for fecal samples were 2.2 and 79.1 µg/g, respectively. Serial dilution of fecal samples covering a wide range of cα1-PI concentrations yielded dose-response curves that paralleled the standard curve (Table 1). Expected and observed concentrations for spiking recovery of the assay were closely correlated (Table 2). Precision testing of the RIA resulted in intra-assay CVs that were less than 6.7% for most samples (n = 5), except for one extract with an intra-assay CV of 10.8%. Reproducibility testing of the RIA showed interassay CVs that were less than 8.6% for 5 of the samples tested and 12.5% for the remaining fecal extract (Table 3). Aliquots of cα1-PI standard dilutions were stored at −80°C, and no change in the standard curve was seen after 10 months.
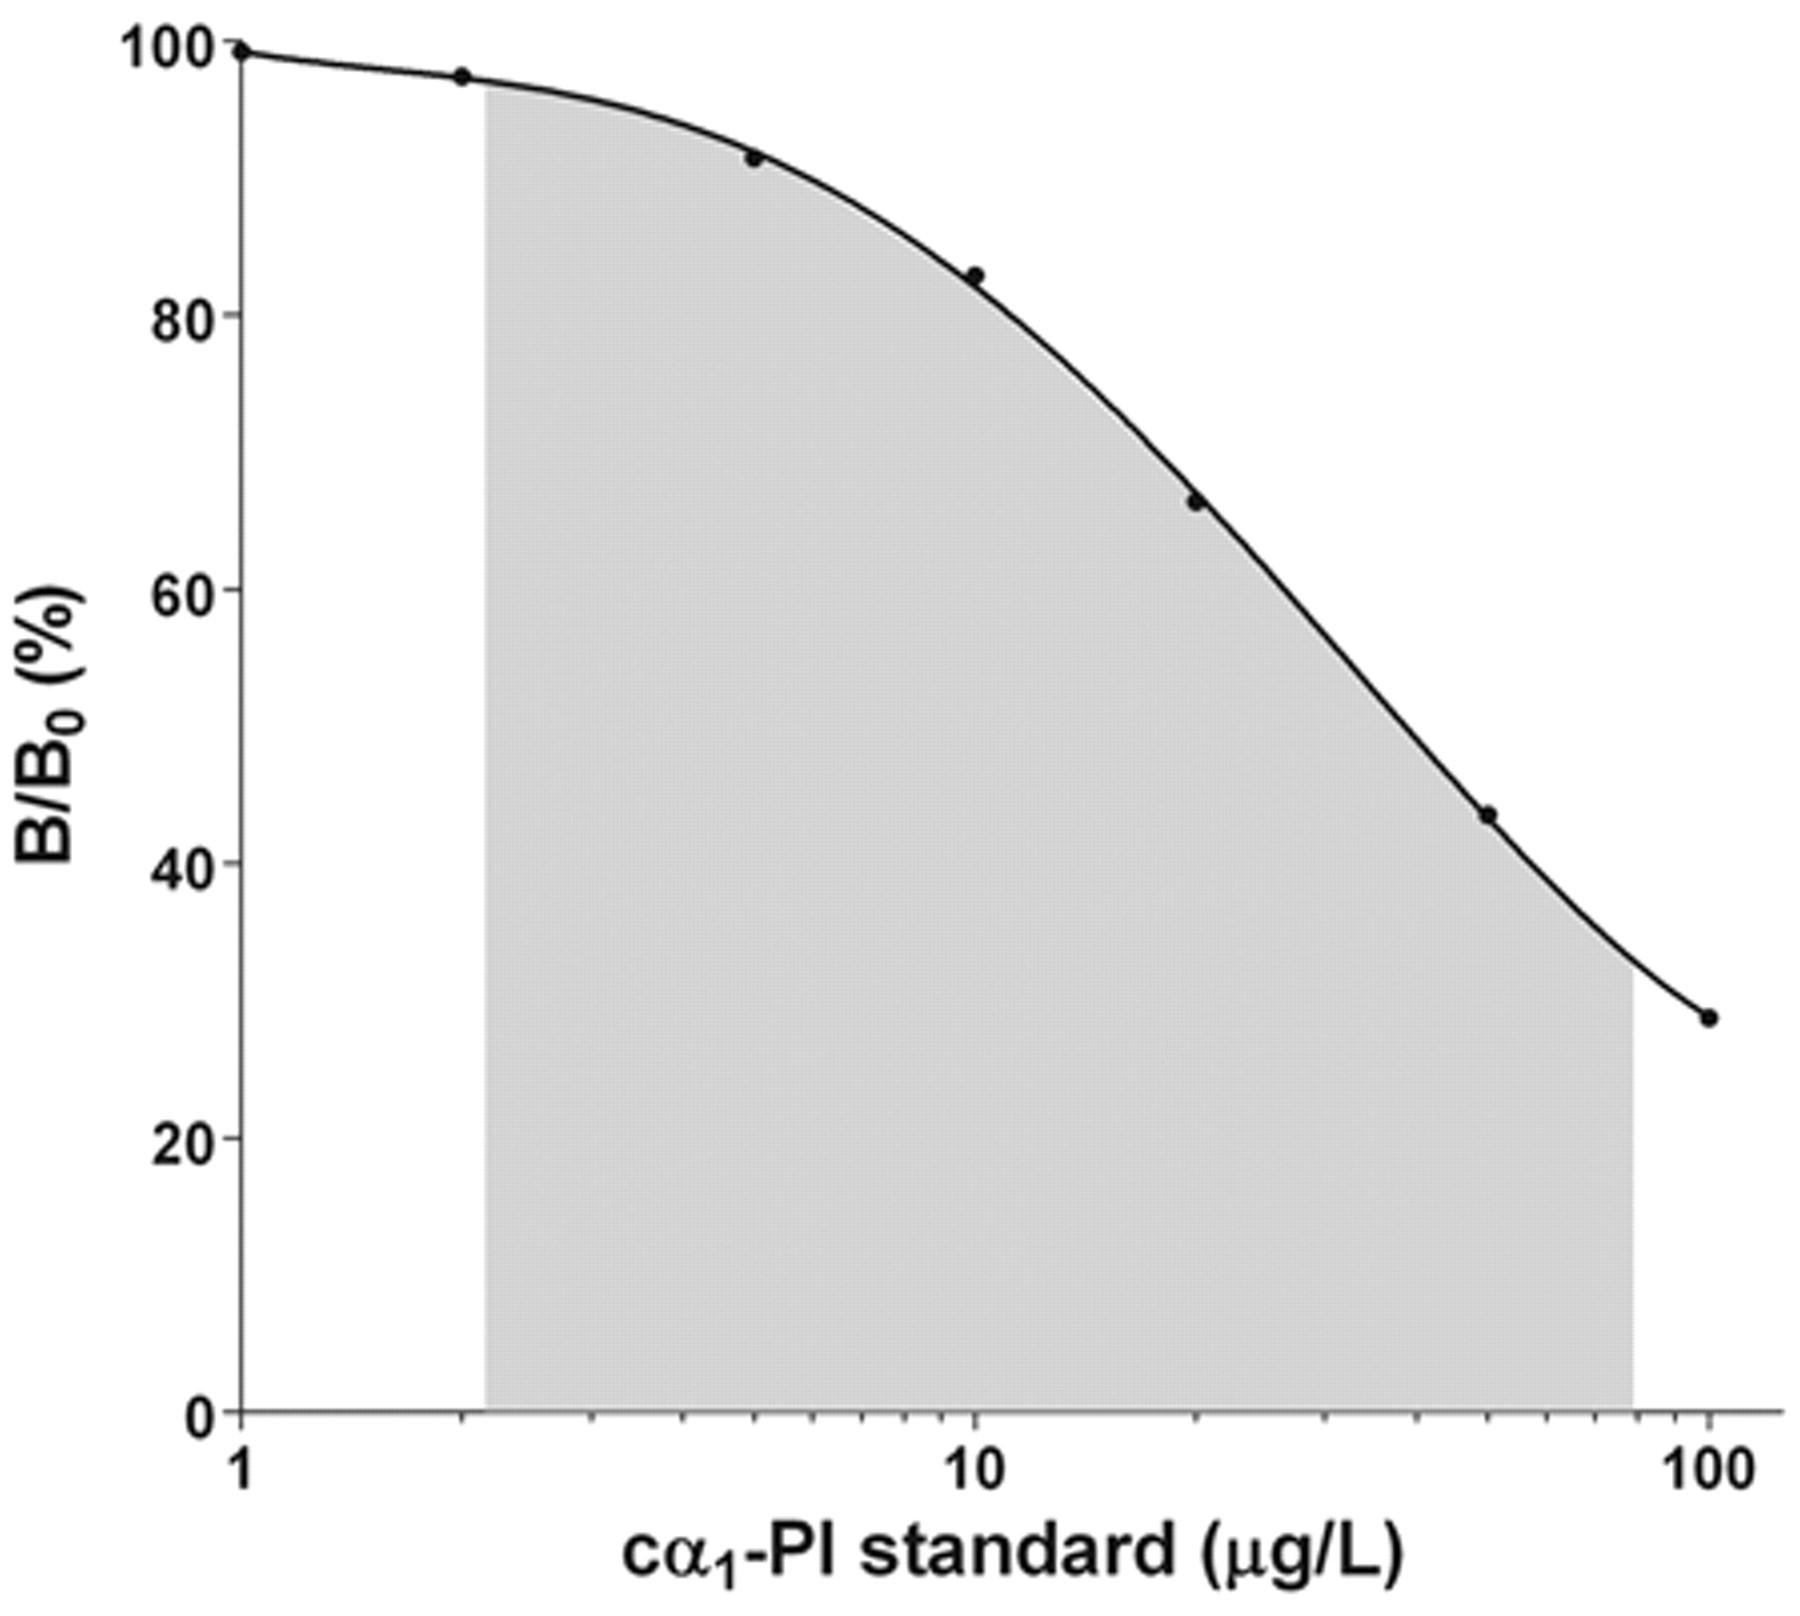
Representative calibration plot for the estimation of canine α1-proteinase inhibitor (cα1-PI) by a competitive, double antibody radioimmunoassay. The gray shaded portion of the curve was used to quantify cα1-PI in fecal extracts from dogs.
Results for dilutional parallelism of fecal extracts for the canine α1-proteinase inhibitor (PI) radioimmunoassay.*
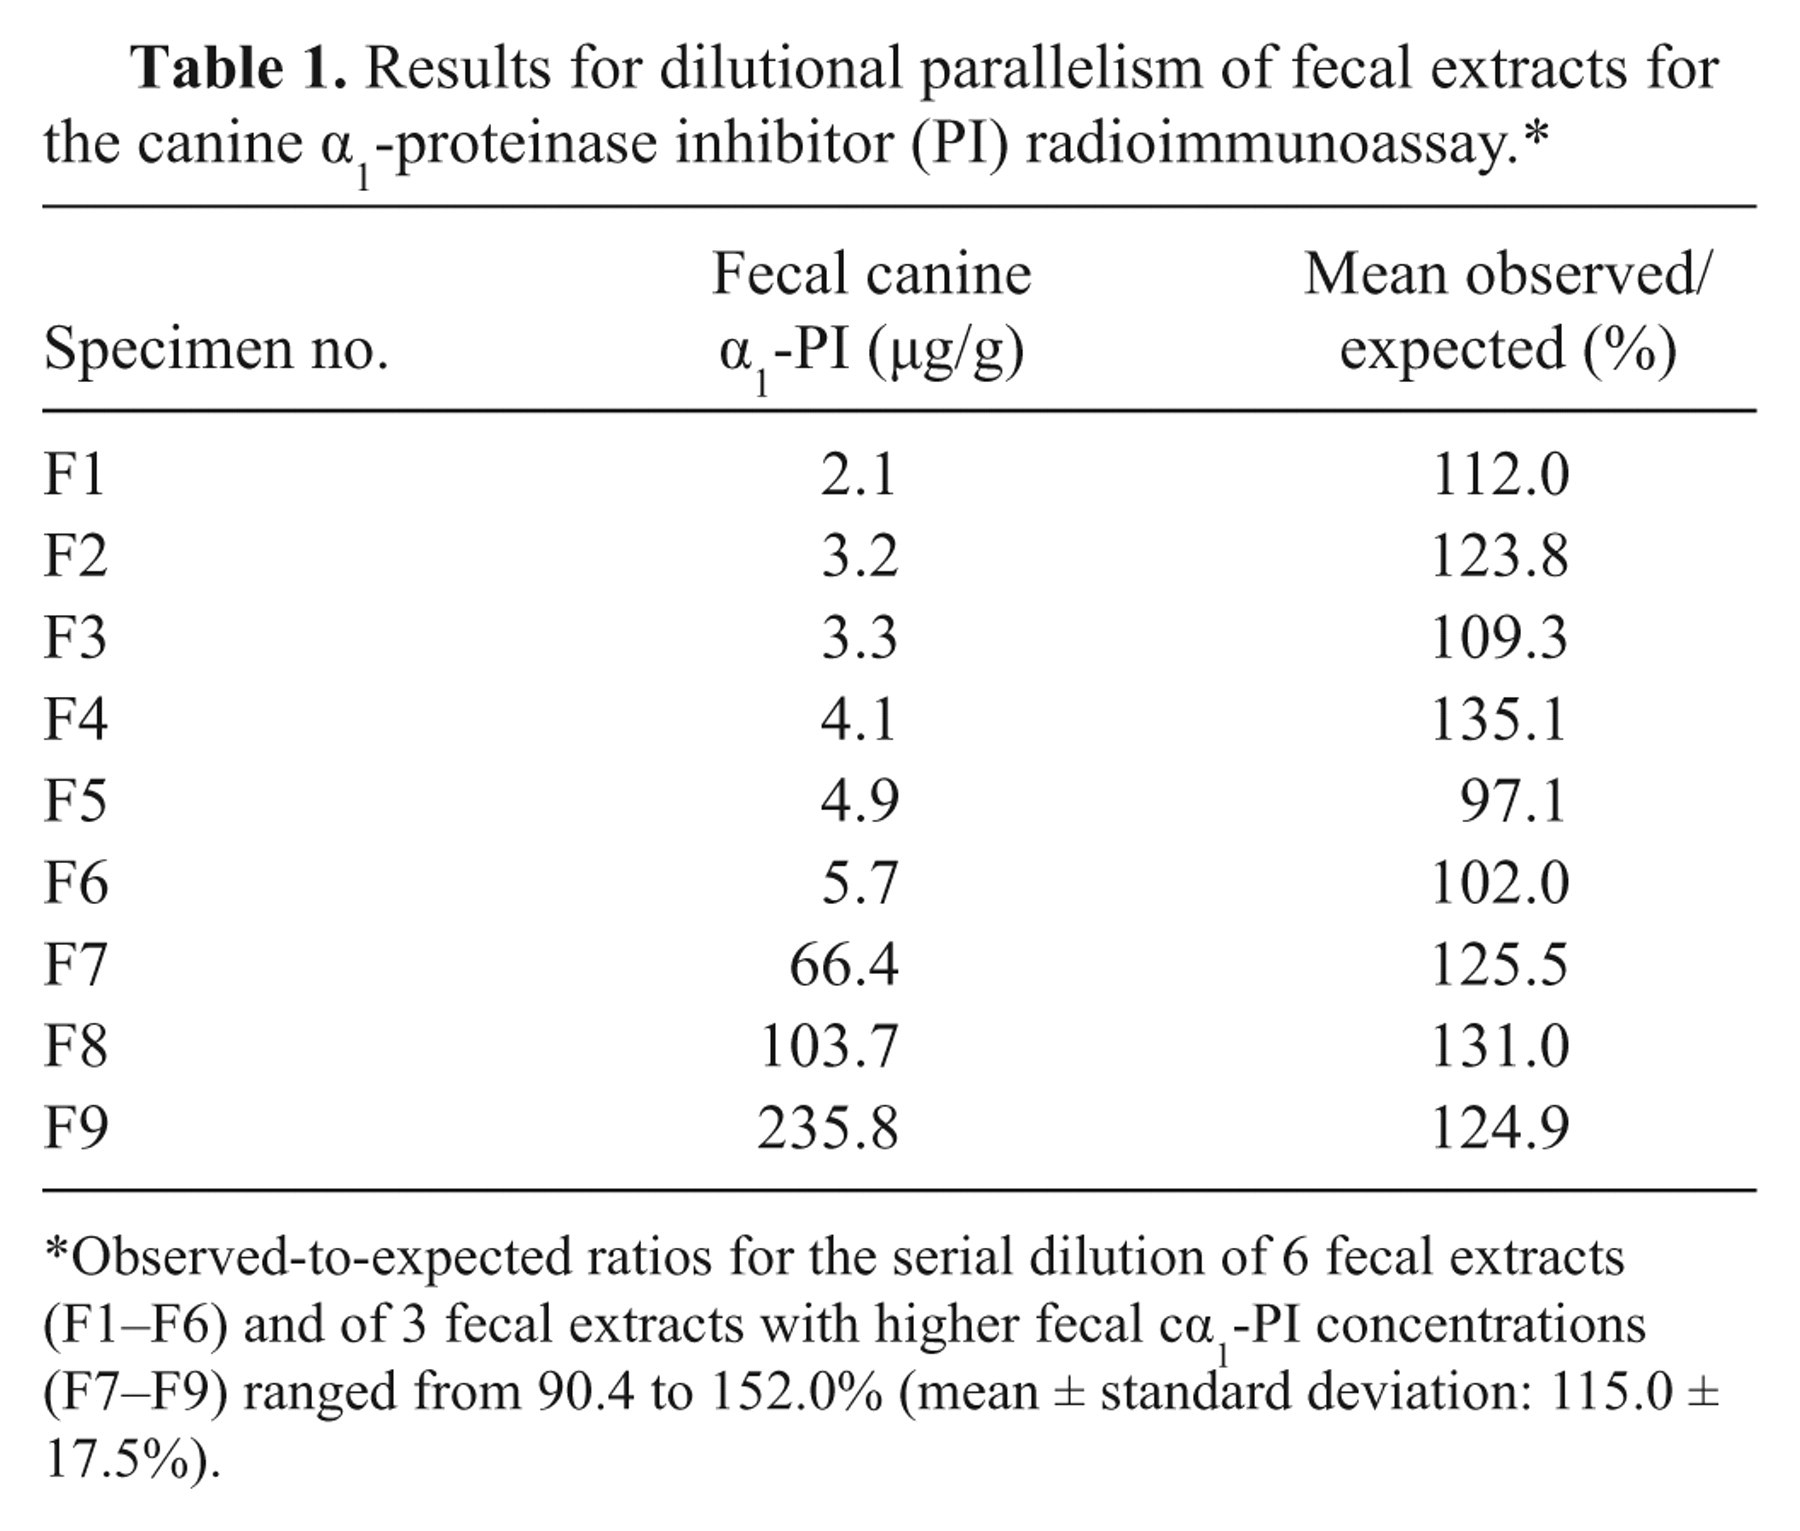
Observed-to-expected ratios for the serial dilution of 6 fecal extracts (F1–F6) and of 3 fecal extracts with higher fecal cα1-PI concentrations (F7–F9) ranged from 90.4 to 152.0% (mean ± standard deviation: 115.0 ± 17.5%).
Results for spiking recovery of canine α1-proteinase inhibitor (PI) as determined by the newly developed radioimmunoassay.*
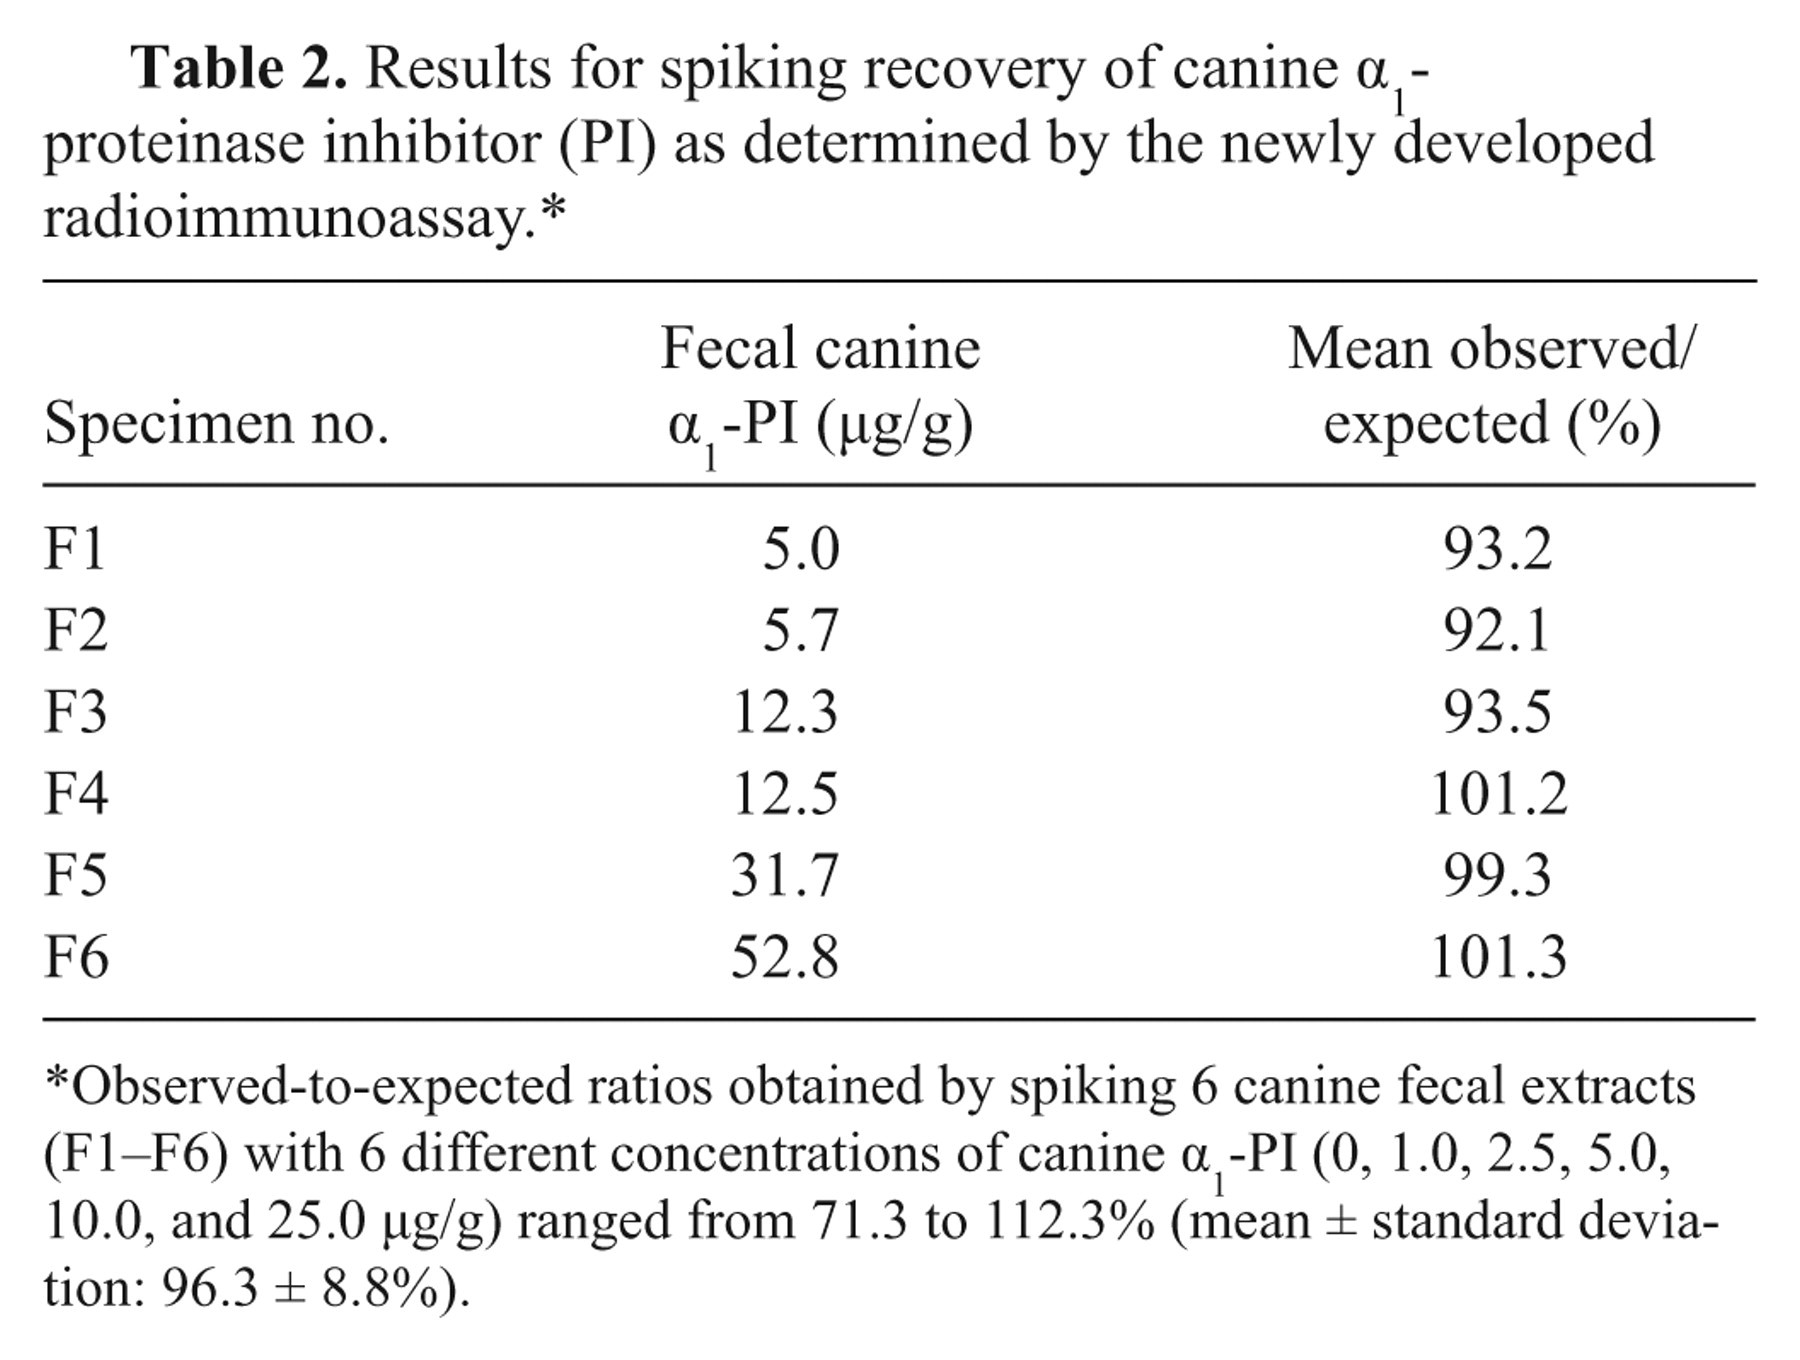
Observed-to-expected ratios obtained by spiking 6 canine fecal extracts (F1–F6) with 6 different concentrations of canine α1-PI (0, 1.0, 2.5, 5.0, 10.0, and 25.0 µg/g) ranged from 71.3 to 112.3% (mean ± standard deviation: 96.3 ± 8.8%).
Precision and reproducibility of the radioimmunoassay for canine α1-proteinase inhibitor.
Reference interval
Fecal cα1-PI concentrations in individual samples from 73 adult healthy pet dogs above 1 year of age ranged from <2.2 to 26.8 µg/g (median: 4.7 µg/g) with a 3-day sample mean Fcα1-PI concentration ranging from <2.2 to 21.1 µg/g (median: 4.9 µg/g) and a maximum Fcα1-PI concentration of fecal samples collected on 3 consecutive days ranging from <2.2 to 26.8 µg/g (median: 6.6 µg/g). For Fcα1-PI concentrations in samples obtained during the 3-day collection period, the CV ranged from 0.0% to 102.0% (median: 29.2%). Regression analysis revealed a linear relationship between the %CV and the 3-day mean and maximum Fcα1-PI concentration in fecal samples (P < 0.0001; R2 = 0.818). The reference interval for Fcα1-PI concentration was established as a 3-day mean of <2.2 to 13.9 µg/g and a 3-day maximum Fcα1-PI of <2.2 to 21.0 µg/g (Fig. 3). Mean and maximum Fcα1-PI concentrations of 3 consecutive sampling days were not significantly different between healthy male and female dogs >1 year of age (P = 0.196 and 0.229, respectively). The 3-day mean Fcα1-PI (median: 8.9 µg/g, range: 2.4–50.9 µg/g) and the maximum Fcα1-PI for 3 consecutive sampling days in dogs <1 year of age (median: 12.4 µg/g, range: 2.5–79.1 µg/g) were significantly higher than in dogs >1 year of age (P < 0.0001). In dogs <6 months old, significantly higher mean (median: 12.7 µg/g, range: 4.3–50.9 µg/g) and maximum Fcα1-PI concentrations (median: 18.4 µg/g, range: 6.0–79.1 µg/g) for the 3 consecutive days were detected compared to dogs 1–3 years (median: 4.8 µg/g [P = 0.0002] and 7.1 µg/g [P = 0.0003], respectively), 3–5 years (median: 4.9 µg/g [P = 0.0002] and 6.3 µg/g [P < 0.0001], respectively), and to dogs >5 years of age (median: 5.0 µg/g [P = 0.0007] and 7.0 µg/g [P = 0.0006], respectively; Fig. 4). Three-day sample mean and maximum Fcα1-PI were not significantly different between dogs <6 months and those 6–12 months of age (median: 6.8 µg/g [range: 2.4–20.5 µg/g] and 12.4 µg/g [range: 2.5–28.0 µg/g], respectively; P = 0.285 and 0.253, respectively), or between any other 2 age groups. In 2 dogs (14 and 19 weeks of age), re-measurement of Fcα1-PI at 48 and 51 weeks revealed a decrease in mean (from 17.8 µg/g to 4.3 µg/g and from 22.4 µg/g to 5.3 µg/g, respectively) and maximum Fcα1-PI concentration (from 25.5 µg/g to 6.2 µg/g and from 35.9 µg/g to 6.6 µg/g, respectively). However, statistical analysis could not be performed due to the small number of dogs (n = 2) from which repeated samples were available.
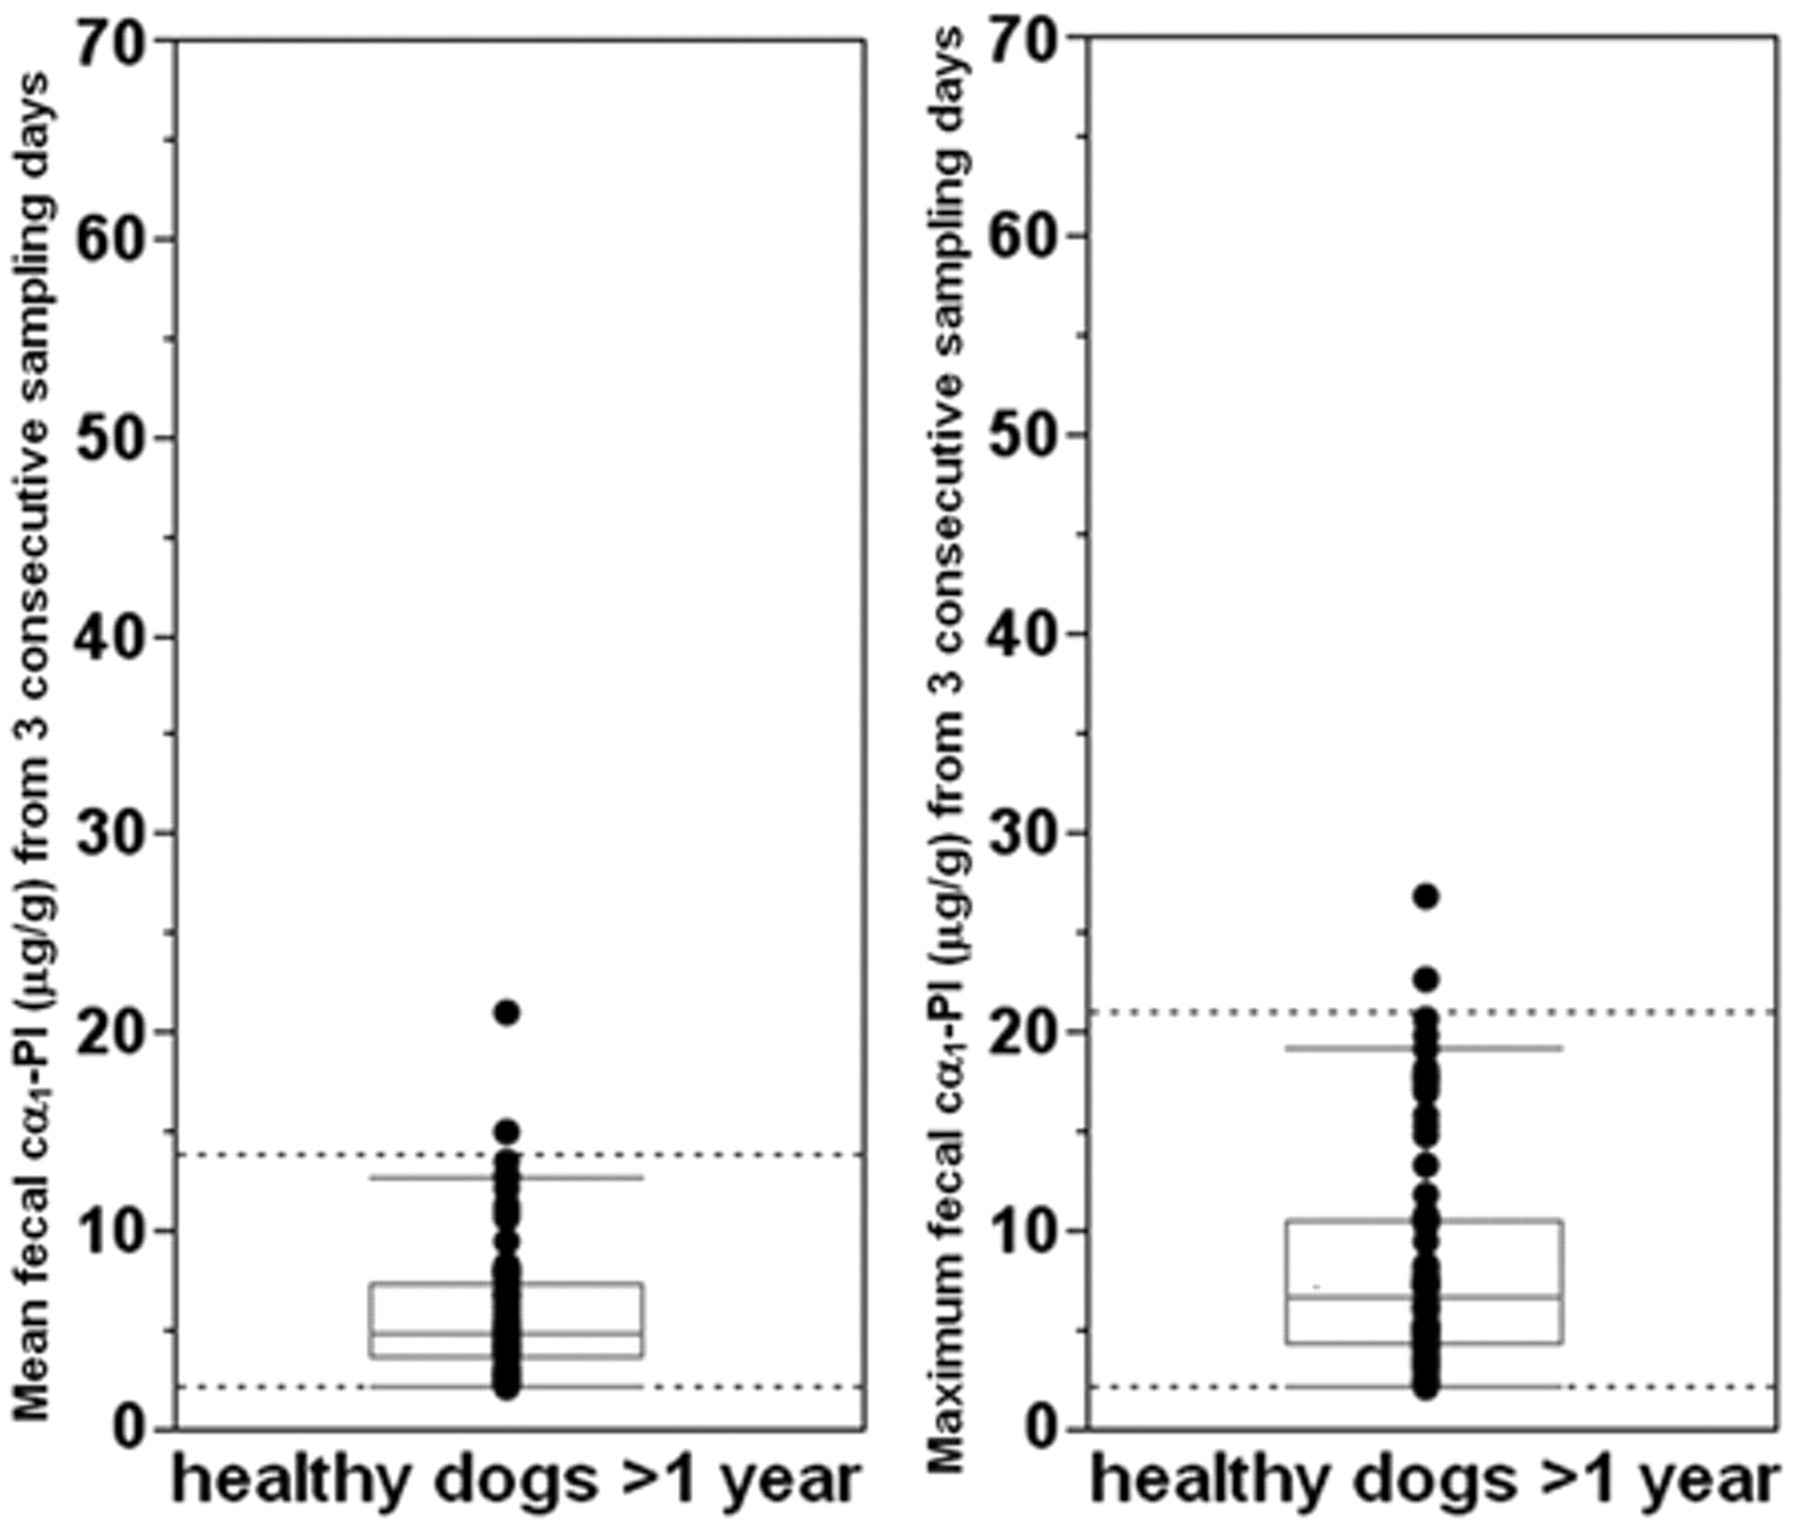
Vertical bubble plots and box plots of the mean and the maximum fecal canine α1-proteinase inhibitor (cα1-PI) concentrations determined in fecal specimens from 73 healthy adult pet dogs. Each symbol represents the concentration for a specific dog. Reference intervals (dashed horizontal lines) were determined to be <2.2–13.9 µg/g (median: 4.9 µg/g) for the 3-day mean and <2.2–21.0 µg/g (median: 6.6 µg/g) for the maximum cα1-PI concentration in fecal samples from 3 consecutive days.
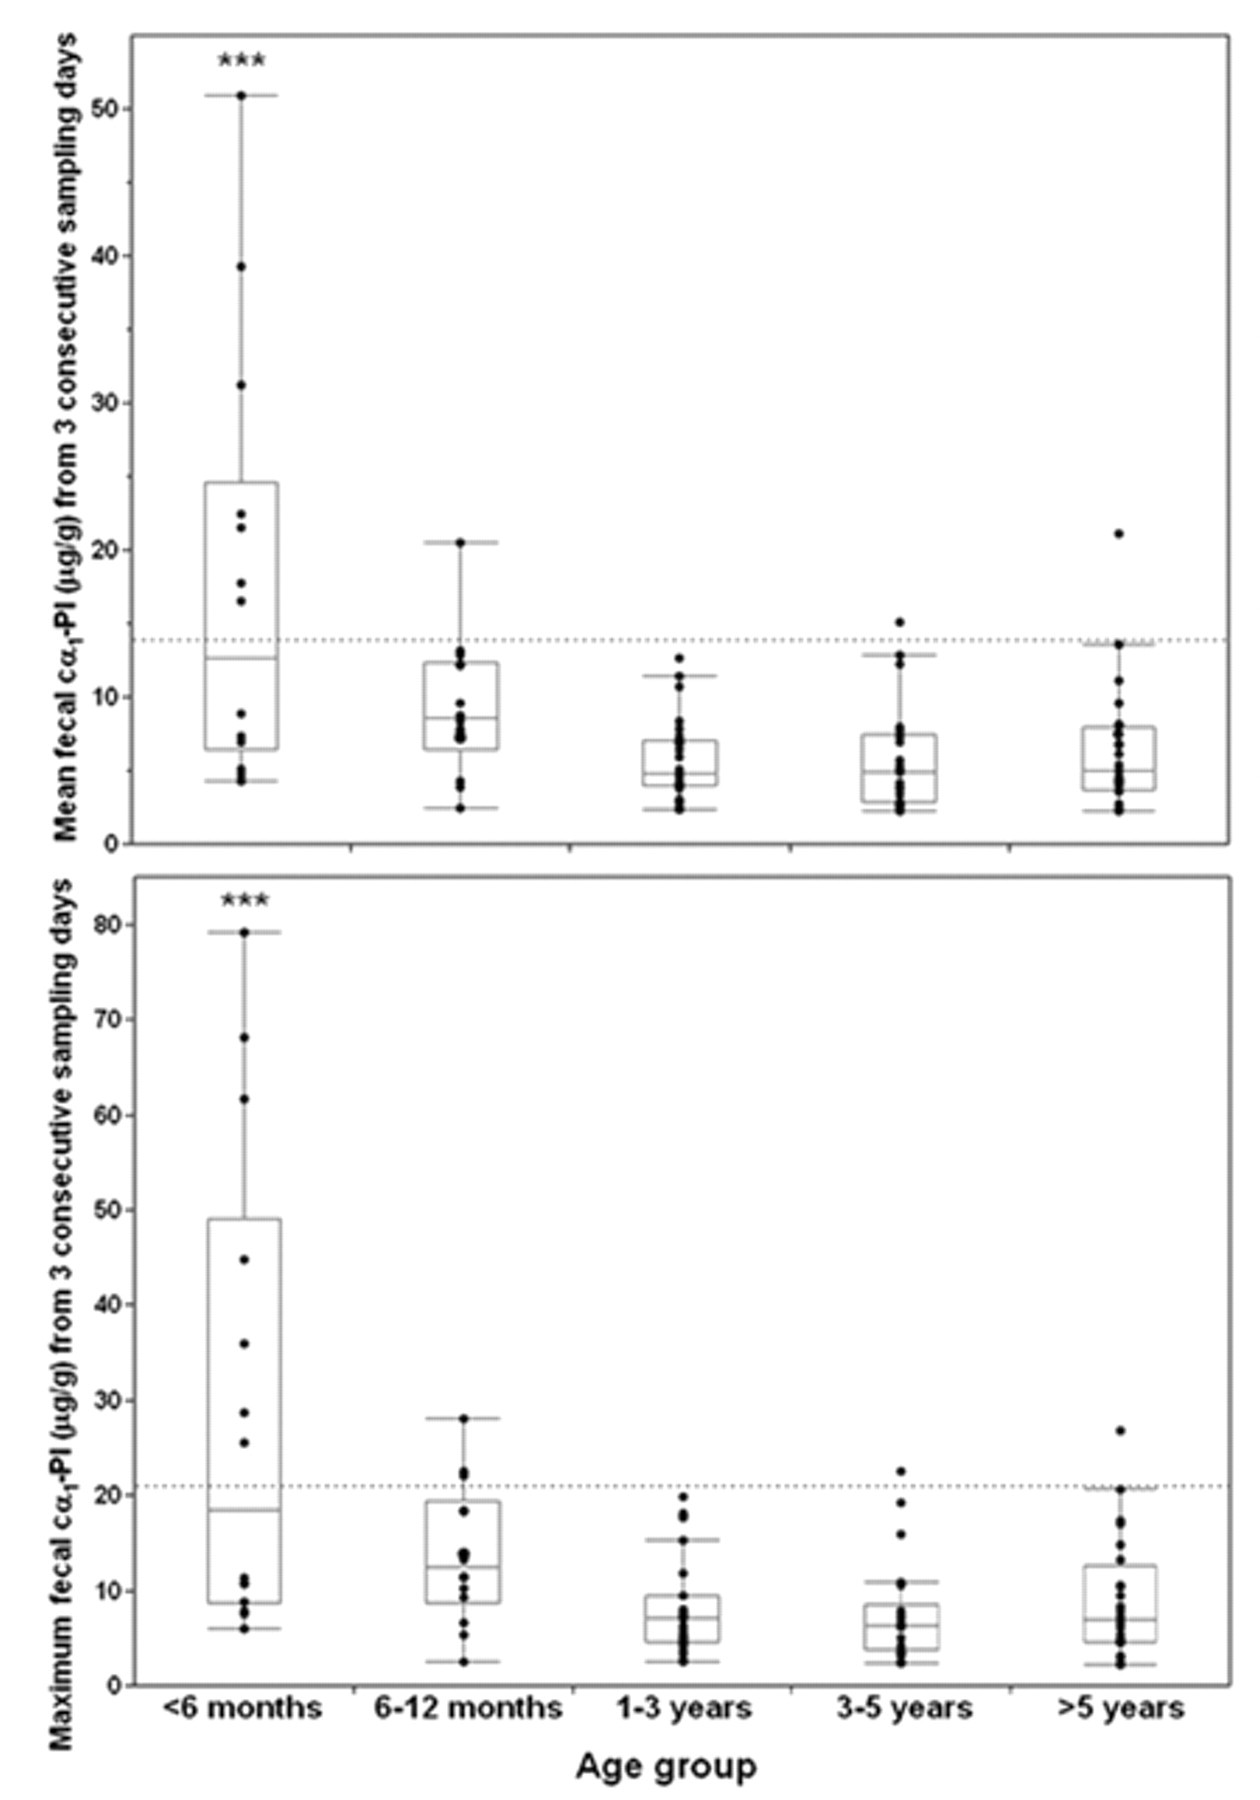
Fecal canine α1-proteinase inhibitor (cα1-PI) concentrations in dogs of different age groups. Each symbol represents the concentration for a specific dog, and the box plots show median and central 50th percentiles. The respective upper limits of the reference interval are indicated by dashed lines.
Agreement with the cα1-PI ELISA
The concentrations of Fcα1-PI measured in 166 samples by use of the RIA were plotted against Fcα1-PI concentrations that were obtained using the ELISA (Fig. 5), and were highly correlated as indicated by a Spearman ρ of 0.867 (P < 0.0001). A linear relationship was confirmed for results obtained by ELISA and RIA (Cusum linearity test P > 0.1), and a Passing–Bablok test identified a constant (α = 1.86; 95% CI: 1.82–2.52) and a proportional bias (β = 0.67; 95% CI: 0.58–0.76) between the 2 methods. For 150 canine fecal samples with cα1-PI concentrations above the minimum detection limits of both assays, the difference between both methods was plotted against their mean (Bland–Altman plot; Fig. 6) following a common log transformation as the differences were shown to be related to the mean (P < 0.0001). Repeatability testing of the cα1-PI RIA revealed a mean difference (bias), a lower and upper 95% limit of agreement, and a repeatability coefficient of −0.059, −0.136, 0.048, and 0.122, respectively, on the log scale when the same tracer was used, and of −0.044, −0.194, 0.106, and 0.174 (log scale), respectively, when using 2 different tracers. The data were log transformed as the differences were related to the mean (P = 0.0002 and P < 0.0001).
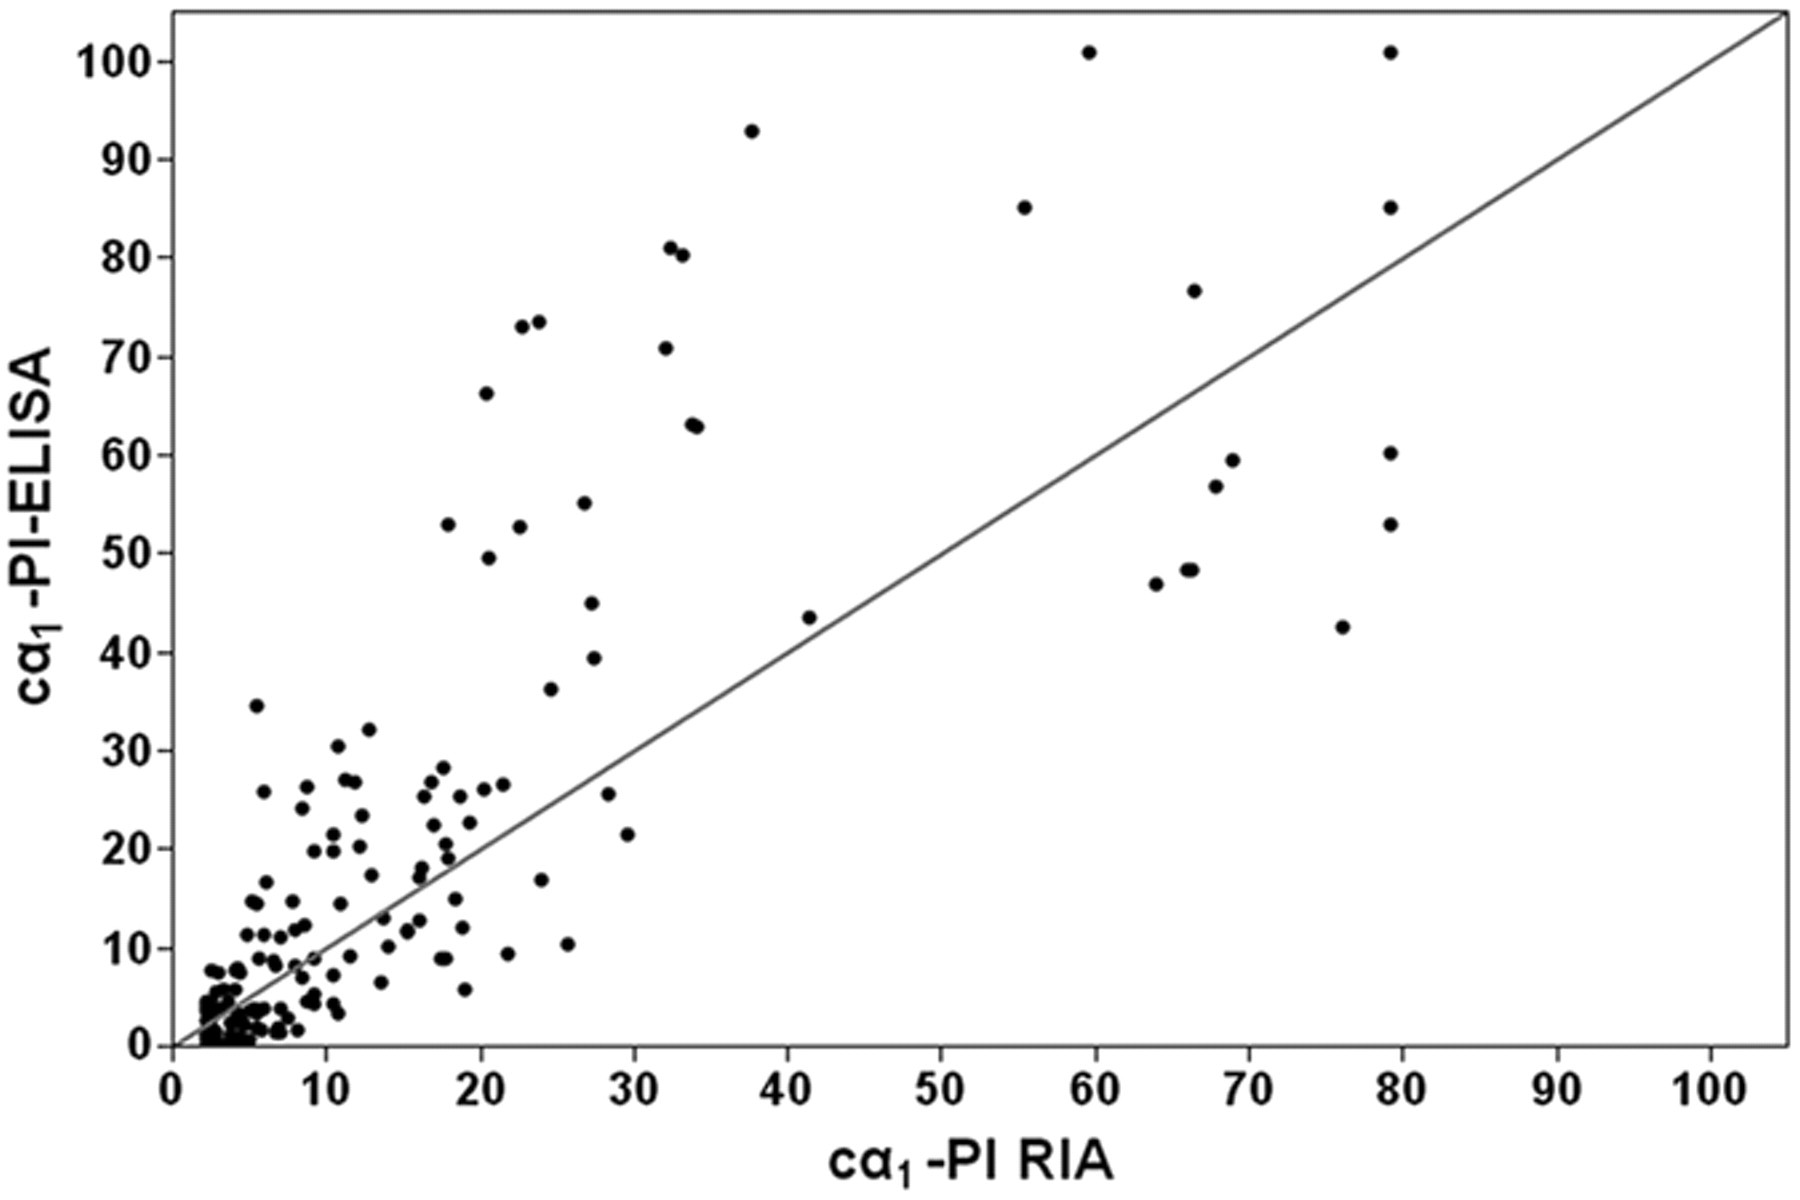
Canine α1-proteinase inhibitor (cα1-PI) concentrations measured in 166 fecal samples from dogs using the new cα1-PI radioimmunoassay (RIA) and the cα1-PI enzyme-linked immunosorbent assay (ELISA). Both were highly correlated (Spearman ρ = 0.867, P < 0.0001), but both a constant and proportional bias existed with lower concentrations for the cα1-PI RIA relative to the cα1-PI ELISA. A line of equality (45° line) was included in the plot.
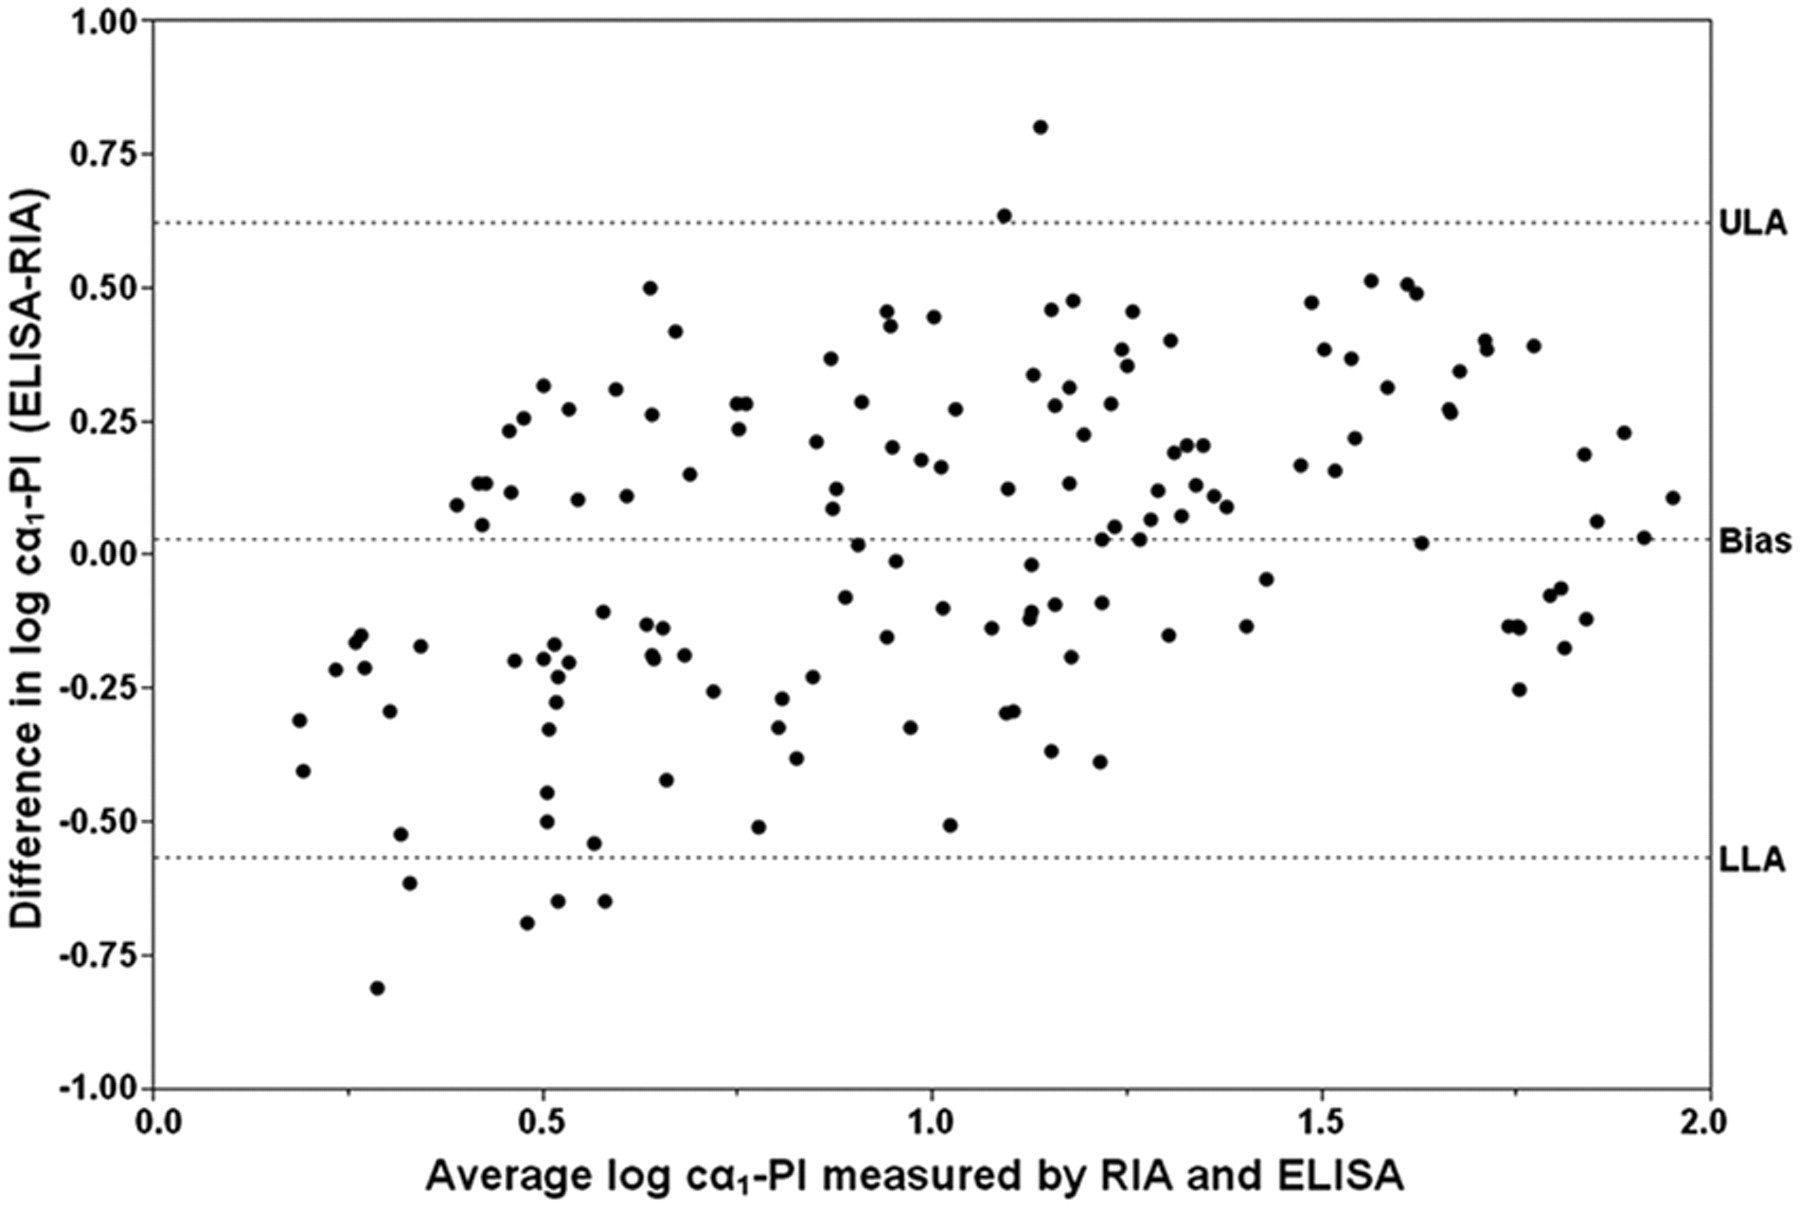
Bland–Altman plot. Each symbol represents the difference between both methods against their mean for a specific fecal sample (n = 150). The mean difference (bias) and the lower (LLA) and upper (ULA) limit of agreement (dashed horizontal lines) were calculated as 0.028 (95% confidence interval [CI]: −0.021 to 0.077), −0.566 (95% CI: −0.651 to −0.482), and 0.622 (95% CI: 0.538 to 0.707) on the log scale.
To evaluate clinical agreement between both assays (the cα1-PI RIA and the cα1-PI ELISA), a quadratic weighted kappa coefficient (κ w ) was calculated as 0.68 (95% CI: 0.51–0.86) for cα1-PI concentrations measured in 3 consecutive fecal samples from 54 dogs (Table 4). For a decision based on the 3-day maximum or the 3-day mean Fcα1-PI concentration, the κ w was 0.63 (95% CI: 0.44–0.82) and 0.67 (95% CI: 0.48–0.85), respectively.
Contingency table constructed for calculating the quadratic weighted kappa coefficient.*
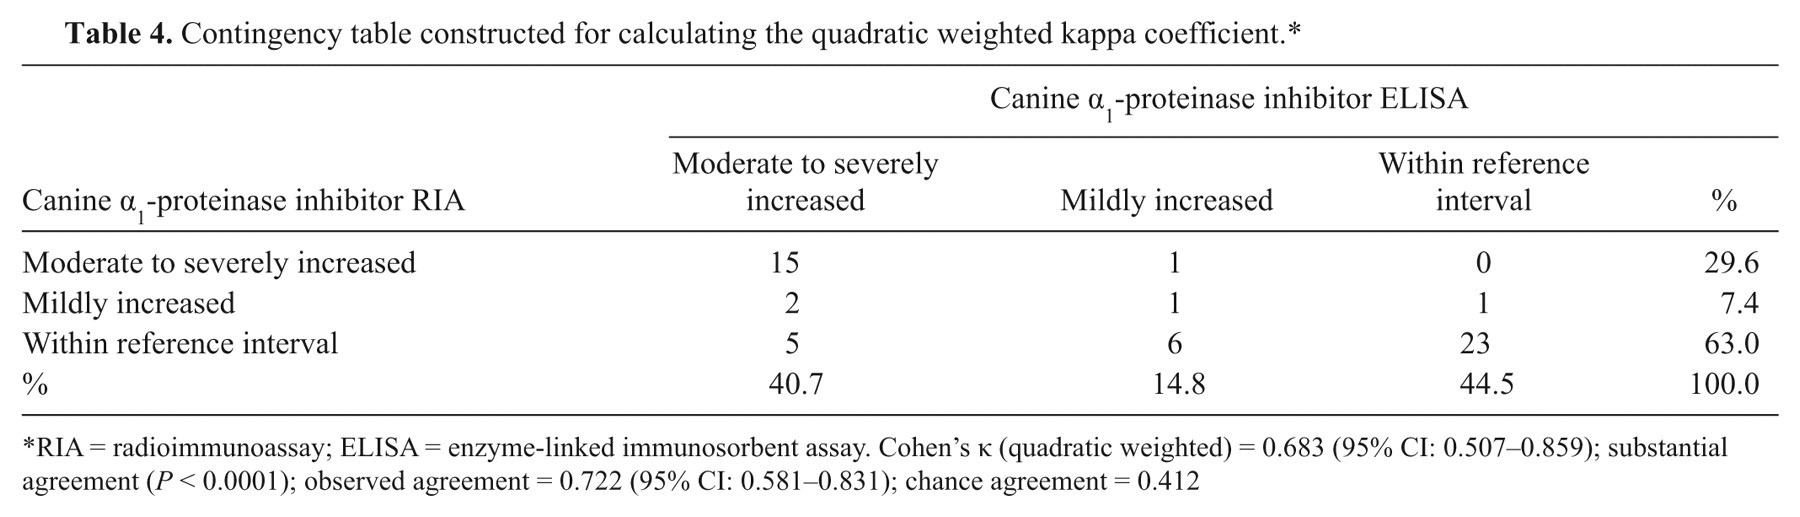
RIA = radioimmunoassay; ELISA = enzyme-linked immunosorbent assay. Cohen’s κ (quadratic weighted) = 0.683 (95% CI: 0.507–0.859); substantial agreement (P < 0.0001); observed agreement = 0.722 (95% CI: 0.581–0.831); chance agreement = 0.412
Discussion
A radioimmunoassay for the measurement of cα1-PI in fecal extracts from dogs that is suitable for analysis of a large number of samples was successfully established. This assay allows the use of a previously established protocol for the extraction of fecal samples of approximately 1.0 g wet weight. 10 The availability of an antiserum with a high titer of anti–cα1-PI antibodies allows for its use in a high dilution, thus saving material, which is especially important considering the need for long-term use and stability of the assay system.
Analytical sensitivity of the assay was calculated to be 2.2 µg/g feces, which appears to be adequate considering the fact that dogs with protein-losing gastroenteropathies would be expected to show increased Fcα1-PI concentrations and the upper limit of the reference interval of 13.9 µg/g for the mean of 3 samples from consecutive days and of 21.0 µg/g for the maximum of the 3 fecal extracts collected on 3 consecutive days, respectively. The standards used in the assay include the same cα1-PI concentrations that had been used to calibrate the cα1-PI ELISA, and the working range of the RIA is comparable to that reported for the cα1-PI ELISA, 10 making the data obtained comparable, thus facilitating data analysis and interpretation. Considering an upper limit of the assay working range of more than 3 times the upper limit of both reference intervals, and the purpose of the assay to identify dogs with increased Fcα1-PI concentrations, the newly developed RIA might be useful in differentiating between healthy dogs and dogs with GI protein loss. Observed-to-expected ratios for dilutional parallelism and spiking recovery for fecal extracts from dogs indicate linearity and accuracy of the RIA. Precision and reproducibility of the assay were demonstrated by the %CVs for intra- and interassay variability. Due to the unavailability of cα1-PI analogues, analytical specificity of the RIA for cα1-PI could only be demonstrated by dilutional parallelism and spiking recovery of cα1-PI in fecal samples from dogs.
Concentrations of cα1-PI in fecal extracts from individual healthy dogs vary greatly as shown by %CVs up to 102.0%, which has also been reported by other studies (Steiner JM, et al.: 2003, Intra-individual variability of fecal α1-proteinase inhibitor concentration). This could possibly be explained by a patchy excretion of cα1-PI within the GI tract. However, short episodes of insignificant GI protein loss in healthy dogs also need to be considered as a cause for variation of Fcα1-PI concentrations over time, and local production of cα1-PI by the intestinal mucosa cannot be ruled out, though the likelihood of this is small as α1-PI is synthesized in the liver. Collection of a fecal sample for each consecutive day (3) from the same patient has been suggested to counterbalance this physiological variation (Steiner JM, et al.: 2003, Intra-individual variability of fecal α1-proteinase inhibitor concentration), and was used to determine the reference intervals for the assay in the current study. Dogs were included in the reference sample group based on a noninvasive assessment of GI health. While this approach may not definitively rule out subclinical GI disease, more invasive procedures to exclude such conditions would have not been feasible.
Transference of a reference interval is acceptable in clinical chemistry, provided that stringent criteria are met, whereas the use of a different assay system requires a new reference interval to be established. 6 Thus, a de novo reference interval for the mean and maximum concentration of cα1-PI in fecal samples from 3 consecutive days was determined for the newly developed RIA using samples from a large number of healthy pet dogs, and yielded decision limits that were similar, but not identical, to those previously published for the cα1-PI ELISA (Steiner JM, et al.: 2003, Intra-individual variability of fecal α1-proteinase inhibitor concentration). It should be emphasized that, while both analytical methods yielded results that were strongly correlated (ρ = 0.867), the possibility of a significant difference between results obtained by both methods due to both constant and a proportional bias precluded the transference of the reference interval determined for the cα1-PI ELISA (Steiner JM, et al.: 2003, Intra-individual variability of fecal α1-proteinase inhibitor concentration) to the new cα1-PI RIA. 6
In the present study, significantly higher Fcα1-PI concentrations were detected in dogs <1 year of age, and especially in dogs that were <6 months old, compared to pet dogs >1 year of age, signifying the necessity to carefully interpret values in dogs <1 year of age. However, determination of a reference interval for dogs <1 year was not attempted due to the high variation in Fcα1-PI concentrations in this age group. As Fcα1-PI concentrations were not significantly different between pet dogs of different age groups, values from all healthy dogs >1 year of age were used to calculate the reference interval. An age-related difference in Fcα1-PI concentrations has also been reported in a group of Soft Coated Wheaten Terriers (Vaden SL, et al.: 2002, Fecal α1-proteinase inhibitor activity in Soft-Coated Wheaten Terriers). In contrast to the current findings, Fcα1-PI concentrations measured significantly higher in dogs at the age of 1 year compared to dogs that were 3 years old. However, in that study, Fcα1-PI concentrations in dogs <1 year of age were not reported.
Detection of significantly higher Fcα1-PI concentrations in healthy puppies, especially puppies <6 months of age, than in adult dogs would indicate a higher rate of protein clearance by the GI tract in puppies. This might be due to a higher intestinal permeability of the still “immature” GI tract at a younger age 21 and could reflect a smaller intestinal mucosal surface area with a lower number of intercellular tight junction proteins. Leakage of proteins into the GI tract would be assumed to normalize in puppies as the GI tract matures. Higher concentrations of another protein marker, canine calprotectin, in fecal samples from a small number of puppies (Heilmann RM, 2008, personal observation, unpublished data) would support this hypothesis. However, in the current study subjects, an effect of unidentified confounders such as diet or subclinical parasitic infestation of puppies cannot be conclusively ruled out.
Immunoassays measure protein analytes indirectly by immunologic binding to an antibody, which is affected by various factors, such as antibody avidity or the presence of competitors for antibody binding (e.g., radio-labeled protein). 20 Thus, immunoassays are not truly analytic, and the measurement of a protein analyte (such as cα1-PI) by 2 different immunologic methods is expected to yield different concentrations that cannot be compared directly but need to be interpreted carefully. A bias plot 8 would provide an objective criterion for acceptability of the analytical performance of a new diagnostic method, but requires that a standard reference method is available. As the cα1-PI ELISA, however, cannot be regarded as a gold standard test, the agreement of both methods was assessed by a Passing–Bablok regression, a difference plot and a kappa coefficient that measures the agreement of both assays beyond what would be expected simply by chance. The Bland–Altman plot for comparison of the cα1-PI RIA with the cα1-PI ELISA yielded a negative bias of approximately 7% (0.028 on the log scale). The plot also indicated that 95% of the Fcα1-PI concentrations measured by the new RIA were between 0.27 and 4.19 times the Fcα1-PI concentration obtained by ELISA, and repeatability testing of the RIA revealed that using different methods accounted for the majority of the deviation. To determine whether this difference is clinically acceptable, a quadratic weighted kappa coefficient was calculated on a 3-point scale (normal Fcα1-PI, mildly increased Fcα1-PI, and moderately to severely increased Fcα1-PI concentration), and indicated substantial agreement (κ w = 0.68) between the 2 methods suggesting an acceptable analytical performance of the new cα1-PI RIA.
In summary, the RIA described herein is sensitive, linear, accurate, precise, and reproducible, and has the potential to distinguish healthy dogs from dogs with GI protein loss. The new method agrees substantially with the previously developed and analytically validated cα1-PI ELISA which, therefore, has been replaced by this newly developed cα1-PI RIA. Further studies to test this new cα1-PI RIA in dogs with chronic enteropathies and/or PLE are needed and are currently in progress. Also, further research is warranted to determine the underlying cause of higher cα1-PI concentrations measured in fecal samples from healthy dogs <1 year of age.
Footnotes
Acknowledgements
The authors wish to thank Niels Grützner for providing assistance with the collection of fecal samples from dogs. The authors also acknowledge Christopher E. Mize for technical assistance with the radio-labeling procedure.
a.
Fecal collection tube (101 × 16.5 mm; with spatula), Sarstedt AG&Co., Nümbrecht, Germany.
b.
BupH™ Phosphate buffered Saline, Thermo Scientific, Rockford, IL.
c.
Newborn Calf Serum, Sigma-Aldrich Co., St. Louis, MO.
d.
Surfact-Amps® X-100, Thermo Scientific, Rockford, IL.
e.
Fisherbrand® serum filter system (I.B.™ model), Fisher Scientific Inc., Pittsburgh, PA.
f.
PD-10 Desalting column (1.5×5 cm), GE Healthcare Bio-Sciences Inc., Piscataway, NJ.
g.
Corning® polypropylene tubes, Fisher Scientific Inc., Pittsburgh, PA.
h.
Rabbit serum (sterile-filtered), Sigma-Aldrich Co., St. Louis, MO.
i.
Precipitating solution (N6), Diagnostic Products Corporation, Los Angeles, CA.
k.
Wallac 1470 WIZARD, Perkin Elmer Life and Analytical Sciences Inc., Wellesley, MA.
l.
JMP (v.8.0), SAS Institute Inc., Cary, NC.
m.
Analyse-it® software (v.2.22) for Microsoft Excel, Leeds, United Kingdom.
The immunoassay described here is currently offered on a service basis at the authors’ laboratory.
The authors declared that they received no financial support for their research and/or authorship of this article.