
Abstract
Test data generated by ~60 accredited member laboratories of the American Association of Veterinary Laboratory Diagnosticians (AAVLD) is of exceptional quality. These data are captured by 1 of 13 laboratory information management systems (LIMSs) developed specifically for veterinary diagnostic laboratories (VDLs). Beginning ~2000, the National Animal Health Laboratory Network (NAHLN) developed an electronic messaging system for LIMS to automatically send standardized data streams for 14 select agents to a national repository. This messaging enables the U.S. Department of Agriculture to track and respond to high-consequence animal disease outbreaks such as highly pathogenic avian influenza. Because of the lack of standardized data collection in the LIMSs used at VDLs, there is, to date, no means of summarizing VDL large data streams for multi-state and national animal health studies or for providing near-real-time tracking for hundreds of other important animal diseases in the United States that are detected routinely by VDLs. Further, VDLs are the only state and federal resources that can provide early detection and identification of endemic and emerging zoonotic diseases. Zoonotic diseases are estimated to be responsible for 2.5 billion cases of human illness and 2.7 million deaths worldwide every year. The economic and health impact of the SARS-CoV-2 pandemic is self-evident. We review here the history and progress of data management in VDLs and discuss ways of seizing unexplored opportunities to advance data leveraging to better serve animal health, public health, and One Health.
Keywords
Introduction
The need for growth and advancement of high-quality veterinary laboratory diagnostic services to support animal agriculture was recognized after World War II in the United States and worldwide. Improved quality and standardization of facilities, equipment, technology, data management, testing methods, and training were needed to enable veterinary laboratory medicine to grow and thrive for the benefit of animal and public health. This need led to the formation of an organization of veterinary laboratory diagnostic medicine in 1958, known as the Conference of Veterinary Laboratory Diagnosticians (CVLD; in 1968, renamed the American Association of Veterinary Laboratory Diagnosticians, AAVLD). One of the early objectives of the new organization included “collection and distribution of information from each laboratory regarding. . . experiences in the diagnosis of certain diseases.” Interestingly, the annual meeting of the CVLD held in Charleston, WV in 1960 adopted the theme of “standard nomenclature for animal diseases.” However, > 50 y later, the goal of implementing a nomenclature standard for veterinary diagnostic laboratories (VDLs) has still not been achieved. At the CVLD meeting in Buffalo, NY in 1966, the first discussions were held regarding the possible use of data-retrieval systems for VDLs via mainframe computers. These discussions laid the foundation for the AAVLD committees on animal disease reporting, epidemiology, and veterinary informatics. 18
We explore here ways that VDLs generate and capture standardized animal health laboratory data streams, and how the data are used by practitioners, producers, and animal owners. We also present prospects for the presentation and use of VDL data streams to better serve animal and public health.
Leveraging VDL data
Single-animal and single-herd clinical cases for laboratory clients
There has been much progress in the development of laboratory information management systems (LIMSs) to better serve VDLs and their clients over the last 40 y. Thirteen or more LIMSs have been developed and implemented at over 50 laboratory sites specifically for use in veterinary laboratory medicine. LIMSs have been developed to work primarily at the accession level. Accessions generally pertain to a single animal patient or a group of animals on a premises. An accession form is filled out (manually or electronically) by the client (practicing veterinarian, animal owner, producer). The form contains fields for names and contact information for all associated parties, animal identification and signalment, clinical history, number of animals in the group, number of animals sick and dead, specimens collected and date, tests requested, and other relevant information. The accession data are captured in the LIMS as well as the test orders, test results, case coordination, review, finalization, and case report delivery to the client (preliminary and final reports).
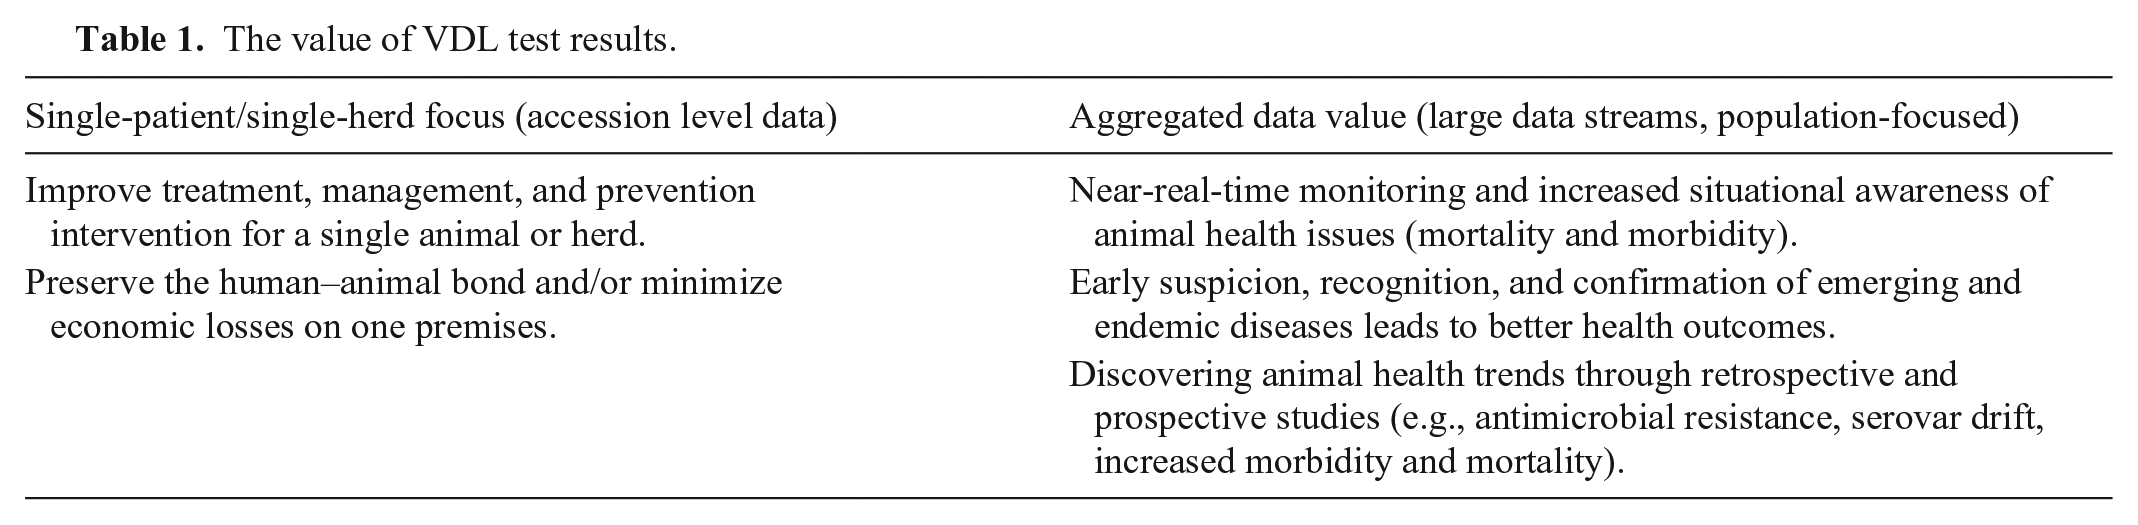
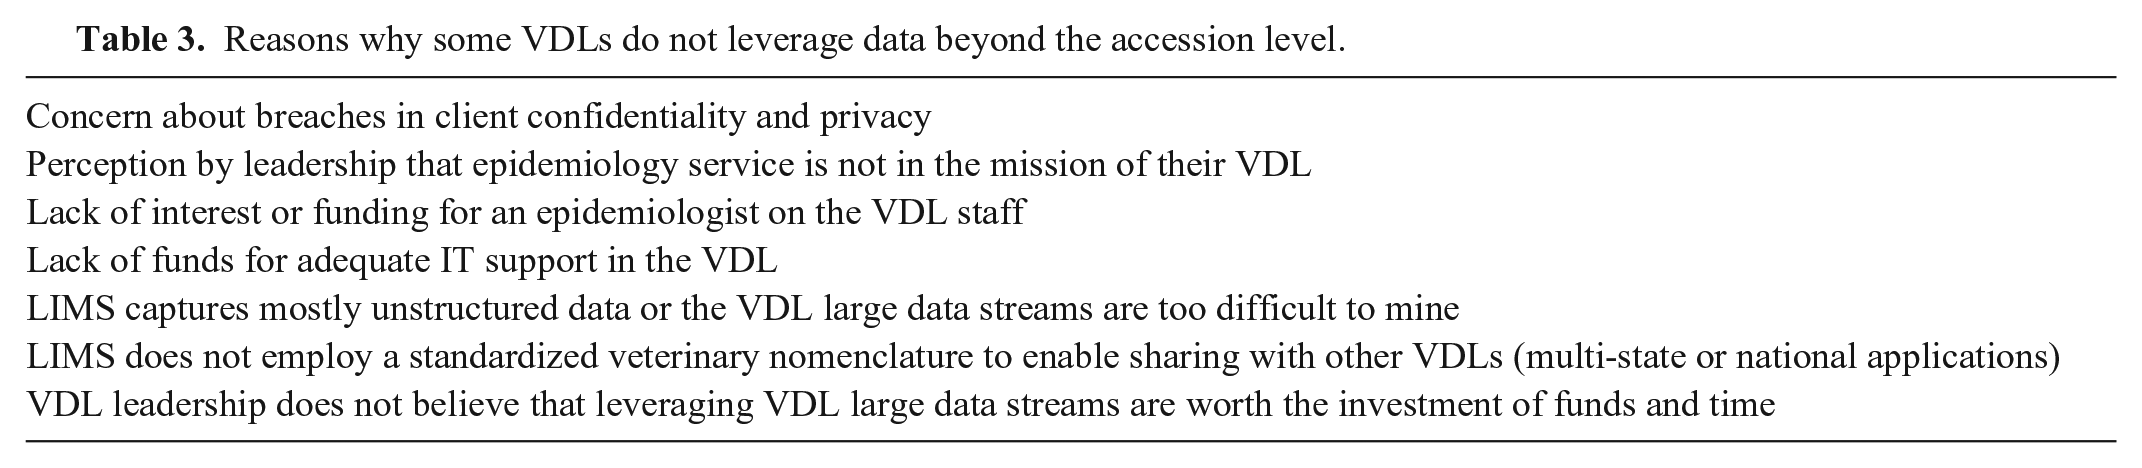
For single-patient and single-herd cases, the accession case report is used by the veterinarian-client or producer to expand on other knowledge associated with the case to arrive at a confirmed diagnosis and to implement a sound treatment, prevention, and management plan to maintain the health of an animal or group of animals. In the case of a death, postmortem and histopathology findings aid in arriving at a diagnosis to help prevent further morbidity or mortality in other healthy animals on the premises. An accounts receivable software system is usually integrated with the accession management part of the system. In addition, most LIMSs include a searchable case archive. The archive provides many opportunities for creative use of accession data far beyond the case report (Tables 1, 2). The use of archived VDL data streams beyond the single accession level varies across AAVLD laboratories for different reasons (Table 3).
The value of VDL test results.
Examples of VDL large data leveraging methods to benefit animal and human health that go beyond the initial case report.
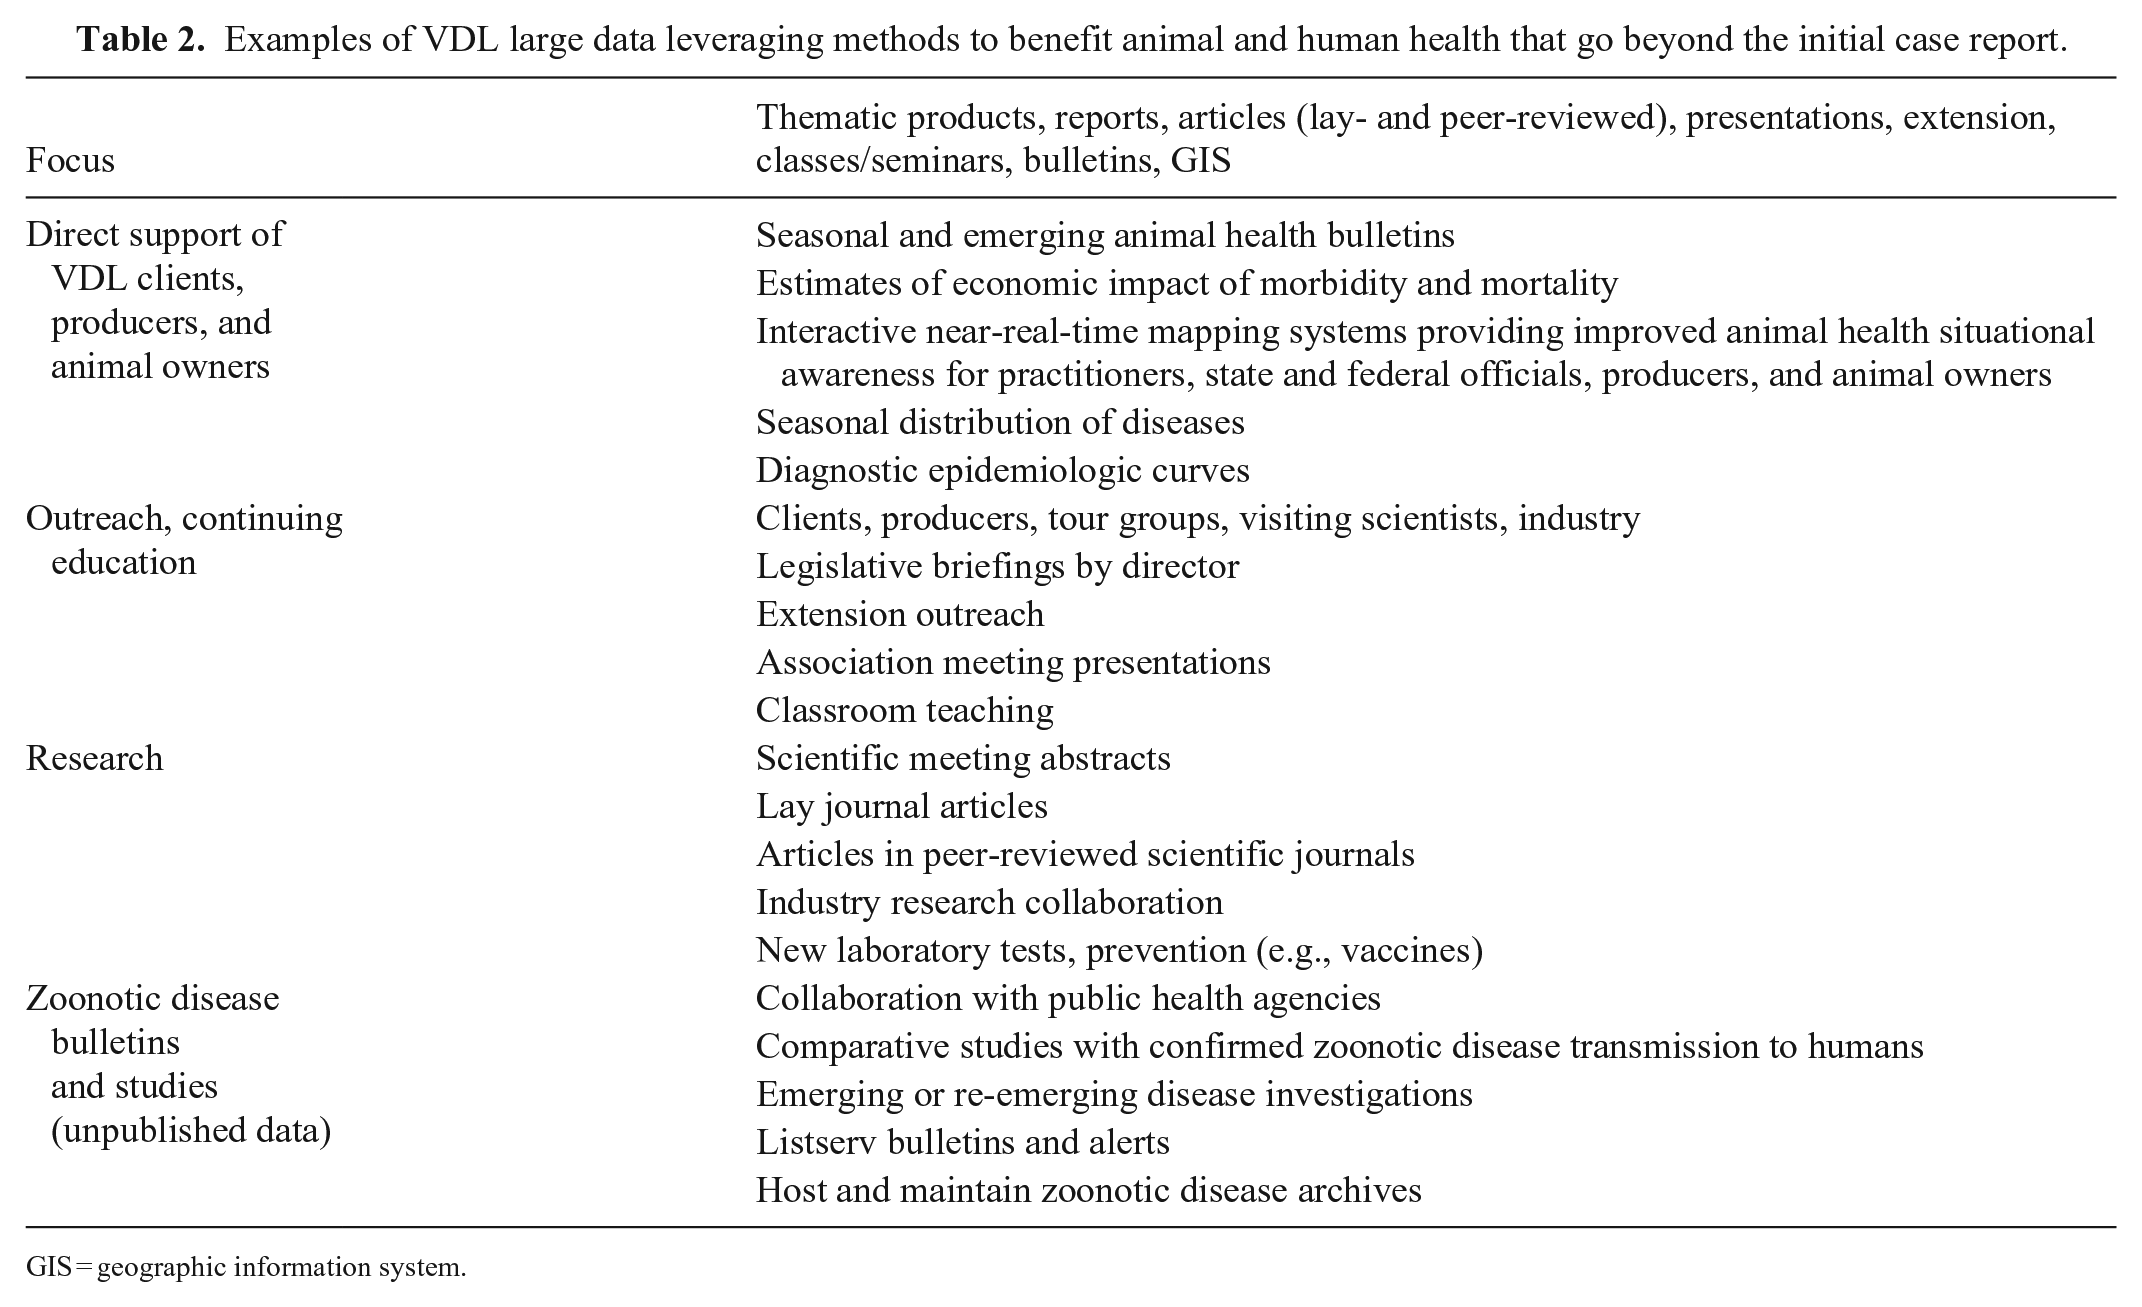
GIS = geographic information system.
Reasons why some VDLs do not leverage data beyond the accession level.
Aggregation of clinical case findings to better serve animal health and public health
We have extensive experience leading or collaborating on regional and national animal health studies driven by VDL data streams.3–9,13,14,17 Standalone state and university VDLs managing their accession data (single LIMS) can readily mine and summarize data for one or more years of archived accessions. This activity is possible because the datasets are extracted from a single database using a locally developed and implemented veterinary nomenclature. The nomenclature utilized in a single LIMS can be thought of as a standardized veterinary nomenclature system (SVNS) for that one laboratory. But when 2 or more laboratories are using LIMSs driven by different nomenclatures, data sharing and summarization is not possible without tedious, error-prone data manipulation steps.
To date, the 13 veterinary LIMSs marketed for VDLs have not adopted a recognized SVNS for capturing high-value nominal data elements such as signalment, specimens, etiologies, lesions, and confirmed diagnoses. The time involved in normalizing non-standardized data can discourage individuals from conducting in-depth investigations of VDL large data streams. In our experience, this time requirement can easily increase the effort to conduct studies and build data presentation tools by a full order of magnitude. The only exception to this rule is when working with discrete and continuous numerical test results (titers, serum chemistry results, toxicologic assays) and dichotomous data (test positives and negatives). Most numerical data for similar tests are nearly equivalent, and therefore are much easier to share and summarize.
AAVLD accreditation program
The AAVLD accreditation program inherently supports the generation of high-quality data. Accreditation is based on a rigorous set of requirements that must be met by laboratories, including administrative (organization, management, personnel, finance, budget), management (quality assurance), and technical requirements (lab environment, test methods and validation, proficiency testing, instrumentation, specimen handling, data proofing, and reporting; (https://www.aavld.org/accreditation-requirements-page). AAVLD accreditation requirements help assure the quality and timeliness of the data generated by testing in accredited laboratories. Client complaints regarding issues such as incorrect, misspelled, incomplete, or missing data elements must be logged as a nonconformance, with follow-up corrective and preventive actions and monitoring that leads to a resolution of the issue and prevention of future occurrences.
Collectively, the AAVLD requirements instill confidence in the clients utilizing accredited laboratories. Practicing veterinarians base their treatment, prevention, and management plans for single patients and herds or flocks on the results of testing at AAVLD-accredited laboratories. Therefore, the quality of the laboratory test results is critical. Furthermore, any data leveraged to conduct regional or national studies, or to build animal health monitoring systems, must also be driven by high-quality, accurate VDL testing data.
National Animal Health Laboratory Network
The Public Health Security and Bioterrorism Preparedness and Response Act was passed in 2002. This Act authorized the Secretary of Agriculture to build a network of laboratories (the National Animal Health Laboratory Network, NAHLN) that would serve as an early warning surveillance system to guard against the risk of foreign animal diseases, such as foot-and-mouth disease, gaining entry to the United States. The NAHLN leverages state-based VDL assets (facilities, equipment, instruments, information systems, well-trained professional staff) in partnership with the USDA Animal and Plant Health Inspection Service (APHIS) and the National Institute of Food and Agriculture (NIFA). Requirements for laboratory participation include the utilization of standardized testing methods and data messaging standards to accomplish laboratory surveillance testing (peacetime) and in the face of outbreaks (wartime).
Standardized testing and reporting are performed for ~14 high-consequence disease agents identified by the NAHLN Steering Committee. 22 The results are electronically messaged by the respective LIMS to the NAHLN central repository. Data exchange is based on the Health Level 7 (HL7) international electronic messaging standard and nationally recognized reference terminologies including the Logical Observation Identifiers Names and Codes (LOINC) and the Systematized Nomenclature of Human and Veterinary Medicine (SNOMED). In 2002, the American Veterinary Medical Association (AVMA) declared these 3 tools as the official informatics standards for veterinary medicine. The adoption of these standards improves the ability to share information rapidly and efficiently and to provide individual laboratories with the ability to share data directly with one another. 2
Data leveraging VDL large data streams to improve animal health situational awareness
The sophisticated real-time tracking, monitoring, and mapping of the spread of the COVID-19 pandemic by institutions such as Johns Hopkins University, Harvard University, and others around the globe, is a striking example of the value of using laboratory testing data to improve medical situational awareness (SA). Unfortunately, veterinary laboratory medicine has not yet seized these opportunities to utilize their large data streams for this purpose.
The term SA has its origins in the military. History abounds with recountings of soldier vulnerability resulting from poor intelligence (lack of SA), further to the absence of cooperation, coordination, communication, and transparency with allies. Building an analogy for veterinary laboratory medicine, our allies are our sister AAVLD laboratories, federal animal health laboratories and agencies, and public health laboratories. These units should be working together as closely as possible, communicating and sharing important data streams (archived LIMS databases). 24
In simple terms, SA is knowing what is going on around you. From a medical standpoint, the most important point is to recognize that one or more threats exist. VDLs are constantly confirming threats (the what) that exist in the form of infectious pathogens, parasites, intoxicants, and any confirmed diseases or syndromes. In most cases, VDLs are also aware of the approximate location of animals for which they are conducting testing based on farm/client/practice address (the where) and the approximate day and time (the when) of the event (date the case was received by the VDL). Fortunately, outbreak events plotted on a map do not need to be of high granularity to be useful epidemiologically (e.g., shaded case county COVID-19 count maps). The awareness that a disease or an etiologic agent has been identified in a larger area, such as a county, zip code, or an area within a set radius from a clinic location (localized), is as useful for monitoring animal health as it is for monitoring human health. Maintaining the confidentiality of data related to animal health SA is very important but is beyond the scope of this paper. However, the key concept is that utilizing VDL large data streams can assist with animal health SA without violating veterinarian–client–patient confidentiality or privacy. 1 Assuming that a VDL captures the necessary data elements, it can provide some level of animal health SA for the entire area that it serves. However, because VDLs are not currently utilizing a SVNS with their LIMS, regional or national animal health monitoring or mapping to provide animal health SA is difficult.
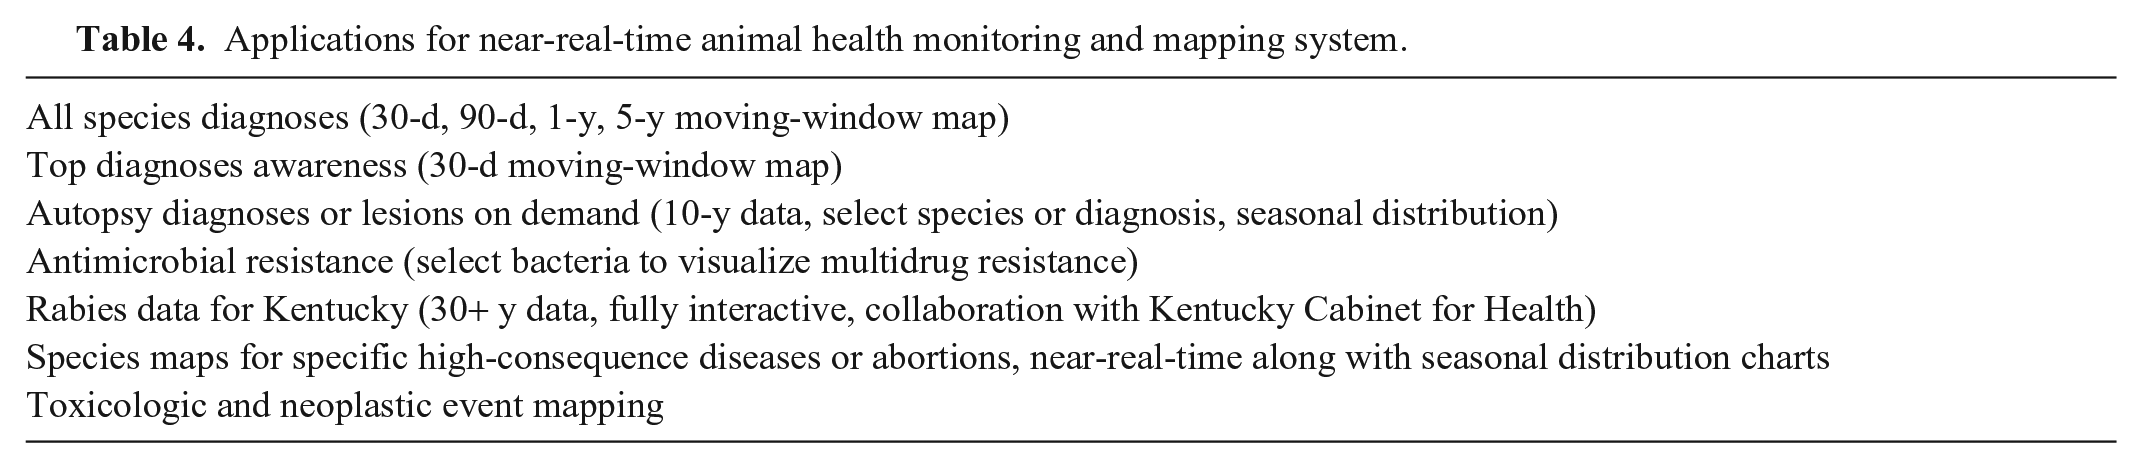
Near-real-time geographic information system mapping of VDL data streams was first published and made available as an online application on the University of Kentucky VDL (UK-VDL) website in 2006. The initial interactive map was a simple 30-d moving-window map of confirmed diagnoses and lesions in the 120 counties in Kentucky. This thematic product provided animal health SA for practicing veterinarians, producers, and clients. Utilizing state-of-the-art software tools, the maps are now updated without human intervention, drawing data streams directly from the LIMS database on a preset schedule. The frequency of updates is determined by a configuration setting for each map. It is now possible for the system to update any map immediately as a new diagnosis or other finding (e.g., etiology) is captured and released for distribution to the client. Each map allows users to click on the county of choice to display a list of all the diagnoses or lesions confirmed by the UK-VDL by date and species. In a pilot project, data from the Breathitt Veterinary Center in western Kentucky were added to the moving-window map to demonstrate proof-of-concept for a multi-laboratory implementation of the mapping system. To date, there are > 40 specialized mapping applications available that cover etiologies and diagnoses of high interest for all domestic species (http://vdl.uky.edu/EpidemiologyInformation.aspx; Tables 4, 5). The system has been expanded to include epidemic curves for outbreaks (e.g., abortions, infectious diseases), seasonal distribution charts, and health event distribution maps for confirmed diagnoses in most domestic species.
Applications for near-real-time animal health monitoring and mapping system.
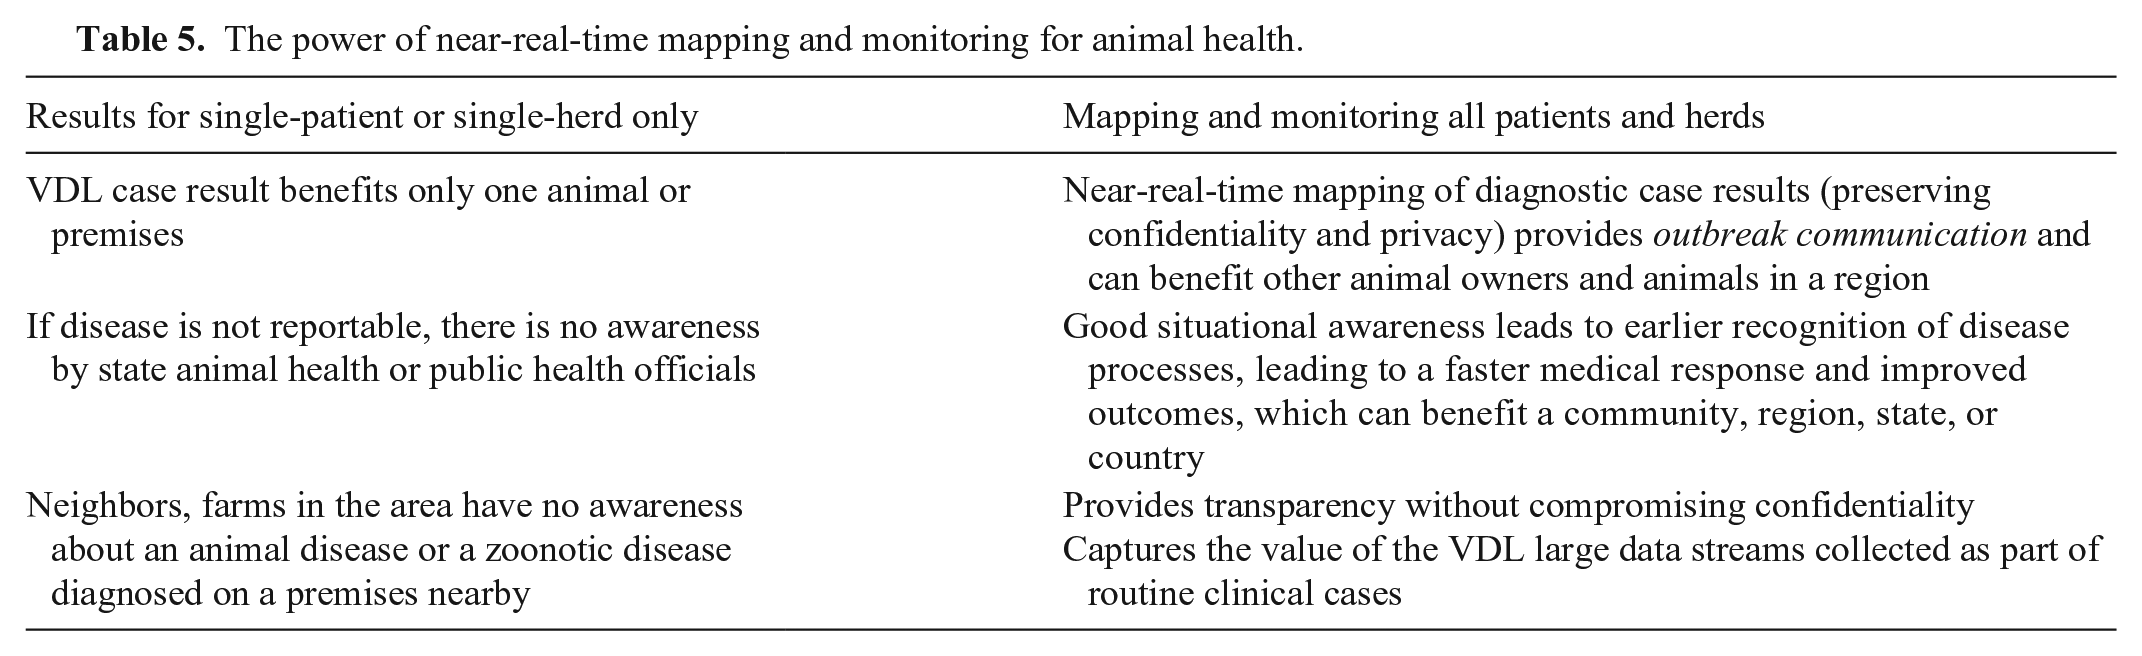
The power of near-real-time mapping and monitoring for animal health.
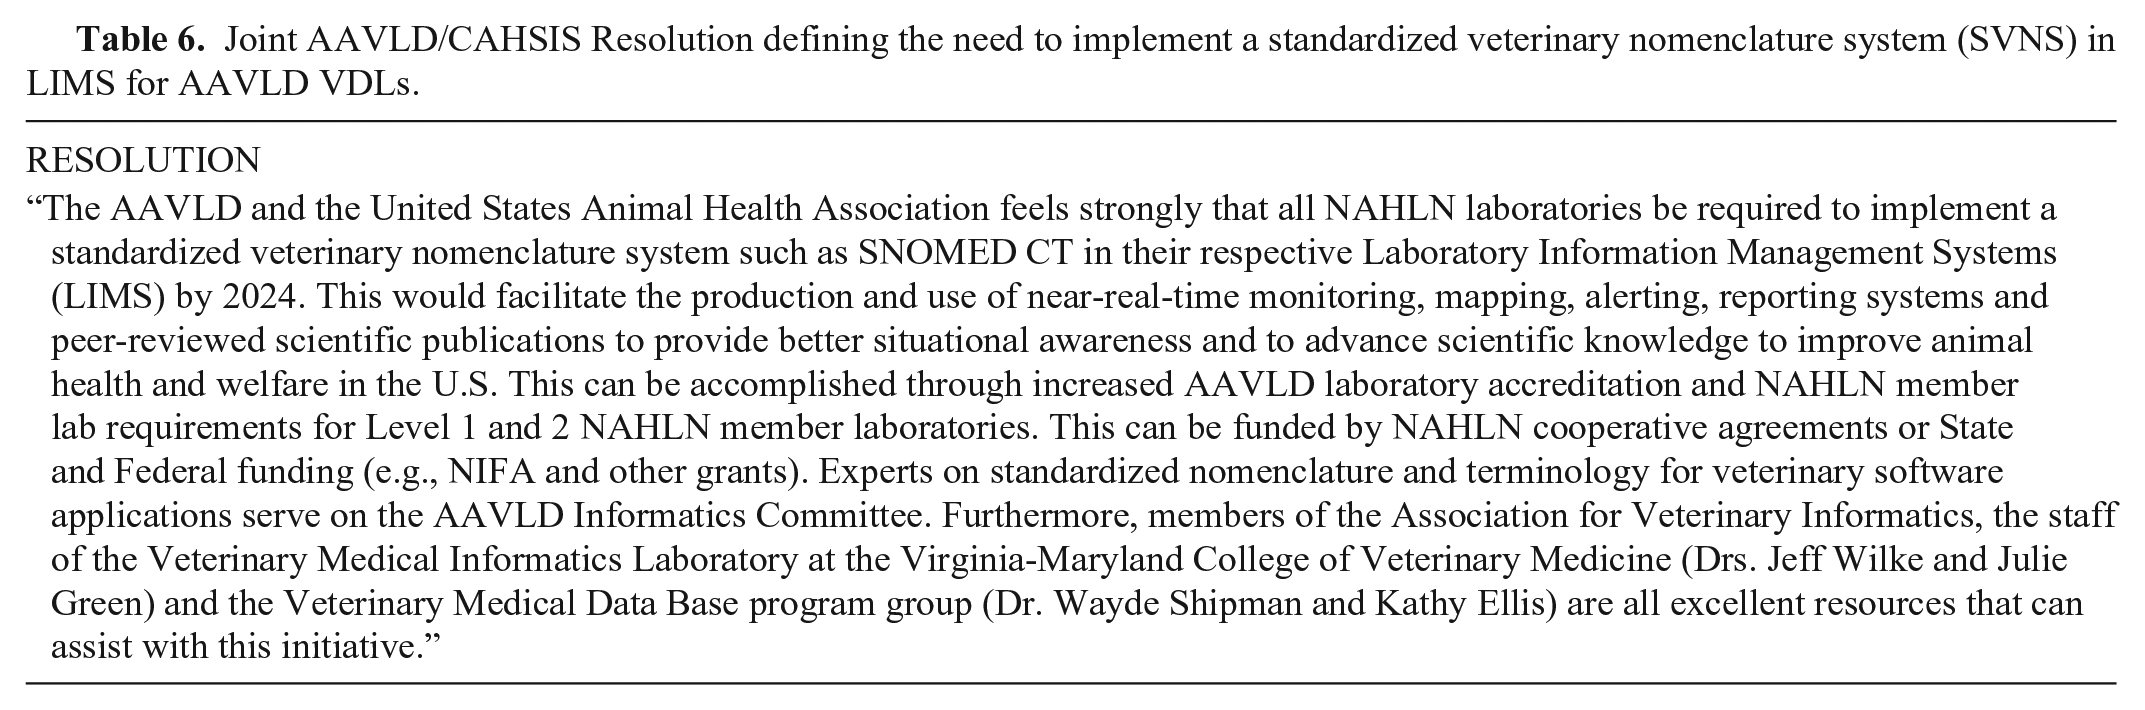
The UK-VDL mapping initiative has generated positive feedback from UK-VDL clients (practicing veterinarians, producers, animal owners) since implementation. In 2018, an informal survey of VDL directors was completed to determine if their laboratory would participate in a pilot project to expand the VDL large data stream mapping initiative beyond Kentucky. Thirteen states replied in the affirmative. This VDL interest, along with the progress being made regarding the USDA APHIS National List of Reportable Animal Diseases (NLRAD), inspired the idea of building regional and national versions of the Kentucky mapping and monitoring system. 23 Proposals have been presented to the AAVLD Epidemiology Committees and the Joint AAVLD/USAHA Committee on Animal Health Surveillance and Information Systems (CAHSIS) in 2015, 2017, 2018, and 2019 with resolutions approved in 2017 and 2019 (Table 6). An invited presentation was made to the CAHSIS at the virtual meeting on 9 October 2020. VDL large data streams can improve SA for endemic and emerging diseases. Increased awareness and knowledge of diseases that cause morbidity and mortality in animals in a practice region should lead to better health outcomes.
Joint AAVLD/CAHSIS Resolution defining the need to implement a standardized veterinary nomenclature system (SVNS) in LIMS for AAVLD VDLs.
A moving-window map, such as the 30-d moving-window map of all diagnoses or lesions confirmed on autopsy cases at the UK-VDL, is one means of providing SA regarding disease confirmations in an outbreak 10 (Fig. 1). The user can click on any county to see a pop-up window that lists the diagnosis or lesions, species of animal, date the case was received by the laboratory, and the total times the diagnosis was found, or the lesion identified. This provides SA regarding the most recent diagnoses or lesions confirmed on autopsy cases for all counties that submitted cases during the 30-d period. The map display can also be filtered by species and diagnoses or lesions. The chart below the map graphs the numbers of cases for which a diagnosis or lesion was submitted for the 30-d period, providing a rough indication of the busiest days of submission to the laboratory. With these data, the mapping initiative team is now planning to begin various statistical analyses of the data streams driving the maps to ascertain significant trends in the disease diagnoses and lesions over time by species. For users that wish to view a broader timeframe, 90-d, 1-y, and 5-y moving-window maps are also available on the UK-VDL website.
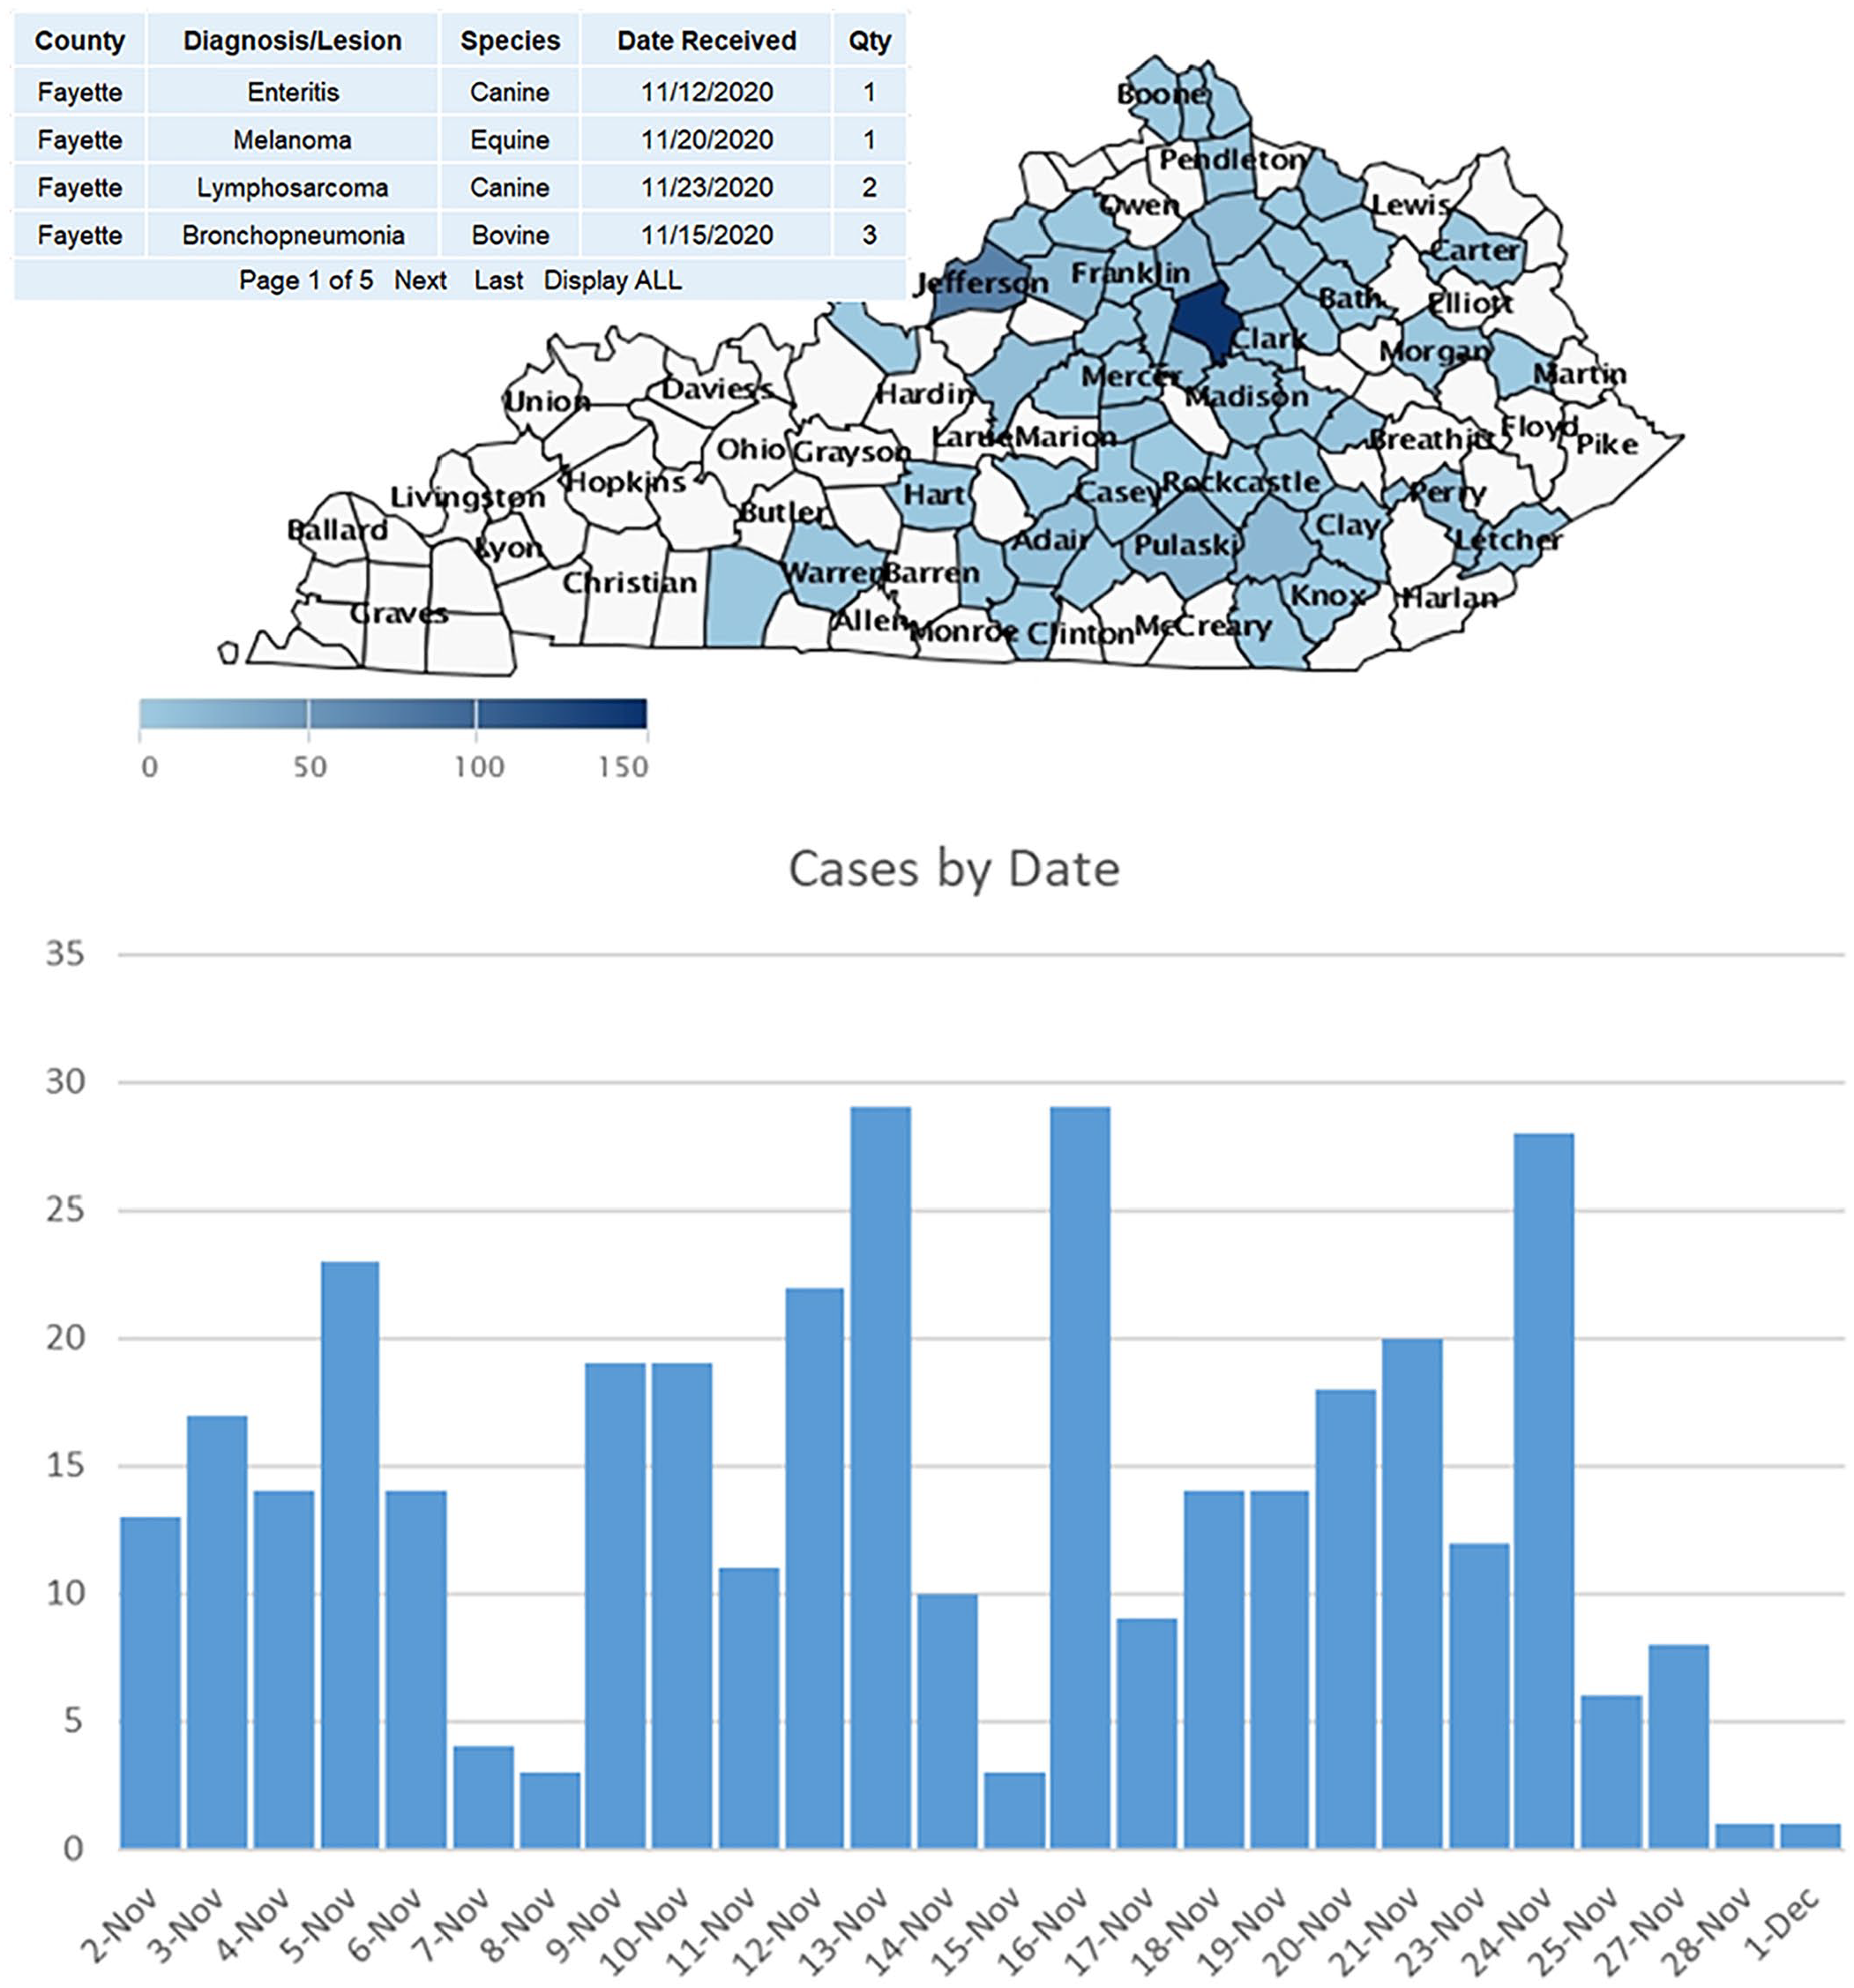
30-d moving window of diagnoses/lesions confirmed at UK-VDL.
The UK-VDL entered a collaborative project with the Kentucky Cabinet for Health to become the repository for all rabies testing data for the state. The UK-VDL epidemiologist (JL Smith) then built an interactive mapping system that now hosts ~32 y of rabies testing data for Kentucky (Fig. 2). The rabies database contains ~35,000 animals that have been tested in Kentucky, with 832 positive tests. The system allows users to click on any of 120 counties to view rabies testing results for any date range, including the entire 30-y database. The user can view specific test results (e.g., negative, positive, unsatisfactory specimen for testing) or simply view all results. The views can also be filtered by species (currently 95 species) or by county. Below the Kentucky map is a bar chart of the total number of animals tested by test result for the date range selected. Two UK Master of Public Health students have used the database and the rabies mapping system to complete their required Capstone projects. The mapping system has generated enquiries and praise from the Centers for Disease Control, Johns Hopkins University, and other institutions. The rabies mapping system has also become a strong teaching resource for senior veterinary students in the Lincoln Memorial University College of Veterinary Medicine. During the timeframe of 2016–2020, the interactive rabies map has had ~10,000 individual visitors with > 40,000 hits.
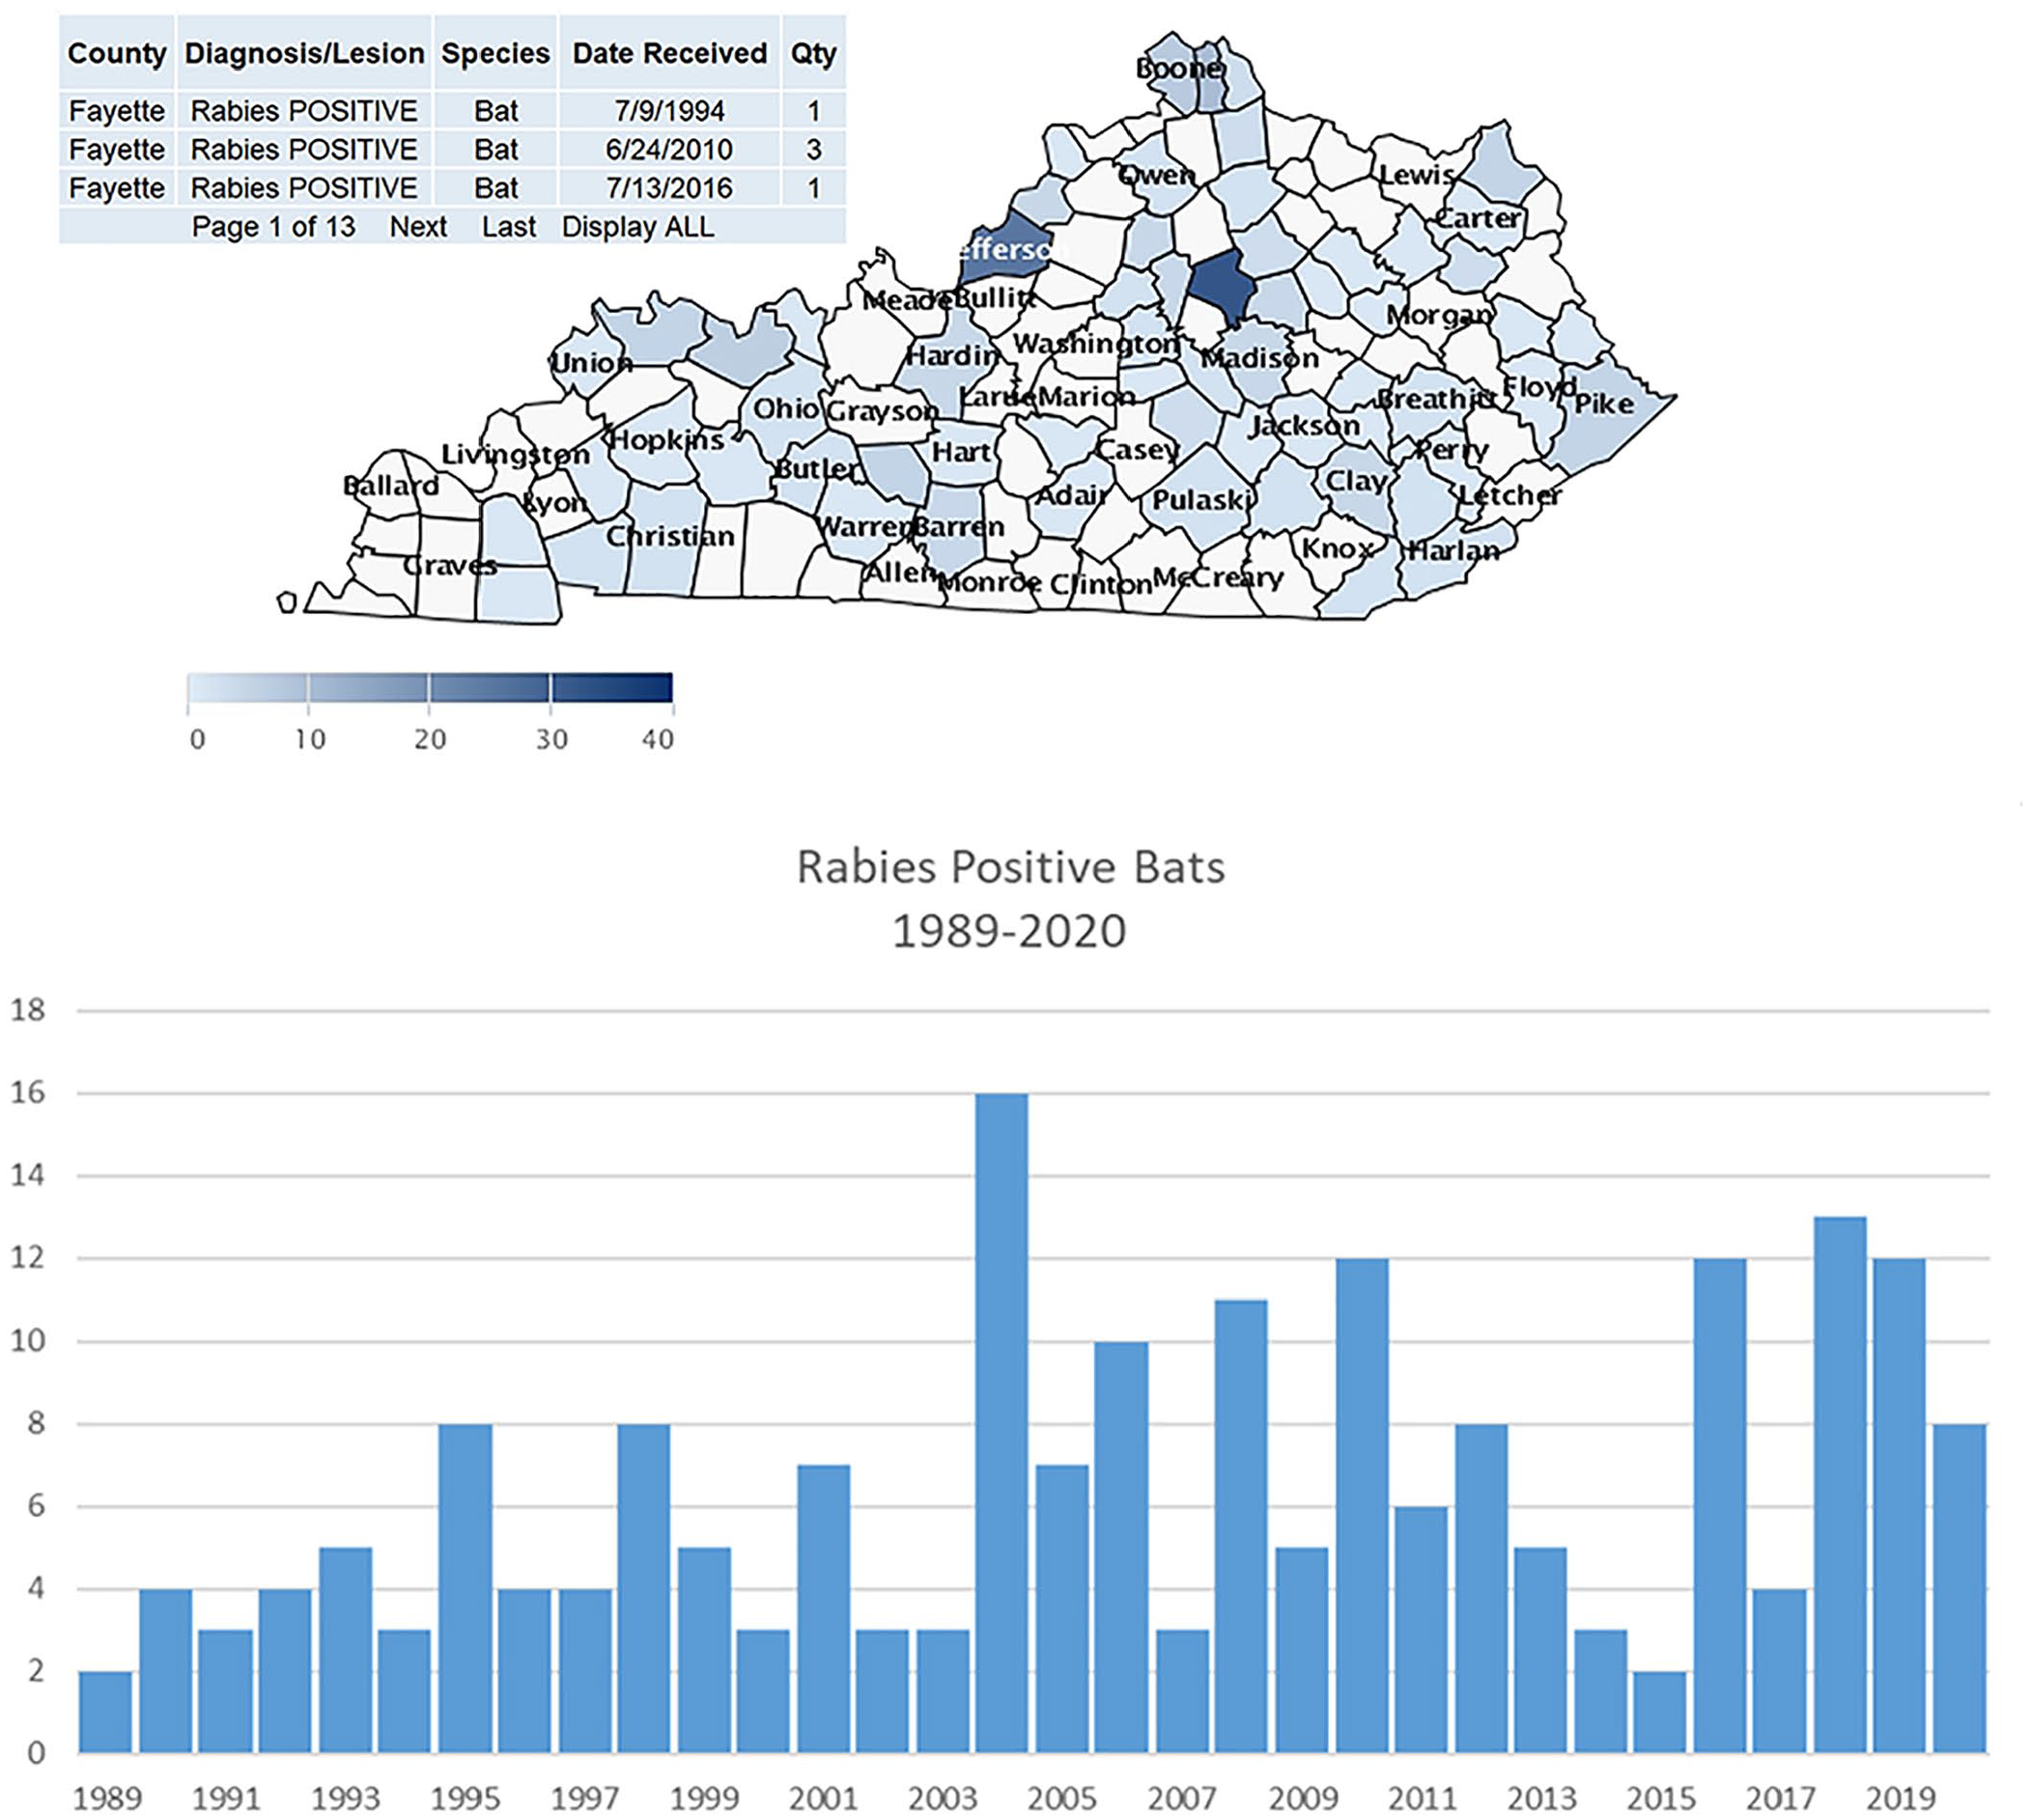
Interactive map of rabies testing completed over ~32 y.
VDL data streams are ideal for monitoring disease occurrence and spread in a region. Since ~2000, Kentucky has experienced 2 major equine abortion syndromes: mare reproductive loss syndrome (MRLS) and nocardioform placentitis (NP). During the MRLS outbreak, > 4,500 foals were aborted, leading to $500 M in economic losses for the reproductive years 2001 and 2002. 20 At the time, the UK-VDL could not electronically monitor the number of aborted fetuses received by the laboratory or the geographic spread around Kentucky. This incited panic in the Kentucky equine industry and became the justification to recruit an epidemiologist to establish a VDL-based animal disease monitoring program for the UK-VDL. Later we formed a team that built an equine abortion early-warning system for which a retrospective intervention study was performed utilizing VDL data streams from the MRLS outbreak. Had the system been in place in 2001 and 2002, the abortion outbreak would have been detected at least a week before traditional surveillance systems and would have quickly identified new clusters of abortion. 19 Today, all causes of equine abortion are monitored daily by the mapping system to assure timely SA and alerts regarding a possible abortion storm.
NP was first recognized in Kentucky in the 1980s. Two causative agents, Crossiella equi and Amycolatopsis spp., have been identified in outbreak studies over the years. The mode of transmission of this syndrome is still unknown. The largest outbreak in Kentucky history occurred in 2010 to 2011 when > 300 aborted foals were confirmed with NP by PCR at the UK-VDL. By this time, the UK-VDL had established a strong animal health monitoring system based on large VDL data streams of laboratory testing data, which has aided practicing veterinarians, horse farm managers, and UK researchers (Fig. 3). The testing data was also utilized for several peer-reviewed publications that helped to characterize the epidemiology and pathogenesis of the syndrome and led to trials to attempt to induce NP abortion experimentally.11,12,15,16
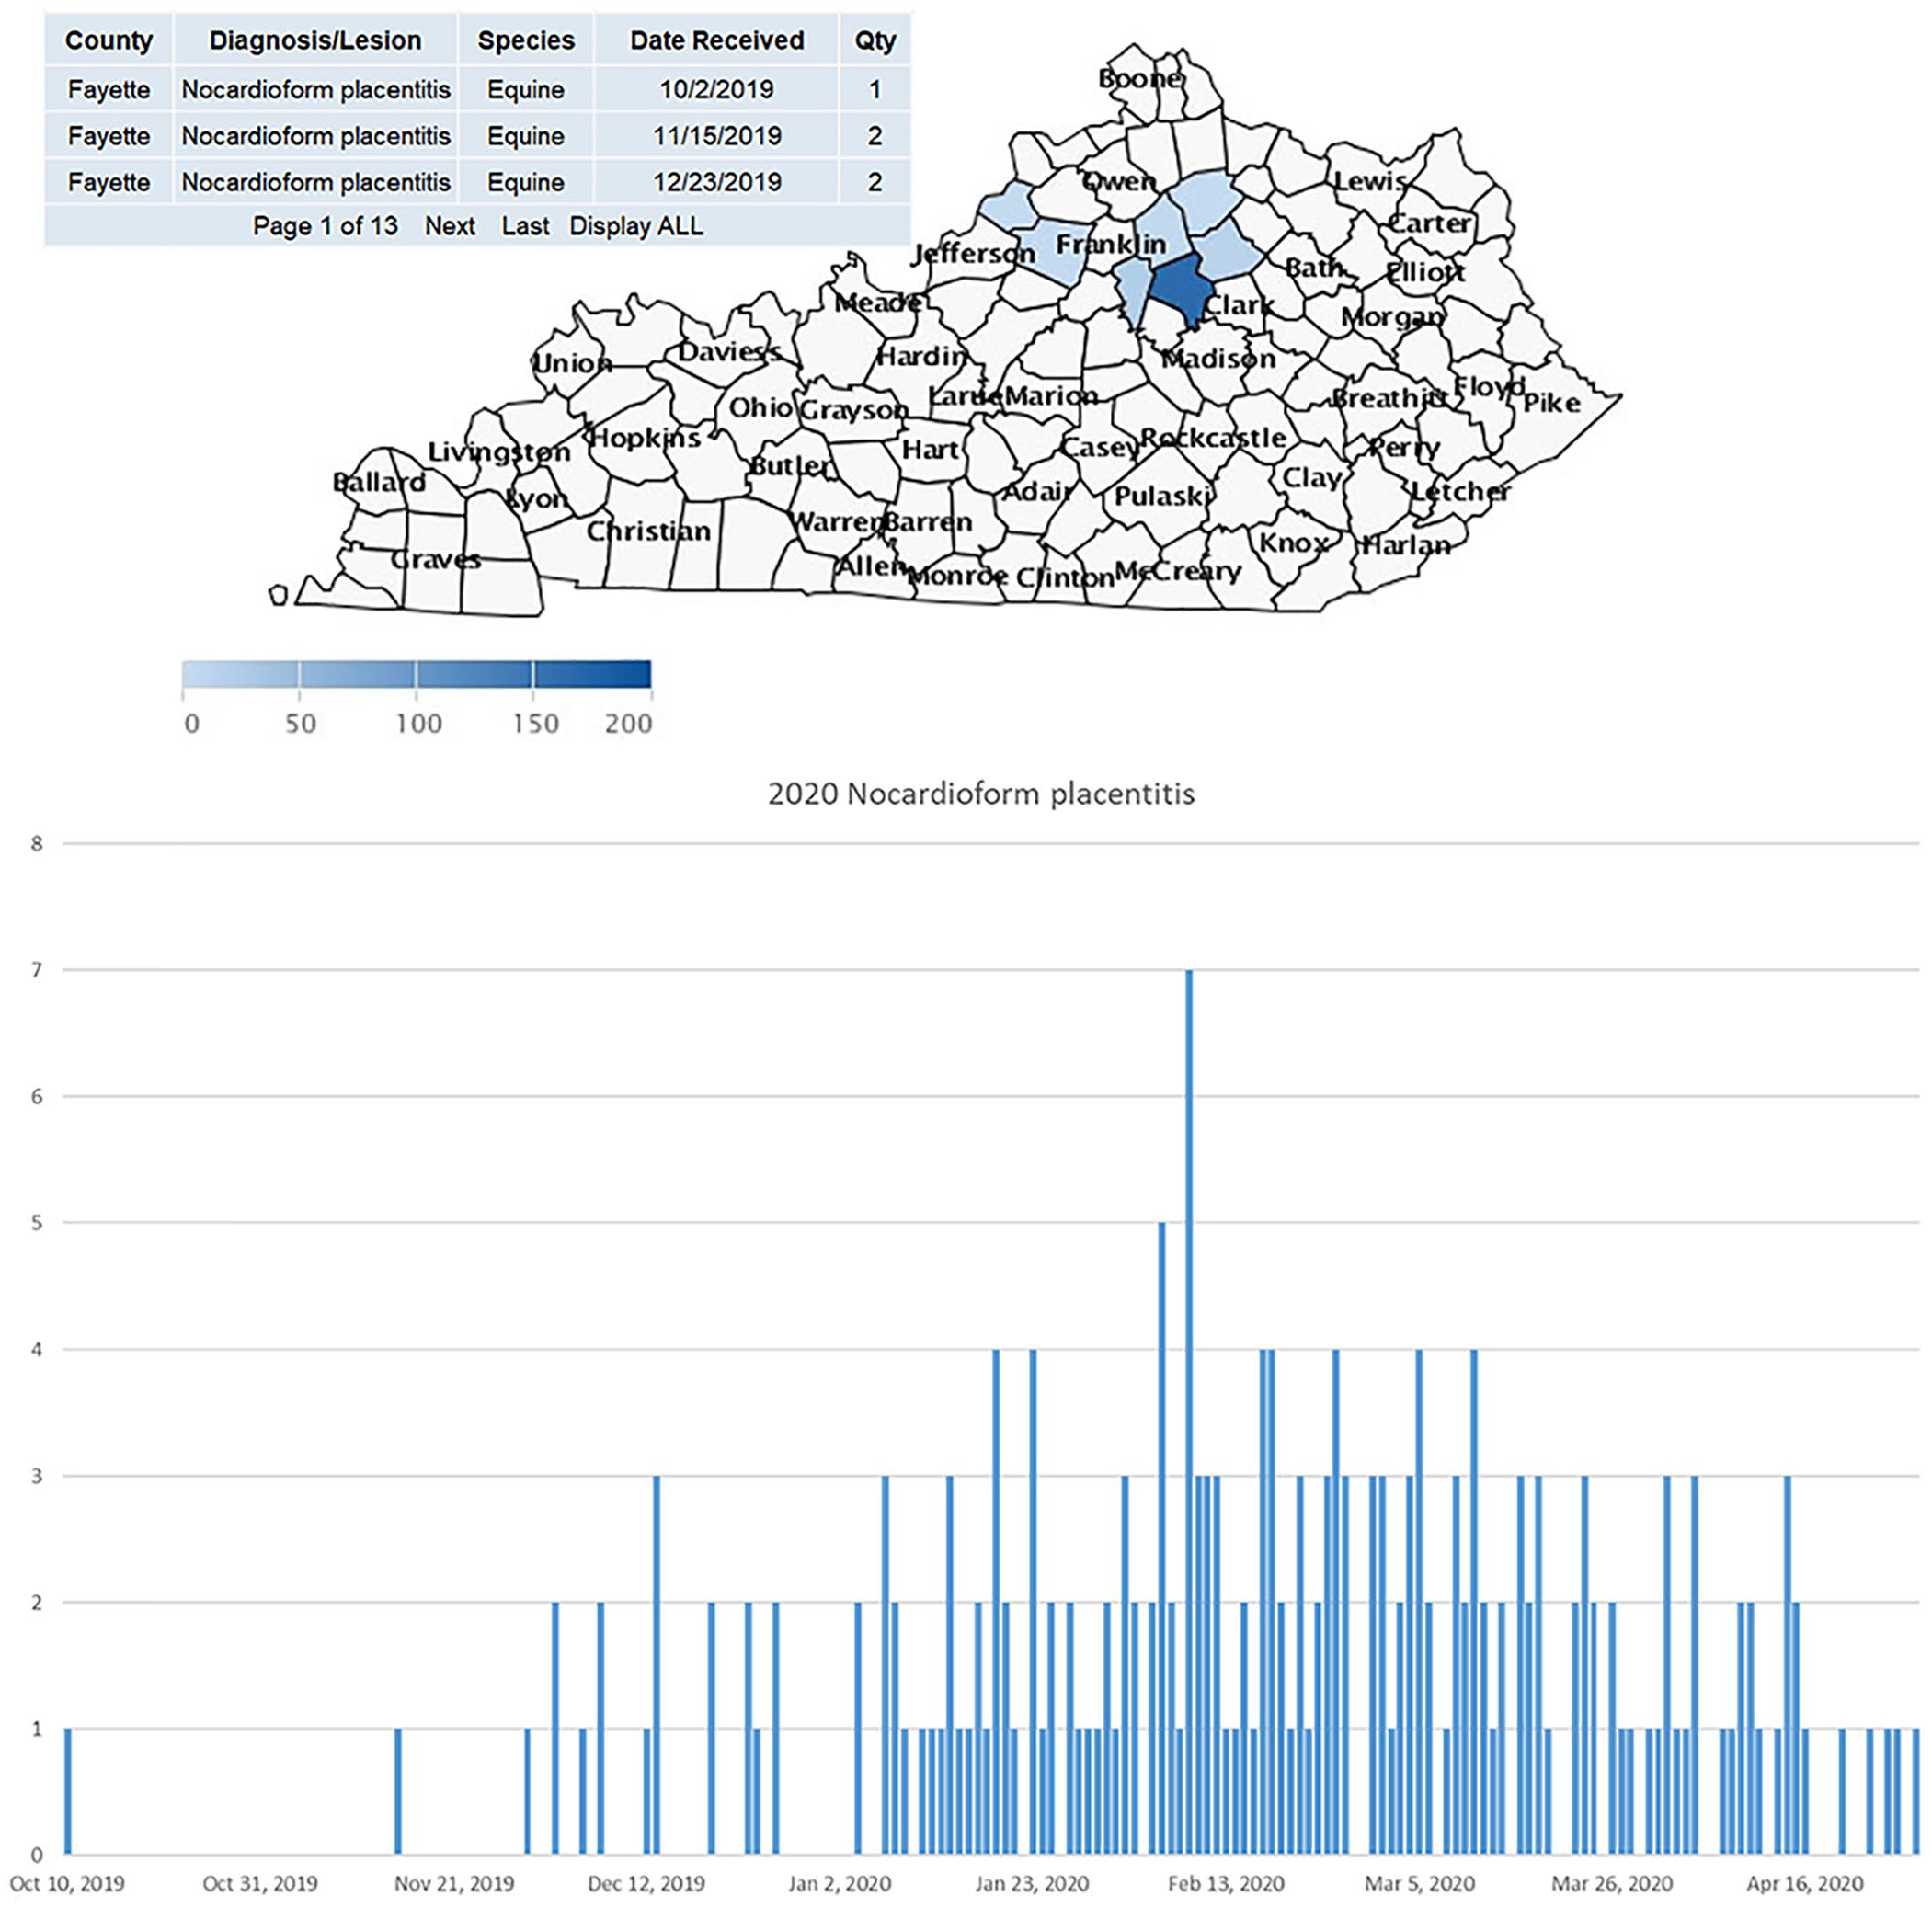
Equine reproductive season monitoring map of nocardioform placentitis (NP) abortions.
In 2006, we began studying the problem of equine leptospiral abortion in Kentucky. Because the average value of foals in eastern Kentucky is high, a large proportion of aborted foals are submitted to the UK-VDL for autopsy and testing. The VDL archives were mined to retrieve all equine leptospiral abortion cases submitted to the UK-VDL for autopsy and testing from Kentucky farms in 1993 to 2006. This enabled farm traceback studies to determine the estimated value of foals lost. Surprisingly, an estimated $100 M in foals were lost in that timeframe, with average losses of $3 to 5 M per year. At the time, there was no licensed vaccine for horses. Veterinary vaccine and biologics companies were contacted to promote the idea of creating and marketing a licensed leptospiral vaccine for the horse. The reaction to the proposal was that leptospirosis was not thought to be highly prevalent in horses, except possibly in the Kentucky Bluegrass region. The perception by industry was that the demand for a vaccine would be weak. Hence, we conducted a national seroepidemiologic study to assess the exposure to leptospires in horses. The study, which included VDLs in 29 U.S. states and 1 Canadian province, demonstrated that a large proportion of horses across the United States had high positive microscopic agglutination titers for multiple serovars of leptospires, indicating a potential risk for contracting the disease. Clinical leptospirosis in the horse can result in abortion, chronic renal disease, and equine recurrent uveitis (blindness). The UK-VDL study prompted a major vaccine company to replicate the Kentucky national study, with concordant results. A vaccine was then developed and licensed for use in the horse and is now in broad use. For the first time in at least 30 y, the UK-VDL did not diagnose any equine leptospiral abortion cases for the 2019 to 2020 reproductive season. 4
These are just a few examples of how SA tools and epidemiologic studies based on VDL large data streams can be used to help promote animal health. It makes sense that studying high-quality VDL data streams in aggregate form will lead to better health outcomes for animals. The full implementation of a SVNS in all VDL LIMSs will be a major step in this direction.
Discussion and a strategy for the future
Thanks to outstanding AAVLD leadership in cooperation with various federal agencies, data management for veterinary laboratory medicine in North America has evolved appreciably since the 1970s, especially with the advent of modern information technology. Today’s LIMSs have achieved a high level of sophistication in the automation of accessioning, order entry, results entry, reporting, and accounts receivable, and the creation of rich, searchable case archives for epidemiologic studies, mapping, and beyond. Major milestones were achieved in the 1990s when AAVLD and VDL leaders realized the importance of quality assurance and national accreditation for laboratories. This has resulted in substantial improvement in the overall quality, accuracy, timeliness, and efficiency of laboratory testing performed by fully accredited VDLs.
In 2002, the leadership of the USDA and the AAVLD formed the initial NAHLN with 12 core VDLs across the United States. Today, the NAHLN is comprised of ~60 VDLs. The power of the NAHLN was demonstrated during the 2014 to 2015 outbreak of highly pathogenic avian influenza during which ~50 million chickens and turkeys were lost. The USDA has cited this outbreak as the worst animal disease event in U.S. history. The performance of the NAHLN during this event will be remembered as a hallmark animal health achievement. 21 Further, the NAHLN messaging system has clearly demonstrated how VDL LIMS large data streams from AAVLD-accredited VDLs can be shared and leveraged at the multi-state and national level through the implementation of a SVNS.
The NAHLN was first to demonstrate proof-of-concept regarding the ability to build a repository of large animal health data streams collected from multiple laboratories. That set the stage for all AAVLD-accredited laboratories to standardize LIMS terminology to enable multi-lab data sharing. Standardization would allow the NAHLN messaging system mission to expand beyond the current small number of select infectious agents. Imagine capturing VDL large datasets for all known etiologies (extrinsic and intrinsic) that lead to morbidity and mortality in animals. Envision a system that aggregates all known pathogenic bacteria and viruses, also including fungi, algae, chlamydia, parasites, protozoa, tumors, toxins, genetic disorders, and beyond. The AVMA-approved nomenclature standards (SNOMED, LOINC) can be used directly to replace locally developed, legacy domain tables in all LIMSs as an added accreditation requirement. This would be implemented on a predetermined launch date so that the LIMS veterinary nomenclature would be standardized into perpetuity. Maintenance of the SVNS nomenclature tables could be a team effort overseen by the Veterinary Terminology Services Laboratory at Virginia-Maryland College of Veterinary Medicine (https://vtsl.vetmed.vt.edu/default.cfm), which would provide guidance to information technology and other staff at each VDL. Once the conversion is completed, all VDLs would be able to share the archived, large data streams for the purpose of regional and national surveillance, outbreak responses, agricultural economic assessments, advancing animal health knowledge, and public health awareness.
In 2019, the UK-VDL confirmed > 4,300 individual diagnoses and lesions for animal cases based on autopsies, biopsies, and microbiologic, toxicologic, and other testing. Assuming that our laboratory is mid-range in the total number of accessions for which diagnoses are made annually, > 250,000 diagnoses and lesion confirmations are likely made each year by ~60 NAHLN laboratories in North America. Hypothetically, in 10 y, > 2.5 M diagnoses or lesions would accrue in the VDL archives. Full implementation of a SVNS in LIMSs for all VDLs would provide exciting opportunities for near-real-time monitoring and regional and national animal health studies, as well as serve as the foundation for spin-off resources such as bio-banking operations.
Work remains to implement a SVNS (based on SNOMED and LOINC) in all AAVLD-accredited VDLs in North America. This can be accomplished with the leadership and approval of the AAVLD Executive Board and the AAVLD Accreditation Committee. A deadline would be set for VDLs to carry out this additional requirement for full accreditation. It is hoped that the NAHLN leadership will work closely with the AAVLD on this initiative, given that the LIMS SVNS will enable expanded messaging of VDL data streams regarding any important animal pathogen to the central repository. The scope of the NAHLN mission could then grow to provide better animal health SA for the United States. Of course, new federal funding would be needed to accomplish the expanded mission.
As noted in the mission statement of the Joint AAVLD USAHA CAHSIS, “Animal Health Surveillance and Information Systems are designed and implemented to solicit, obtain, compile, and manage data on animal health and disease and on factors that influence the health status of animals and animal population. Animal Health Surveillance and Information Systems are to provide information to stakeholders with a need, right and obligation to know in order to take action for the maintenance of animal and public health, control and eradication of disease, well-being of animals, profitability of animal industries and animal owners, and for the National and global good.”
The NAHLN standardized messaging system for 14 select agents is one example of a surveillance system enabling the network to respond to major animal disease outbreaks in respect to these agents. However, the NAHLN cannot currently aggregate and summarize the data from its ~60 laboratories beyond these select agents. At this time, there is no effective means of monitoring the spread of a disease or diseases in animals at the regional or national level similar to what is being done to monitor the spread of COVID-19 in the United States and worldwide. All AAVLD-accredited laboratories should make a firm commitment toward the implementation of a SVNS in their LIMS as part of a new accreditation requirement at the earliest date, to better serve animal health and human health in the spirit of One Health.
Footnotes
Acknowledgements
We thank the leaders and members of the AAVLD Accreditation Committee; Joint AAVLD/USAHA Committee on the NAHLN; AAVLD Epidemiology Committee; AAVLD Informatics Committee; and the Joint AAVLD/USAHA CAHSIS, along with so many other laboratory staff and volunteers working to advance quality and data management in our VDLs in North America and beyond. Thanks to Dr. Hemant Naikare, Director of the Tifton Diagnostic and Investigational Laboratory, Tifton GA for sharing the results of his national AAVLD directors survey regarding LIMS software in use. We combined the 2019 survey with the results of the Kentucky 2020 survey for future use. Thanks to Derrick Miles and Nathan McCurdy of the UK-VDL IT group for their support throughout the preparation of the manuscript.
Declaration of conflicting interests
The authors declared no potential conflicts of interest with respect to the research, authorship, and/or publication of this article.
Funding
The authors received no financial support for the research, authorship, and/or publication of this article.