
Abstract
Fatal sodium intoxication can occur in many species, including cattle, and postmortem confirmation often includes brain sodium concentration determination. Published information regarding brain sodium distribution in cattle was not found in a literature review. Our study was designed to determine whether sodium is uniformly distributed throughout the bovine brain. Eight whole bovine brains were collected from adult cattle with no neurologic signs or history suggestive of sodium intoxication, and with a non-neurologic cause of death diagnosed on gross examination. Brains were divided mid-sagittally. One hemisphere of each brain was homogenized. Subsamples were obtained from the remaining hemisphere (rostral, caudal, and dorsal cerebral cortices; brainstem, thalamus, and cerebellum). Sodium concentrations of regions and homogenates were measured by inductively coupled plasma–mass spectrometry. Data were analyzed using repeated measures ANOVA with a pairwise post-test to compare mean sodium concentration of each region to mean homogenate sodium concentration. Brain sodium was not uniformly distributed; sodium concentrations in different regions of the same brain varied somewhat unpredictably. Homogenization of an entire brain hemisphere appears to be the ideal method of sample preparation to ensure accurate brain sodium concentration measurement in adult cattle.
The balance between sodium and water intake and excretion is necessary to maintain extracellular fluid (ECF) volume and osmolality within a narrow physiologic range. 1 Sodium intoxication or water deprivation is a relatively common cause of hypernatremia in adult cattle. Sustained hypernatremia results in significant ECF shifts across the blood-brain barrier, causing potentially severe neuronal damage, central nervous system dysfunction, and death. 2 Risk of sodium intoxication depends on the rate of sodium intake and the availability of clean, fresh water.
Acute sodium intoxication in cattle has been reported following sudden unrestricted access to salt-containing supplements after a period of deprivation; in calves bottle-fed milk replacer that was mixed incorrectly; and in cattle grazing salt marsh pastures.10,11,15,17 Briny water (>10,000 ppm sodium) can also cause sodium intoxication.6,14 Chronic (indirect) sodium intoxication or water deprivation can occur with insufficient water intake. Causes of limited water intake are many, including frozen water troughs, malfunctioning automatic waterers, and overcrowded or unpalatable water sources. Distance from water sources can also limit intake, especially in weak, sick, or debilitated animals.
Sodium intoxication in cattle affects the gastrointestinal and central nervous systems. Reported clinical signs include diarrhea, anorexia, abdominal pain, excitement, ataxia, tremors, seizures, recumbency, opisthotonus, coma, and death.9,13,16 Although affected animals develop hypernatremia, once fresh water is provided or fluids are administered, serum sodium concentrations can decrease rapidly. 1 Consequently, hypernatremia may no longer be present at the time of sample collection. In cattle dying of sodium intoxication, postmortem lesions are often nonspecific or absent. In some cases, cerebral edema can be present if the animal was provided water or fluids prior to death. 7 Elevated sodium concentrations in ocular fluid can sometimes confirm sodium intoxication, but as with serum, sodium concentrations in ocular fluid decrease rapidly once animals access water. Sodium concentration takes longer to equilibrate in the brain than ocular fluid. 3 Thus, in suspected sodium intoxication cases with normal sodium concentrations in ocular fluid, measurement of brain sodium concentrations can help confirm the diagnosis.
At the University of Kentucky Veterinary Diagnostic Laboratory (UKVDL; Lexington, KY), brain sodium analysis had historically been performed on a randomly collected subsample of non-homogenized brain tissue. This sampling technique assumes uniform distribution of sodium throughout the entire brain. A 2009 study investigated frontal lobe and cerebellar sodium concentrations in horses submitted to a diagnostic laboratory. 5 In that study, mean frontal lobe and cerebellar sodium concentrations were similar, although there was more variation in the cerebellum than the frontal lobe (frontal lobe 1,336 ± 194 ppm; cerebellum 1,395 ± 284 ppm). In a literature review, we found no similar studies in cattle. Our project was designed to determine whether sodium distribution is uniform in the bovine brain, and if not, whether sodium concentration in a specific region accurately represents overall brain sodium concentration.
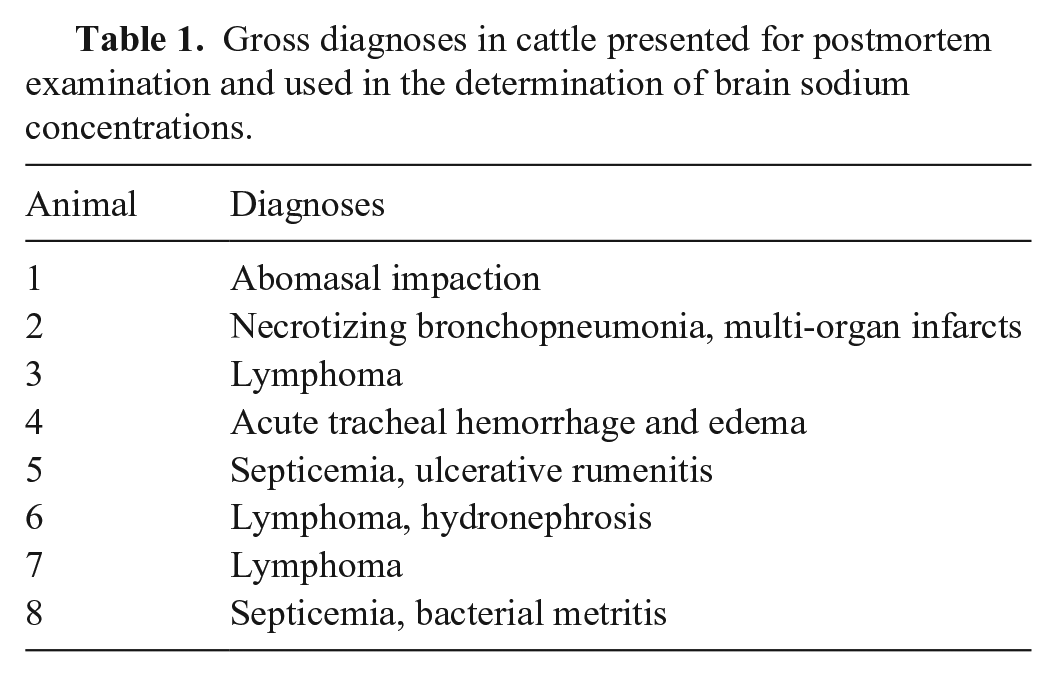
Whole brains were obtained from adult (>1 y old) cattle submitted to UKVDL for postmortem examination. Inclusion criteria included a non-neurologic cause of death diagnosed on gross postmortem examination (Table 1). Cattle were excluded if the history included neurologic clinical signs or if postmortem examination revealed any evidence of central nervous system disease.
Gross diagnoses in cattle presented for postmortem examination and used in the determination of brain sodium concentrations.
We aimed to detect a difference between sodium concentrations of ±20% (300 ppm). Power analysis demonstrated that an n of 8 brains gives the ability to detect this difference with 80% power (StatMate; GraphPad). Brains were divided mid-sagittally during postmortem examination into left and right hemispheres and stored at −20°C. After thawing to room temperature, one hemisphere of each brain was homogenized in a high-speed blender, and 1-g subsamples were obtained from the homogenate as well as 6 regions of the remaining hemisphere. Subsampled regions were rostral-most and caudal-most cerebral cortex; dorsal cerebral cortex at the level of the thalamus; brainstem at the level of the cerebellar peduncles; and thalamus and cerebellum at their approximate centers. Four left hemispheres and 4 right hemispheres were homogenized, and the corresponding hemisphere subsampled as described above.
Sodium concentration was measured with inductively coupled plasma–mass spectrometry (ICP-MS) using a method described previously, adapted to our laboratory, and validated in-house.12,18 Briefly, 1-g subsamples of each section and homogenate were digested with trace metal–grade nitric acid in a microwave digestion system (MARS 6 iWave; CEM). Digests were diluted with distilled deionized water (18 Ω) to 25 g and fortified with internal standard stock solution (Inorganic Ventures). Samples were analyzed via ICP-MS (Thermo Fisher). A bovine liver standard reference material (SRM; National Institute of Standards and Technology, Gaithersburg, MD) was analyzed as a positive control. Digestion reagents treated in the same manner as tissue digests served as negative controls. Results were determined and reported on a wet-weight (ww) basis (Table 2, Fig. 1).
Concentration of brain sodium by anatomic region and homogenate in each animal and overall mean of each anatomic region.
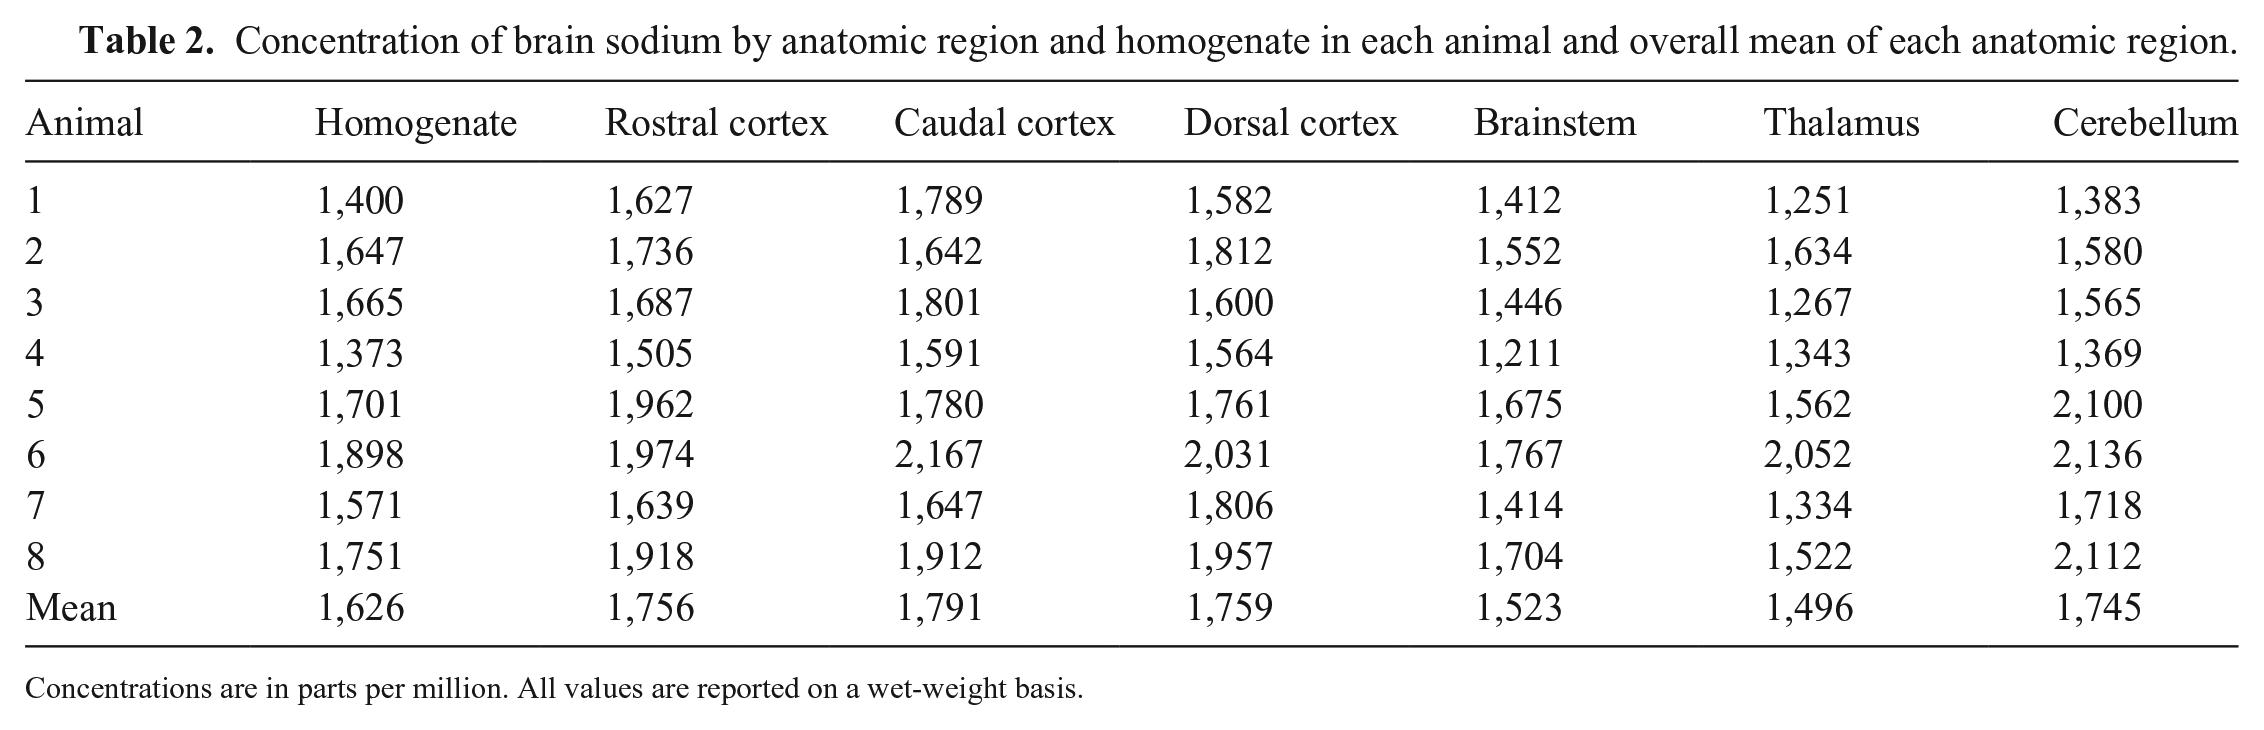
Concentrations are in parts per million. All values are reported on a wet-weight basis.
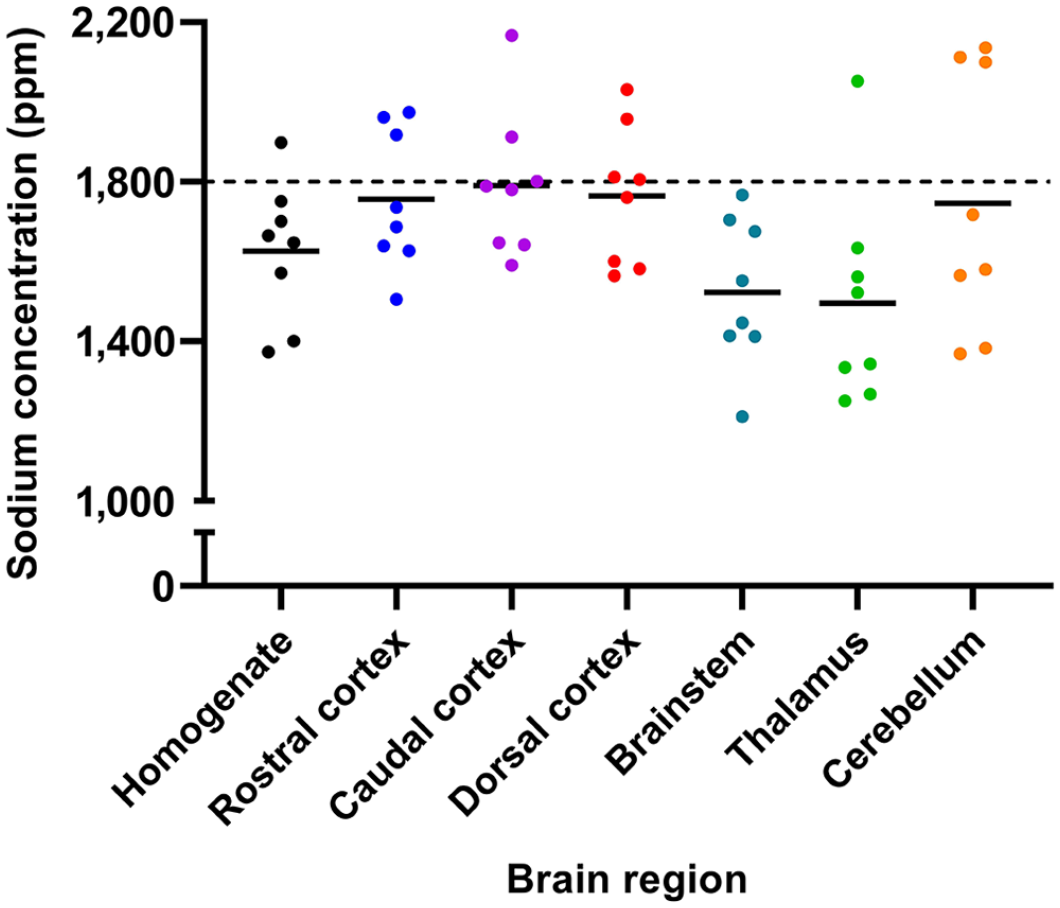
Brain sodium concentration by region and homogenate. All values reported on a wet-weight basis. Bars represent means. Dashed line represents upper end of one published reference range for brain sodium in cattle. ppm = parts per million.
Quality control measures included assessing the calibration curve for linearity and slope, (R = 1 ideal, but R > 0.9998 considered acceptable); confirming sodium concentration of SRM within ±3 SD of validated mean; and confirming sodium concentration of digest blanks below the reporting limit for tissue sodium (30 ppm ww). Accurate measurement of brain sodium concentration in multiple tissue samples required specific instrument conditioning for brain tissue before calibration.
Statistical analyses were conducted (Stata 15.1MP; StataCorp) with 2-sided tests of hypotheses and p ≤ 0.05 as the criterion for statistical significance. All inference statistics were based on a multilevel mixed-effects linear regression model, with random effects set on the level of the animal. Sodium concentration was considered the main outcome variable. Anatomic region (independent categorical variable) was considered as the only fixed effect in the model. To allow for a small departure from normality of the data, we used a robust estimator of the variance.
Brain sodium distribution was not uniform in our study. Moreover, we did not find that the sodium concentration of any particular region was representative of the overall brain sodium concentration. All sections other than cerebellum were significantly different from homogenate (p ≤ 0.05). Furthermore, cerebellum was not significantly different from rostral, dorsal, or caudal cerebral cortex. Thalamus and brainstem were not significantly different from each other (p ≤ 0.05).
Brain sodium concentration varied unpredictably, and sometimes widely, between different anatomic regions within individual animals (Fig. 2). In several animals, sodium concentration varied by as much as 500 ppm (~35%) between regions. For example, in animal 3, the thalamus sodium concentration was 1,267 ppm, but the sodium concentration in the caudal cerebral cortex was 1,801 ppm. Homogenate sodium concentration of that animal was 1,665 ppm. In most of our study animals, thalamus and brainstem sodium concentrations were similar to or lower than homogenate sodium concentration, and cortical sodium concentrations were comparable to or higher than homogenate concentration. Cerebellar sodium concentration appears most variable, with concentrations ranging from 100 ppm below to nearly 400 ppm above homogenate concentrations. Interestingly, despite this variability, mean cerebellar and homogenate sodium concentrations did not differ significantly.
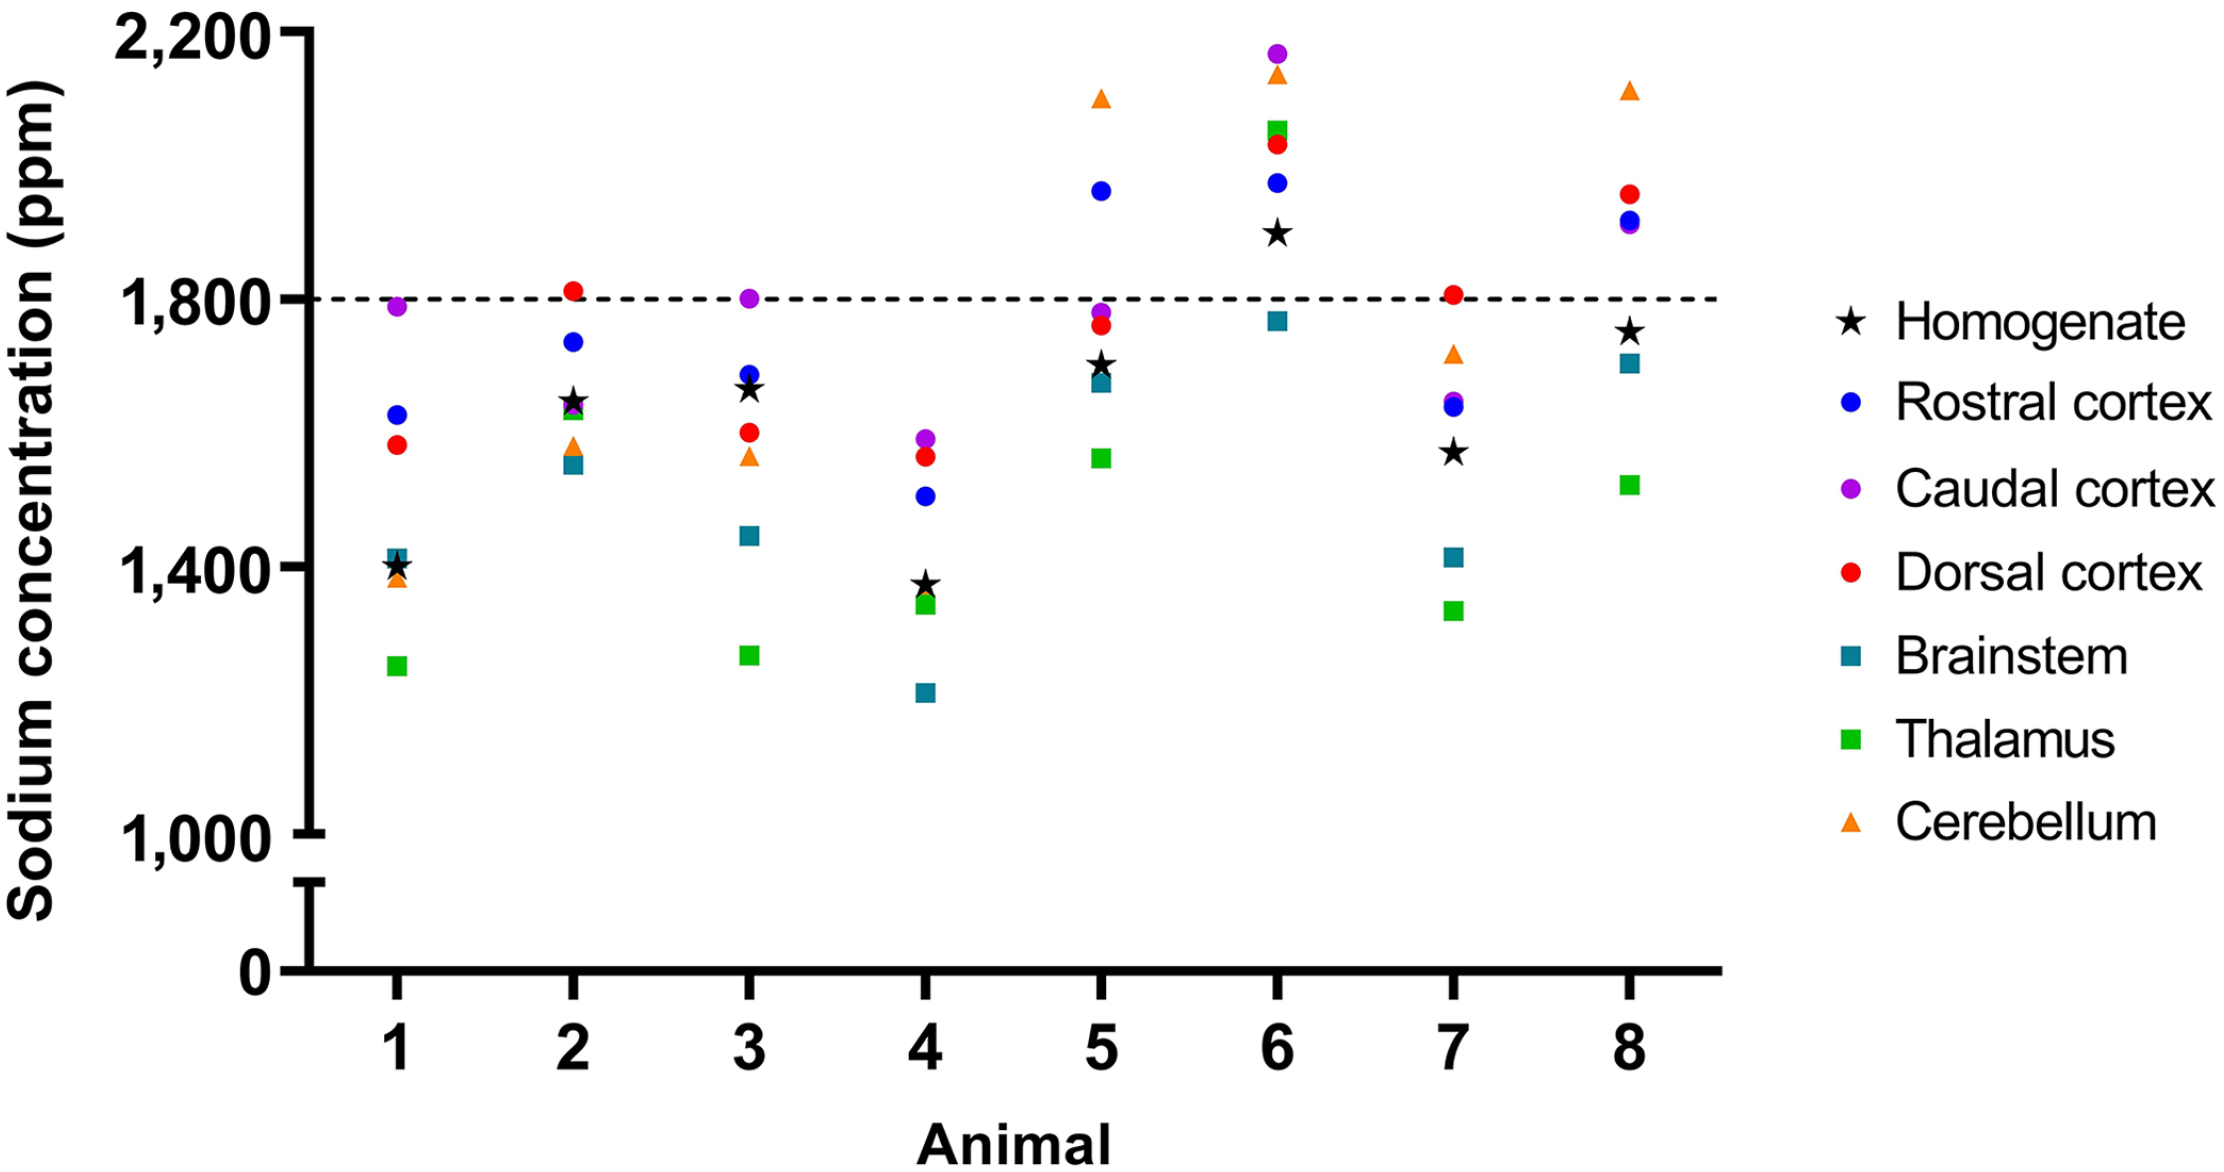
Regional and homogenate brain sodium concentrations by animal. All values are reported on a wet-weight basis. Dashed line represents upper end of one published reference range for brain sodium in cattle. ppm = parts per million.
Interpretation of brain sodium concentration can sometimes be difficult. Published reference ranges vary considerably. In 1986, brain sodium concentrations of healthy cattle were measured at slaughterhouses, and the results suggested that a normal bovine brain sodium concentration range was 800–1,400 ppm ww.4,14 Other sources suggest a normal range of 1,600–1,800 ppm ww. 8 In our study of cattle dying from causes unrelated to sodium intoxication, 3 animals had homogenate sodium concentrations <1,600 ppm ww, and 4 animals had homogenate sodium concentrations of 1,600–1,800 ppm ww. The remaining animal (animal 6) had a homogenate sodium concentration of ~1,900 ppm ww. There are several possible explanations for this result. Animal 6 had hydronephrosis, and one possibility is that the animal was able to compensate for chronic hypernatremia secondary to altered sodium and water elimination without developing neurologic abnormalities. Second, the carcass was in a state of advanced putrefaction, and the elevated brain sodium may have been artifactual, resulting from postmortem fluid losses. Finally, the animal may have developed subtle neurologic abnormalities that went unnoticed by the producer.
Any sick or debilitated animal may become mildly to moderately dehydrated. Therefore, it is not surprising that cattle submitted for postmortem examination at a diagnostic laboratory would have higher average brain sodium concentrations than do healthy animals at slaughter.
Our study provides evidence, that in cattle dying of illnesses unrelated to sodium intoxication, the expected range of brain sodium concentrations likely extends to 1,800 ppm ww. Sodium concentration varied between brain regions. No specific region was representative of overall brain sodium concentration. Therefore, homogenization of an entire hemisphere appears to be the best sample preparation method for brain sodium analysis.
Footnotes
Declaration of conflicting interests
The authors declared no potential conflicts of interest with respect to the research, authorship, and/or publication of this article.
Funding
The authors received no financial support for the research, authorship, and/or publication of this article