
Abstract
Paratuberculosis is a chronic infectious enteritis of ruminants caused by Mycobacterium avium subsp. paratuberculosis (MAP). In sheep, the antemortem detection of the infection is challenging given the slow progression of the disease and the lack of sensitive, specific, and cost-effective validated tests. We adapted an in-house real-time PCR (rtPCR) assay targeting the multi-copy IS900 element of MAP. The sensitivity and specificity of this essay for the detection of MAP infection were estimated in a convenience sample of culled ewes from 7 infected flocks and compared to a commercial fecal rtPCR, a commercial ELISA, and fecal culture. An infected ewe was defined as a ewe with a positive culture of the ileum and/or mesenteric lymph node. A non-infected ewe was defined as a ewe negative in intestinal tissue culture, negative in fecal culture, and with no lesions consistent with paratuberculosis. The in-house rtPCR had a sensitivity estimate of 84% (95% confidence interval [CI]: 59%, 97%) among the 44 infected ewes, which was significantly higher (p ⩽ 0.05) than the sensitivity of a commercial fecal rtPCR (52%, 95% CI: 27%, 76%; or 63%, 95% CI: 35%, 87% depending on the cutoff used), an ELISA (14%, 95% CI:2.0%, 41%), and fecal culture (21%, 95% CI: 2.7%, 59%). No statistical difference in assay specificities was observed for the 30 non-infected ewes. The in-house rtPCR is a promising tool that could be used advantageously for the antemortem detection of MAP infection in sheep.
Keywords
Introduction
Paratuberculosis is a chronic contagious enteritis caused by Mycobacterium avium subsp. paratuberculosis (MAP), and is recognized as an important production-limiting disease of ruminants.5,15,26 Affected sheep usually display weight loss and exercise intolerance, and are eventually culled or die from cachexia. 41 Paratuberculosis is thought to be one of the most costly and prevalent infectious diseases of sheep, although information in that regard is scarce.5,35 In Australia, annual mortality rates of adult sheep associated with paratuberculosis of up to 15% per flock have been reported. 7 Reduced fertility in infected ewes has also been reported. 23 In addition, MAP is suspected to play a role in the development of Crohn’s disease in humans. 36 Considering the current level of evidence regarding the association between MAP and Crohn’s disease, enhancement of on-farm control programs and governmental monitoring are recommended as the most appropriate efforts to mitigate this public health issue. 36
Paratuberculosis is primarily transmitted through ingestion of MAP. Drinking contaminated milk or colostrum, ingestion of infected fecal material present on the teats of ewes, and exposure to a soiled environment or feed contaminated with infected fecal material are considered the most significant routes of transmission. 41 Sheep of all ages can be infected by MAP. However, the risk of developing lesions, shedding MAP in feces, and developing clinical paratuberculosis leading to death is much higher when MAP infection occurs at a young age. 25 This is attributed to a more efficient peripheral immune response induced by MAP infection in adults compared to lambs. 13 To date, there is no treatment available for paratuberculosis. Long-term vaccination was reported to be effective in controlling the disease in sheep flocks. 40 However, to date, no vaccine is approved for use in Canada. Other control strategies are mainly directed toward improved biosecurity and management practices to reduce the risk of MAP introduction in a flock and/or limit the level of transmission within a flock by reducing environmental contamination and exposure of young animals. 8
In sheep, the diagnosis of paratuberculosis is confirmed by the demonstration of typical microscopic lesions combined with the detection of MAP cells or DNA in intestinal tissue. 9 Antemortem detection of MAP infection is more challenging because of the low sensitivity of laboratory tests based on immune response or direct detection of the bacteria, particularly in early stages of infection. 11 In cattle, the gold standard for the antemortem diagnosis of clinical and subclinical paratuberculosis remains fecal culture followed by PCR on isolates targeting the MAP-specific IS900 insertion sequence for confirmation.8,16,34 In sheep, fecal culture, serum antibody ELISA, and fecal PCR, with the latter 2 technologies able to be performed using commercial kits, are available for the detection of MAP infection in live animals. 41 However, the efficacy of culture is limited by the presence of intermittent or very low shedders and by the cost and long turnaround times required to obtain results. This is particularly true for ovine S-type strains for which culture, compared to bovine C-type strains, is more challenging and requires extended incubation periods of several months. 5 ELISA is generally considered to have low sensitivity in sheep, but acceptable specificity.1,24 Fecal PCR offers a rapid and relatively simple option for the antemortem detection of MAP, and is more sensitive than fecal culture in experimentally or naturally infected sheep.4,21,22,29
Our main objective was to adapt and validate an in-house fecal real-time PCR (rtPCR) assay to detect MAP in the feces of a population of naturally infected culled ewes. The performance of this rtPCR assay was estimated and compared to a commercial rtPCR, fecal culture, and serum ELISA for the detection of MAP infection.
Materials and methods
Study design
Our detection accuracy study was designed as a cross-sectional comparison study using a gold standard. The study was reported according to the Standards for Reporting Diagnostic Accuracy guidelines. 6
Selection of ewes, examination, and blood sampling
The source population was defined as culled ewes from commercial sheep flocks located in Quebec, Canada. Between January and May 2012, a convenience set of culled ewes from 7 flocks was sampled. Two flocks (A, B) had a history of paratuberculosis confirmed by autopsy; 4 flocks (C–F) had a history of clinical signs suggestive of paratuberculosis, and 1 flock (G) had no suspicion of the disease. Flock G, a research flock, was a closed flock for more than 15 y, with no case of paratuberculosis ever reported and an absence of clinical signs of wasting apart from very old (>11 y) ewes. All ewes identified for culling by the selected producers at the time of the study were included, up to a maximum of 100 ewes in total, as allowed by our funding. For each ewe, the flock of origin, age, and reason for culling were recorded based on information provided by the producer. The color of the oral mucosa, and body condition, using a scoring system of 1–5 with half scores, in which 1 = emaciated and 5 = fat sheep, 30 were determined on live animals. A blood sample (~7 mL) was collected by jugular venipuncture. Following slaughter at the slaughterhouse or euthanasia at the farm, a postmortem examination was performed to evaluate the amount of abdominal fat. Total carcass condemnation was also noted at the slaughterhouse. All procedures were approved by the Animal Care Committee of the Université de Montréal (certificate 11-Rech-1608).
Tissue and serum collection
The intestinal tract and related lymph nodes were collected, kept on ice, and transported to the diagnostic laboratory of the Faculty of Veterinary Medicine of the Université de Montréal, St-Hyacinthe, Quebec. Within 8 h of collection, the ileum was thoroughly opened, and lymph nodes were transversely sectioned in their middle portion. From the ileocecal valve, a 20-cm segment of the ileum was cut into 4 consecutive 5-cm segments. The first and third segments (i.e., 0–5 cm and 10–15 cm proximal to the ileocecal valve) were fixed for 48–72 h in 10% neutral-buffered formalin for histopathology. The other 2 segments (5–10 cm and 15–20 cm proximal to the valve) were used for culture. The largest ileocecal and mesenteric lymph nodes (MLN) were collected, one of each for histopathology and culture. Feces were collected directly from the terminal colon or rectum. To avoid cross-contamination during tissue collection, 2 polypropylene cutting boards were used alternately. After each intestinal tract sampling, the board was thoroughly washed with a chlorhexidine-based detergent, rinsed, and left to air dry; the clean board was used for the next sample. The prosector (P Hélie) also washed his gloved hands thoroughly with the same detergent between samplings. Within 24 h of collection, the blood samples were centrifuged, and sera were collected. Tissue, feces, and serum samples were stored at −80°C prior to testing.
Histologic examination
Sections of the fixed tissues (ileocecal valve, the 2 ileal segments, and 1 lymph node) were embedded in paraffin, sectioned at 5 μm, and stained with hematoxylin–eosin–phloxine–saffron and Ziehl–Neelsen. All tissues were examined under a light microscope by a board-certified pathologist (P Hélie) who was blinded to the clinical information as well as to the culture, ELISA, and PCR results. A tentative diagnosis of paratuberculosis was made when granulomatous ileitis, ileal lymphangitis, and/or ileocecal lymphadenitis was observed, regardless of the detection of acid-fast bacilli or extent of lesions, with the exception of small focal lesions associated with intra-histiocytic foreign material (e.g., crystals or plant material) that lacked acid-fast bacilli. Lesions were classified as multibacillary or paucibacillary, as described previously. 9
Tissue and fecal culture
Modified Middlebrook 7H10 (MB7H10) and Lowenstein–Jensen (LJ) media were used to grow MAP colonies from tissues and fecal samples. The MB7H10 medium was based on a previous report 38 with slight modifications, and contained (per L): 19.0 g of MB7H10 agar base (BD Difco, Detroit, MI), 1.0 g of casitone, 5.0 mL of glycerol, 100 mL of ADC enrichment (albumin–dextrose–catalase, BD Difco), 200 mL of egg yolk, 2.0 mg of mycobactin J, and antibiotics (amphotericin B 4.0 mg, trimethoprim 3.8 mg, nalidixic acid 8.0 mg, and polymyxin B 6.0 mg). The antibiotic mixture, ADC supplement, egg yolk, and mycobactin J were added after autoclaving the medium base. The LJ medium contained 37.4 g of Lowenstein medium base (BD Difco) in 580 mL of distilled water containing 12.0 mL of glycerol, 20 whole eggs, mycobactin 4.0 mg, and antibiotics (amphotericin B 6.4 mg, trimethoprim 6.08 mg, nalidixic acid 12.8 mg, and polymyxin B 9.6 mg). The Lowenstein medium base was autoclaved before mixing the egg homogenate, antibiotics, and mycobactin. Following thorough mixing of all components, the medium was left to set in a slanting position in a steaming water bath at 80°C for 45 min.
A total of 2.0 g of feces was homogenized in 10 mL of sterile phosphate-buffered saline (PBS, pH 7.8) and mixed with 10 mL of 0.9% hexadecylpyridinium chloride (HPC) for overnight decontamination at room temperature. The next day, the supernatant was carefully removed (~17 mL), and the remaining debris was used for inoculation of the media. Five slants of each medium were inoculated with 100 μL of remaining debris. 32
Pools of tissue samples (2 sections of ileum and 1 lymph node) were processed as described previously. 17 Tissue sections of ~0.5 cm3 were finely chopped with a scalpel and homogenized in 10 mL of sterile PBS. The homogenate was then mixed with 10 mL of 0.9% HPC for overnight decontamination at room temperature. The homogenate was centrifuged at 3,800 × g for 30 min at 4°C. The pellet was resuspended in 1.0 mL of distilled water and placed in a sterile 1.5-mL tube. The mixture was centrifuged again at 6,500 × g for 5 min. The final pellet was resuspended in 500 μL of sterile PBS. Five slants of each medium were inoculated with 100 μL of the PBS solution. All slants (from fecal material and tissues) were incubated at 37°C and screened every other week until the appearance of visible colonies, for a maximum of 36 wk.
A colony PCR targeting the IS1311 element was performed to confirm the identity of the colonies and to classify them as C-type or S-type, as reported previously. 31 Single colonies were picked and homogenized in 10 µL of PCR-grade water and heated at 95°C for 10 min. The homogenate was then transferred to 40 µL of PCR mix consisting of 5 µL of 10× PCR buffer, 200 μM dNTPs, 2.5 mM of MgCl2, 0.6 μM of primers M-56 and M-119, and 2 U of Taq polymerase (Invitrogen, Carlsbad, CA). PCR amplifications were performed under the following conditions: 1 cycle of 3 min at 94°C and 35 cycles of 30 s at 94°C, 15 s at 62°C, and 1 min at 72°C. Amplification reaction was analyzed on an automated instrument (QIAxcel, Qiagen, Valencia, CA). The expected amplicon size was 608 nucleotides. Digestion of the amplicons using restriction enzymes was carried out in a volume of 30 µL, containing 20 µL of IS1311 amplicons, 3 µL of reaction 10× buffer, and 10 U of each endonucleases HinfI and MseI (New England Biolabs, Beverly, MA). Reactions were incubated at 37°C for 2.5 h. Restriction reactions were analyzed using a capillary electrophoresis instrument (QIAxcel, Qiagen). Group typing of strains was performed by interpreting the band patterns following published recommendations. 31
DNA isolation from feces and PCR amplification
An in-house rtPCR assay was designed. First, total DNA was isolated from feces (ZR fecal DNA extraction system, Zymo Research, Irvine, CA) as recommended by the supplier. Second, a TaqMan rtPCR assay targeting the multi-copy IS900 element was adapted from previous work. 19 Primers (IS900-for: 5’-TGCTGATCGCCTTGCTA-3’; IS900-rev: 5’- GGGCCTGATCGGCGATGAT-3’) and probe (IS900-probe: 5’-FAM-CCGGGCAGCGGCTGCTTTATATTC-3’-BHQ1) were commercially synthesized (Integrated DNA Technologies, Coralville, IA). The ABI Fast TaqMan kit (Applied Biosystems, Austin, TX) was used for the rtPCR assays. Reaction mixture contained 12.5 µL of master mix, 300 nM of each primer IS900-for and IS900-rev, 100 nM of probe IS900-probe, and 5.0 µL of fecal DNA in a final volume of 25 µL. Cycling conditions were as follows: initial activation step at 95°C for 10 min followed by 45 cycles of a 2-step PCR consisting of 95°C for 15 s and 62°C for 60 s. Samples were considered positive if the cycle threshold (Ct) value was ⩽38. Positive and negative controls were added in each PCR run.
Samples were also tested using a commercial PCR. A commercial MAP extraction system (Tetracore, Rockville, MD) was used for DNA extraction from feces, as recommended by the supplier. The extracted DNA was amplified using a commercial MAP DNA test kit (Tetracore) that uses a TaqMan assay targeting the MAP-specific region of the single copy hspX gene. Briefly, 5 µL of fecal total DNA was added to 20 µL of master mix. PCR reactions were performed (ViiA 7 rtPCR system, Life Technologies, Grand Island, NY) and included an initial activation step at 95°C for 10 min followed by 45 cycles of a 2-step PCR consisting of 95°C for 15 s and 62°C for 60 s. The cutoff value was set at a Ct ⩽38 as recommended by the manufacturer. Samples that gave a Ct >38 were considered suspect and repeated in triplicate. If at least 2 of the 3 retested replicates gave a Ct value ⩽38, the samples were considered low positive, otherwise they remained suspect. Positive and negative controls were added in each PCR run.
The 2 PCR assays were performed blindly to the clinical status of ewes. Although no formal blinding method to the other assays or culture was implemented, the tests were performed independently and many months apart from culture.
Serum ELISA
Serum ELISA was performed (MAP Ab test kit, IDEXX Laboratories, Westbrook, ME) following the manufacturer’s instructions, except that samples were tested in duplicate to assess inter-assay variability. For each duplicate, the optical density (OD) of serum samples was converted to a sample-to-positive control (S/P) OD ratio using the formula specified by the manufacturer. Species-specific controls (positive and negative) were used to calculate the S/P ratio along with the kit controls. Interpretation was based on the manufacturer’s recommendations (⩽0.60 = negative; >0.6–<0.7 = suspect; ⩾0.70 = positive). The Pearson correlation was used to estimate the variability in S/P ratio between duplicates. The ELISA was performed blindly to the clinical status of ewes. Although no formal blinding method to the other tests was implemented, the ELISA was performed independently and many months apart from culture.
Case definition
The infection status was used as a case definition for assessing test performance. Thus, a MAP-infected ewe was defined as a ewe with a positive MAP culture on intestinal tissue. 28 A non-infected ewe was defined as a ewe negative in tissue culture, negative in histology (i.e., absence of microscopic lesions consistent with paratuberculosis and of acid-fast bacilli in intestinal sections), and negative in fecal culture. The fecal culture test was used to exclude potentially infected ewes that were undetected by tissue culture. Sheep with negative tissue culture results but with positive or contaminated fecal culture results and/or microscopic lesions and/or acid-fast bacteria were considered as inconclusive and were excluded for the estimation of test performance.
Estimation and comparison of test performances
The sensitivity, specificity, positive predictive value, and negative predictive value were estimated for the in-house PCR, and the commercial PCR and ELISA. Only the sensitivity was estimated for fecal culture considering that this assay was used in the definition of non-infected sheep. Sensitivity was estimated as the proportion of animals with a positive test result among MAP-infected sheep according to our case definition. Similarly, specificity was estimated as the proportion of animals with negative test results among those not infected with MAP. Predictive positive (or negative) values were estimated as the proportion of infected (or non-infected) sheep among those with positive (or negative) test results. Confidence limits (95%) were calculated for each estimate, with variance adjusted for potential clustering of sheep originating from the same flock. When estimates were equal to 100%, exact confidence intervals were calculated without taking into account the clustered sampling design.
The sensitivity of the in-house PCR was compared to the 2 other assays (commercial PCR and ELISA) using the exact McNemar chi-square test for paired data, performed exclusively among MAP-infected ewes. In the absence of statistical difference (p > 0.05), the agreement between these pairs of test was evaluated using the kappa coefficient. The same procedures were used to compare test specificity and agreement among non-infected ewes. All analyses were performed in SAS v.9.4 (SAS Institute, Cary, NC).
Results
Selection of ewes
A total of 84 ewes from the 7 flocks were eligible for selection. From these ewes, 2 were excluded because of insufficient fecal content in the intestinal tract, and the last 5 ewes were excluded because of technical issues, resulting in a sample size of 77 ewes (Supplementary Fig. 1). Ewes were sampled at the slaughterhouse (n = 71) or at the farm (n = 6). None of the ewes was lactating and/or pregnant.
Evaluation of ewe status
According to our case definition, 44 ewes from 7 flocks were classified as infected with MAP (Table 1). All of these ewes were culture-positive from ileum (n = 32) and/or MLN (n = 31); in addition, 9 of these ewes were MAP positive in fecal culture (Fig. 1). For 2 of these 44 ewes, the fecal culture status was inconclusive because of microbial overgrowth detected after 15 d of culture. Among these 44 culture-positive ewes, 11 (25%) had isolates recovered exclusively from LJ medium compared to 14 (32%) from MB7H10 medium only and a total of 19 (43%) on both media. The incubation period was 8–24 wk on the MB7H10 medium and 10–28 wk on the LJ medium. Among the 72 positive tissue or fecal samples in culture, 42% had ⩽5 colonies, 44% had 6–10 colonies, and 14% had >10 colonies. Overall, 41 of 44 (93%) culture-positive ewes were infected with S-type strains, whereas C-type strains were detected in 3 sheep (from 2 flocks). Only 7 of the 44 ewes had microscopic lesions consistent with paratuberculosis. Acid-fast bacilli were detected in 3 of these 7 ewes; these 3 ewes had multibacillary lesions and were positive in both MLN and ileum culture. The remaining 4 ewes had paucibacillary lesions; the lesions were positive in MLN (n = 4) and/or ileum (n = 3) culture.
Frequency distribution of ewes according to their characteristics, per Mycobacterium avium subsp. paratuberculosis infection status (n = 77 culled ewes; Quebec, Canada).
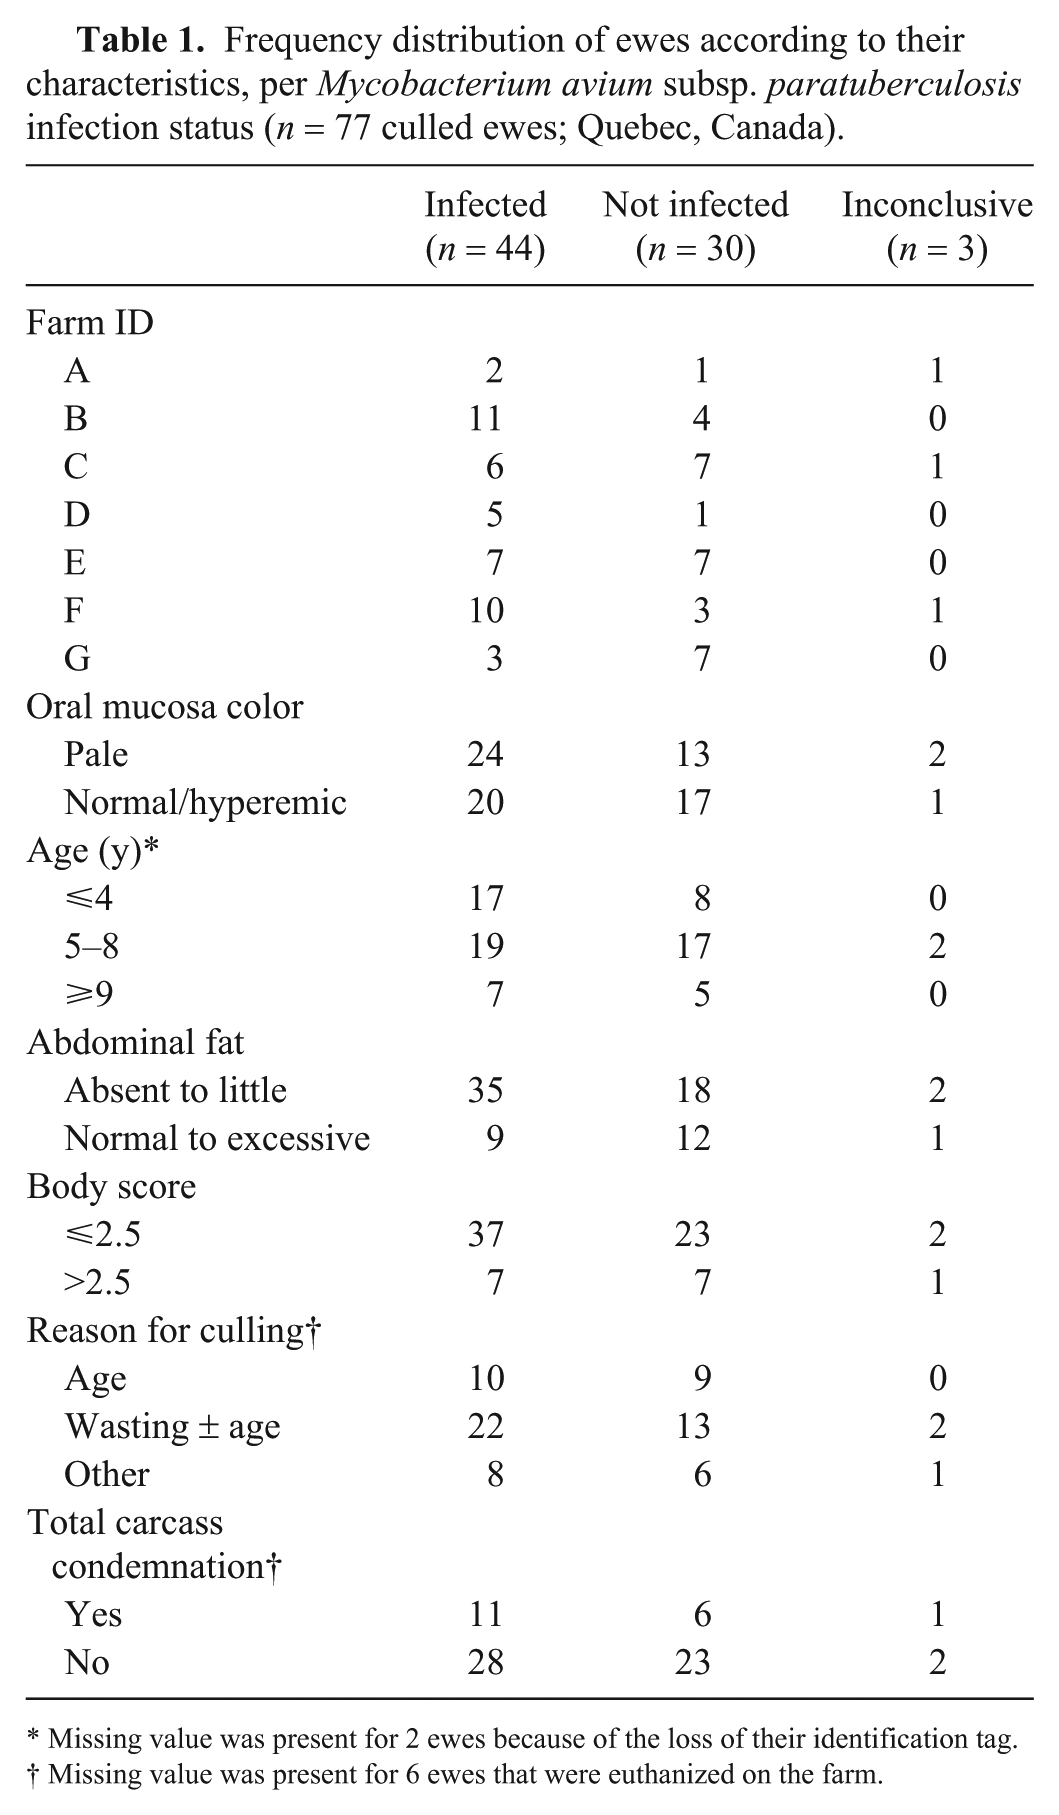
Missing value was present for 2 ewes because of the loss of their identification tag.
Missing value was present for 6 ewes that were euthanized on the farm.
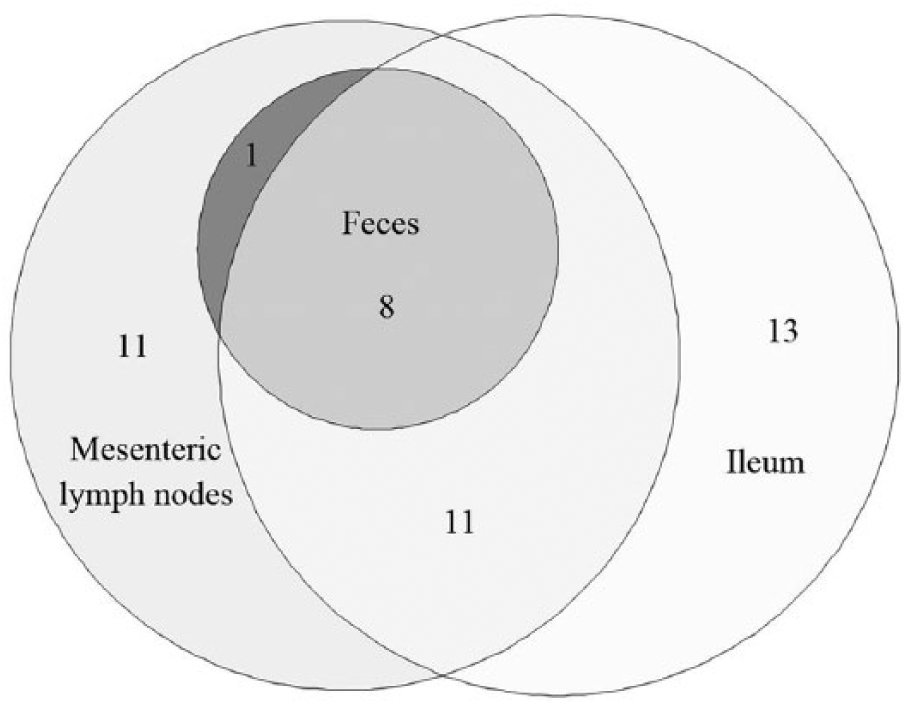
Area-proportional Euler diagram representing the 44 Mycobacterium avium subsp. paratuberculosis–infected ewes according to positive fecal culture (n = 9), positive mesenteric lymph node culture (n = 31), and/or positive ileum culture (n = 32). Two of the 44 ewes had fecal culture with an undetermined result because of microbial overgrowth.
A total of 30 ewes from 7 flocks were considered as non-infected with MAP. All had negative tissue and fecal culture, and no lesion detected. An inconclusive MAP infection status was given to the 3 remaining ewes. All were negative in tissue culture, but one had paucibacillary histologic lesions suggestive of paratuberculosis, one was positive in fecal culture without any lesion, and one had an inconclusive fecal culture status because of microbial overgrowth.
Evaluation of test performance
A flowchart illustrates the results of assays performed in ewes (Supplementary Fig. 1). Ewes with inconclusive MAP infection status (n = 3) were excluded from all subsequent analyses, resulting in a sample size of 74 ewes for evaluating test performance.
For the in-house fecal rtPCR, the proportion of PCR-positive ewes was 53% (39 of 74; Fig. 2). Based on the Ct values, the sensitivity of the in-house rtPCR was estimated at 84% with a specificity of 93%. Overall, the in-house rtPCR correctly classified 88% (65 of 74) of the ewes.
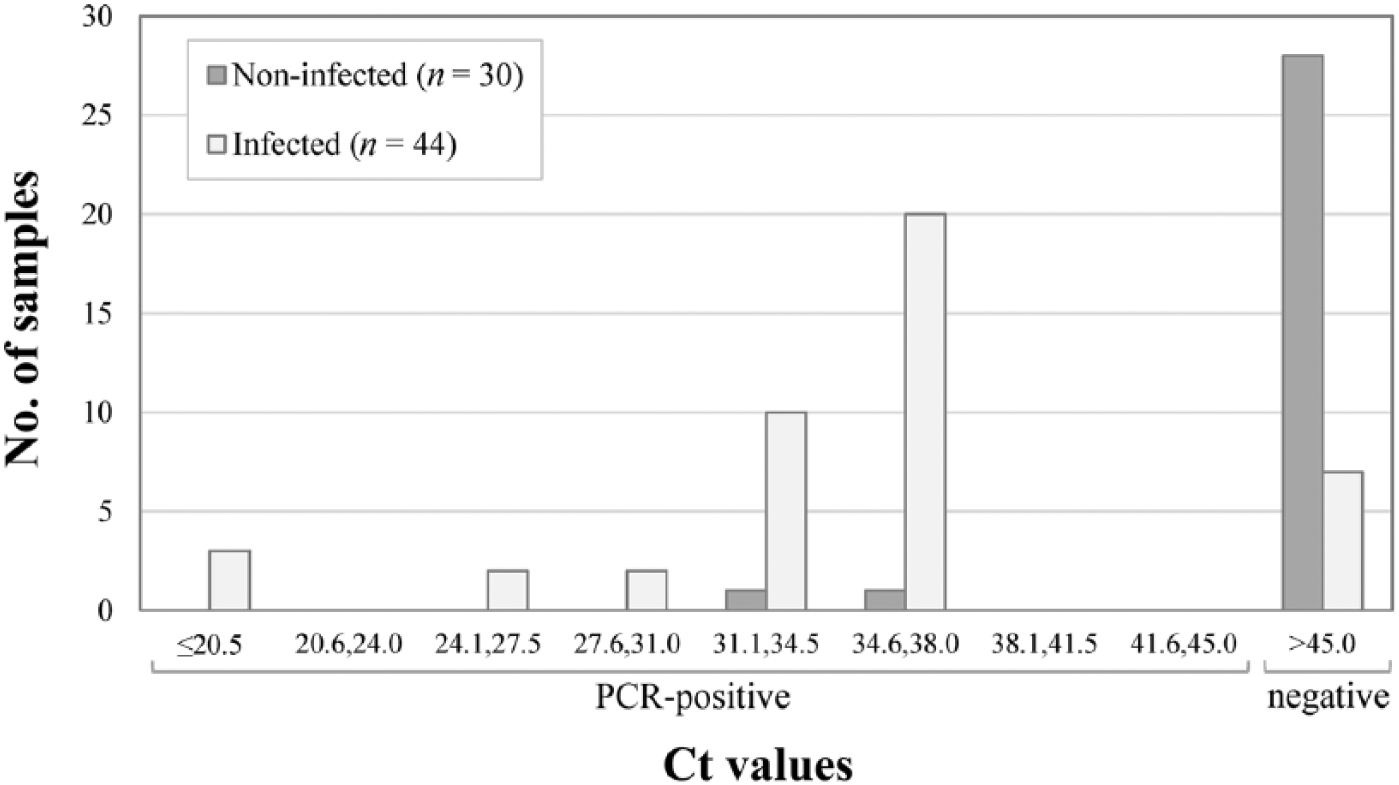
Distribution of fecal samples according to cycle threshold (Ct) value for the in-house real-time PCR assay, per Mycobacterium avium subsp. paratuberculosis infection status (n = 74 ewes).
Regarding the commercial fecal PCR, 34% (25 of 74) of ewes were considered positive, 9% (7 of 74) were suspect, and 57% (42 of 74) were negative. The distribution of Ct values was plotted according to MAP status of the ewes (Fig. 3). The 7 suspect samples were retested in triplicate; one was then classified as low-positive according to Ct values and the others remained as suspects. For the estimation of test performance, 2 scenarios were considered, 1 classifying these suspect samples as positive (commercial 1) and the other (commercial 2) as negative. Thus, depending on the scenario (commercial 1 or 2), a sensitivity estimate of 63% or 52% was obtained for the commercial PCR, with specificities estimated at 87% or 93%, respectively.
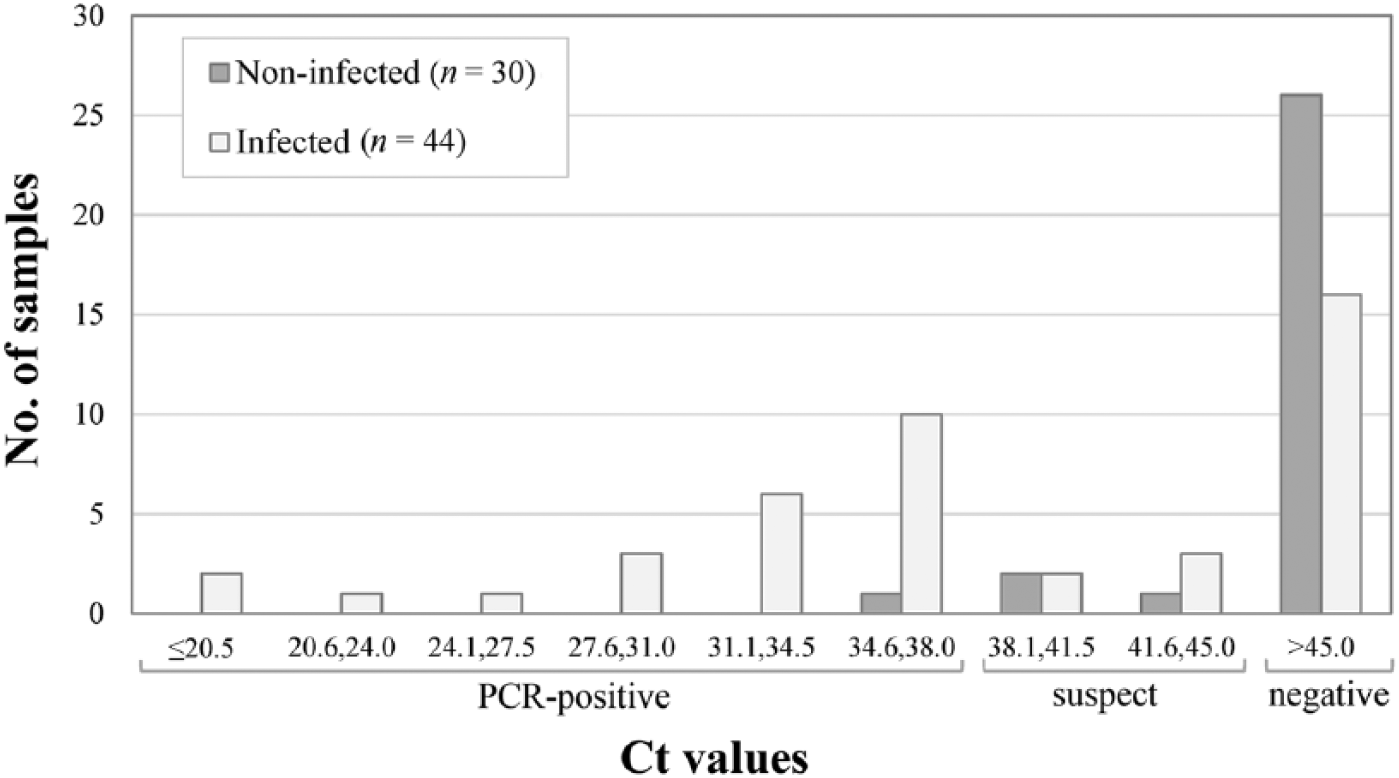
Distribution of fecal samples according to cycle threshold (Ct) value for the commercial real-time PCR assay, per Mycobacterium avium subsp. paratuberculosis infection status (n = 74 ewes).
For the ELISA, a strong correlation was observed between duplicates, with a Pearson correlation coefficient of 99.8% (p < 0.001), an average difference in S/P ratio between duplicates of 0.6%, and no difference in test interpretation between duplicates. Thus, only the first duplicate was considered for evaluation of test performance. The distribution of S/P ratio of samples according to MAP status was plotted (Fig. 4). In general, weak reactions were observed, leading to poor sensitivity (14%) and high specificity (100%). Among the 6 ewes with positive ELISA results, 3 had multibacillary and 1 had paucibacillary lesions.
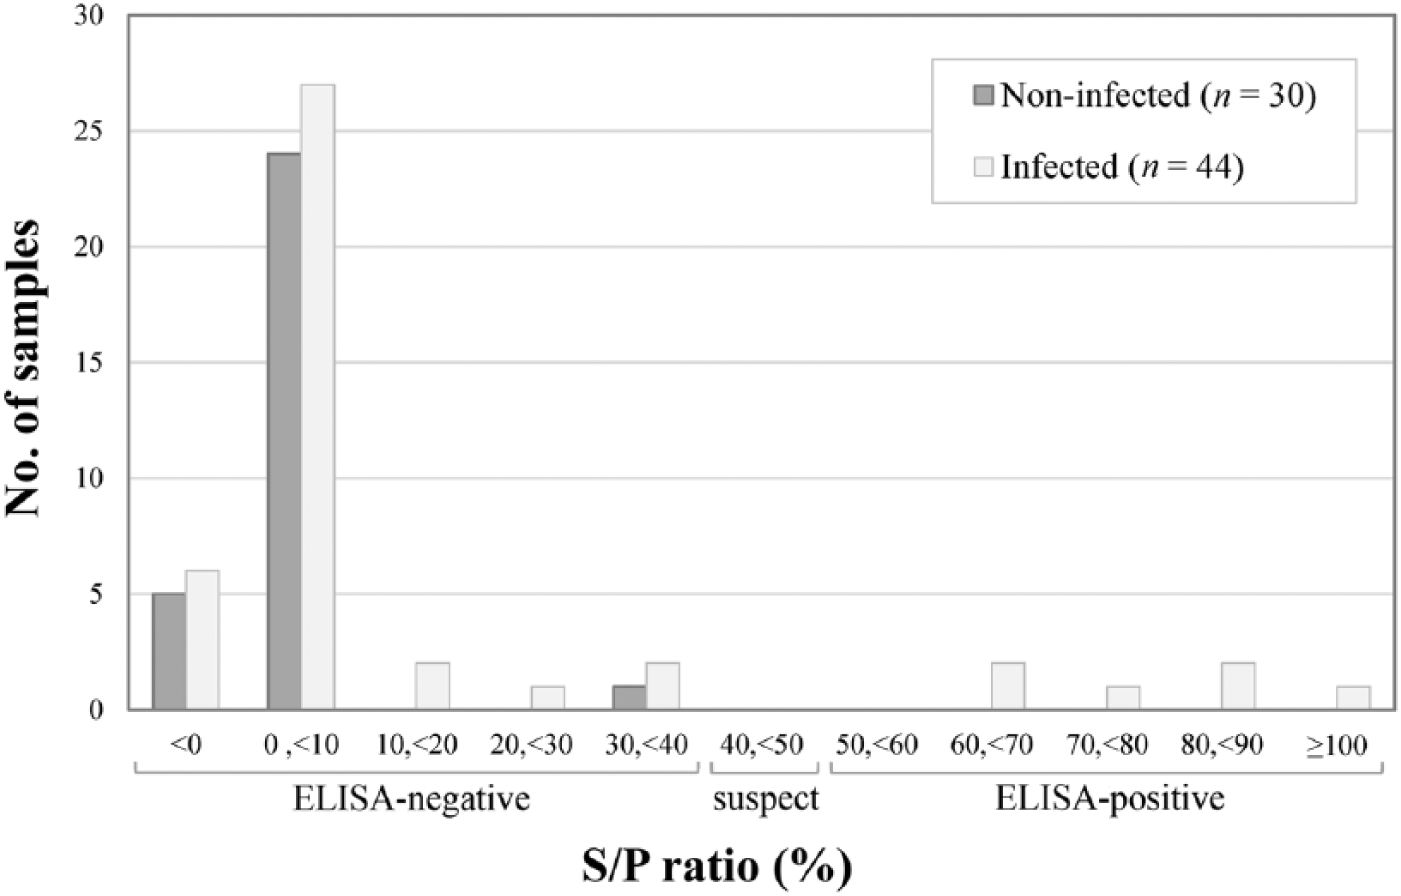
Distribution of sera samples according to the sample-to-positive (S/P) ratio value from the ELISA, per Mycobacterium avium subsp. paratuberculosis infection status (n = 74 ewes).
The sensitivity of fecal culture was estimated to be 21%, with 9 animals positive on fecal culture. Among them, 3 had multibacillary and 2 had paucibacillary lesions. Sensitivity, specificity, and predictive values with 95% confidence intervals were estimated for the 3 assays (Table 2).
Sensitivity, specificity, positive and negative predictive value estimates, and 95% confidence level intervals of various assays for the detection of Mycobacterium avium subsp. paratuberculosis (MAP) infection in 44 infected and 30 non-infected culled ewes in Quebec, Canada.
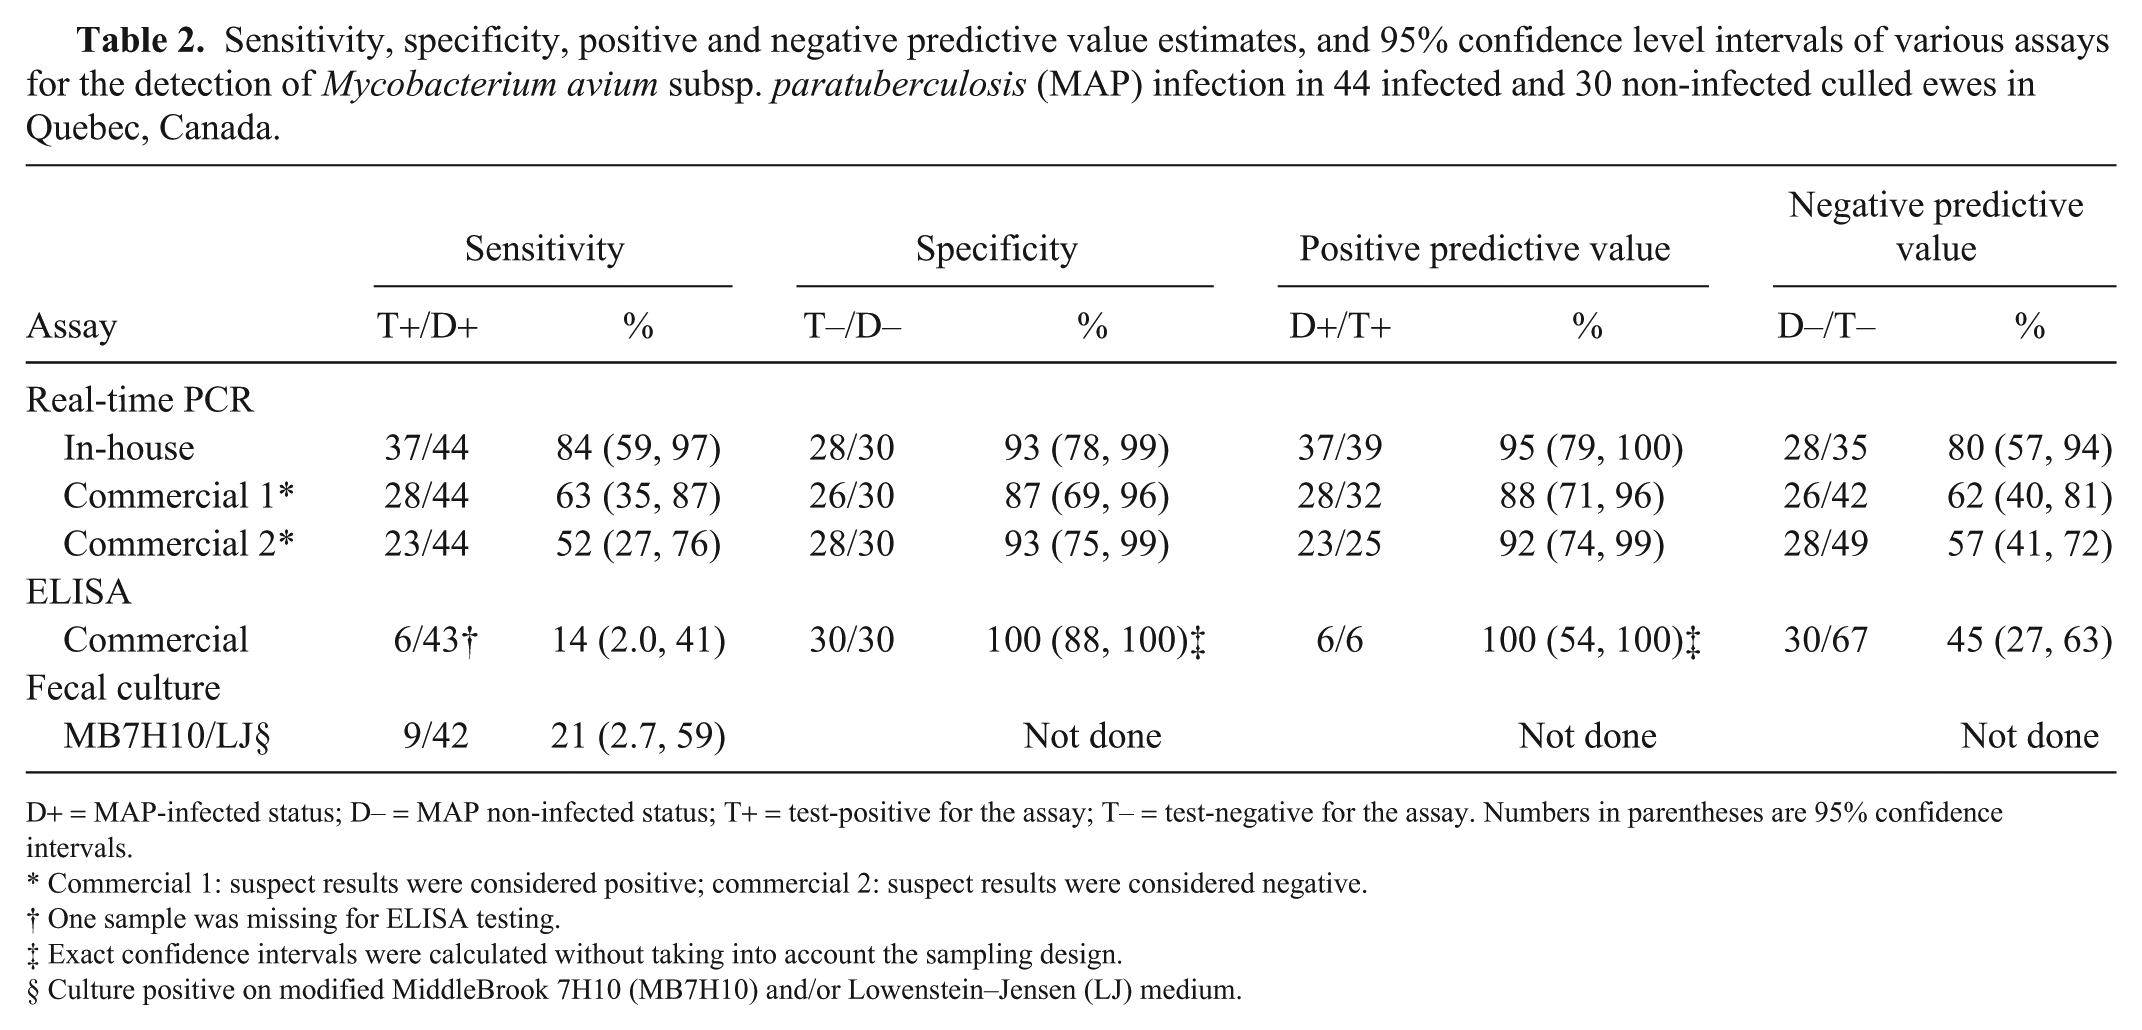
D+ = MAP-infected status; D– = MAP non-infected status; T+ = test-positive for the assay; T– = test-negative for the assay. Numbers in parentheses are 95% confidence intervals.
Commercial 1: suspect results were considered positive; commercial 2: suspect results were considered negative.
One sample was missing for ELISA testing.
Exact confidence intervals were calculated without taking into account the sampling design.
Culture positive on modified MiddleBrook 7H10 (MB7H10) and/or Lowenstein–Jensen (LJ) medium.
Test comparison
The sensitivity of the in-house fecal rtPCR was significantly higher (p < 0.05) than the sensitivity of the commercial fecal rtPCR (regardless of how suspect results were classified), the ELISA, and the fecal culture. Only 2 (or 4 if suspect results were classified as positive) of the 44 MAP-positive ewes were determined to be positive using the commercial rtPCR assay and negative using the in-house rtPCR. Among MAP-positive ewes, all ELISA- and fecal culture–positive samples were also positive using the in-house rtPCR. The Ct values of the 6 ELISA-positive samples were 17.6–35.5 (mean: 24.4) for the in-house rtPCR and 19.9–39.2 (mean: 26.5) for the commercial rtPCR.
No statistically significant differences in specificity estimates were observed between the in-house rtPCR and the commercial rtPCR or ELISA. The agreement between the 2 rtPCR assays (regardless of how suspect results were classified) in MAP-negative animals was low to moderate (kappa: 0.27 and 0.46; Table 3).
Agreement between in-house real-time PCR and 3 other assays for the detection of Mycobacterium avium subsp. paratuberculosis (MAP) infection in 74 culled ewes in Quebec, Canada.
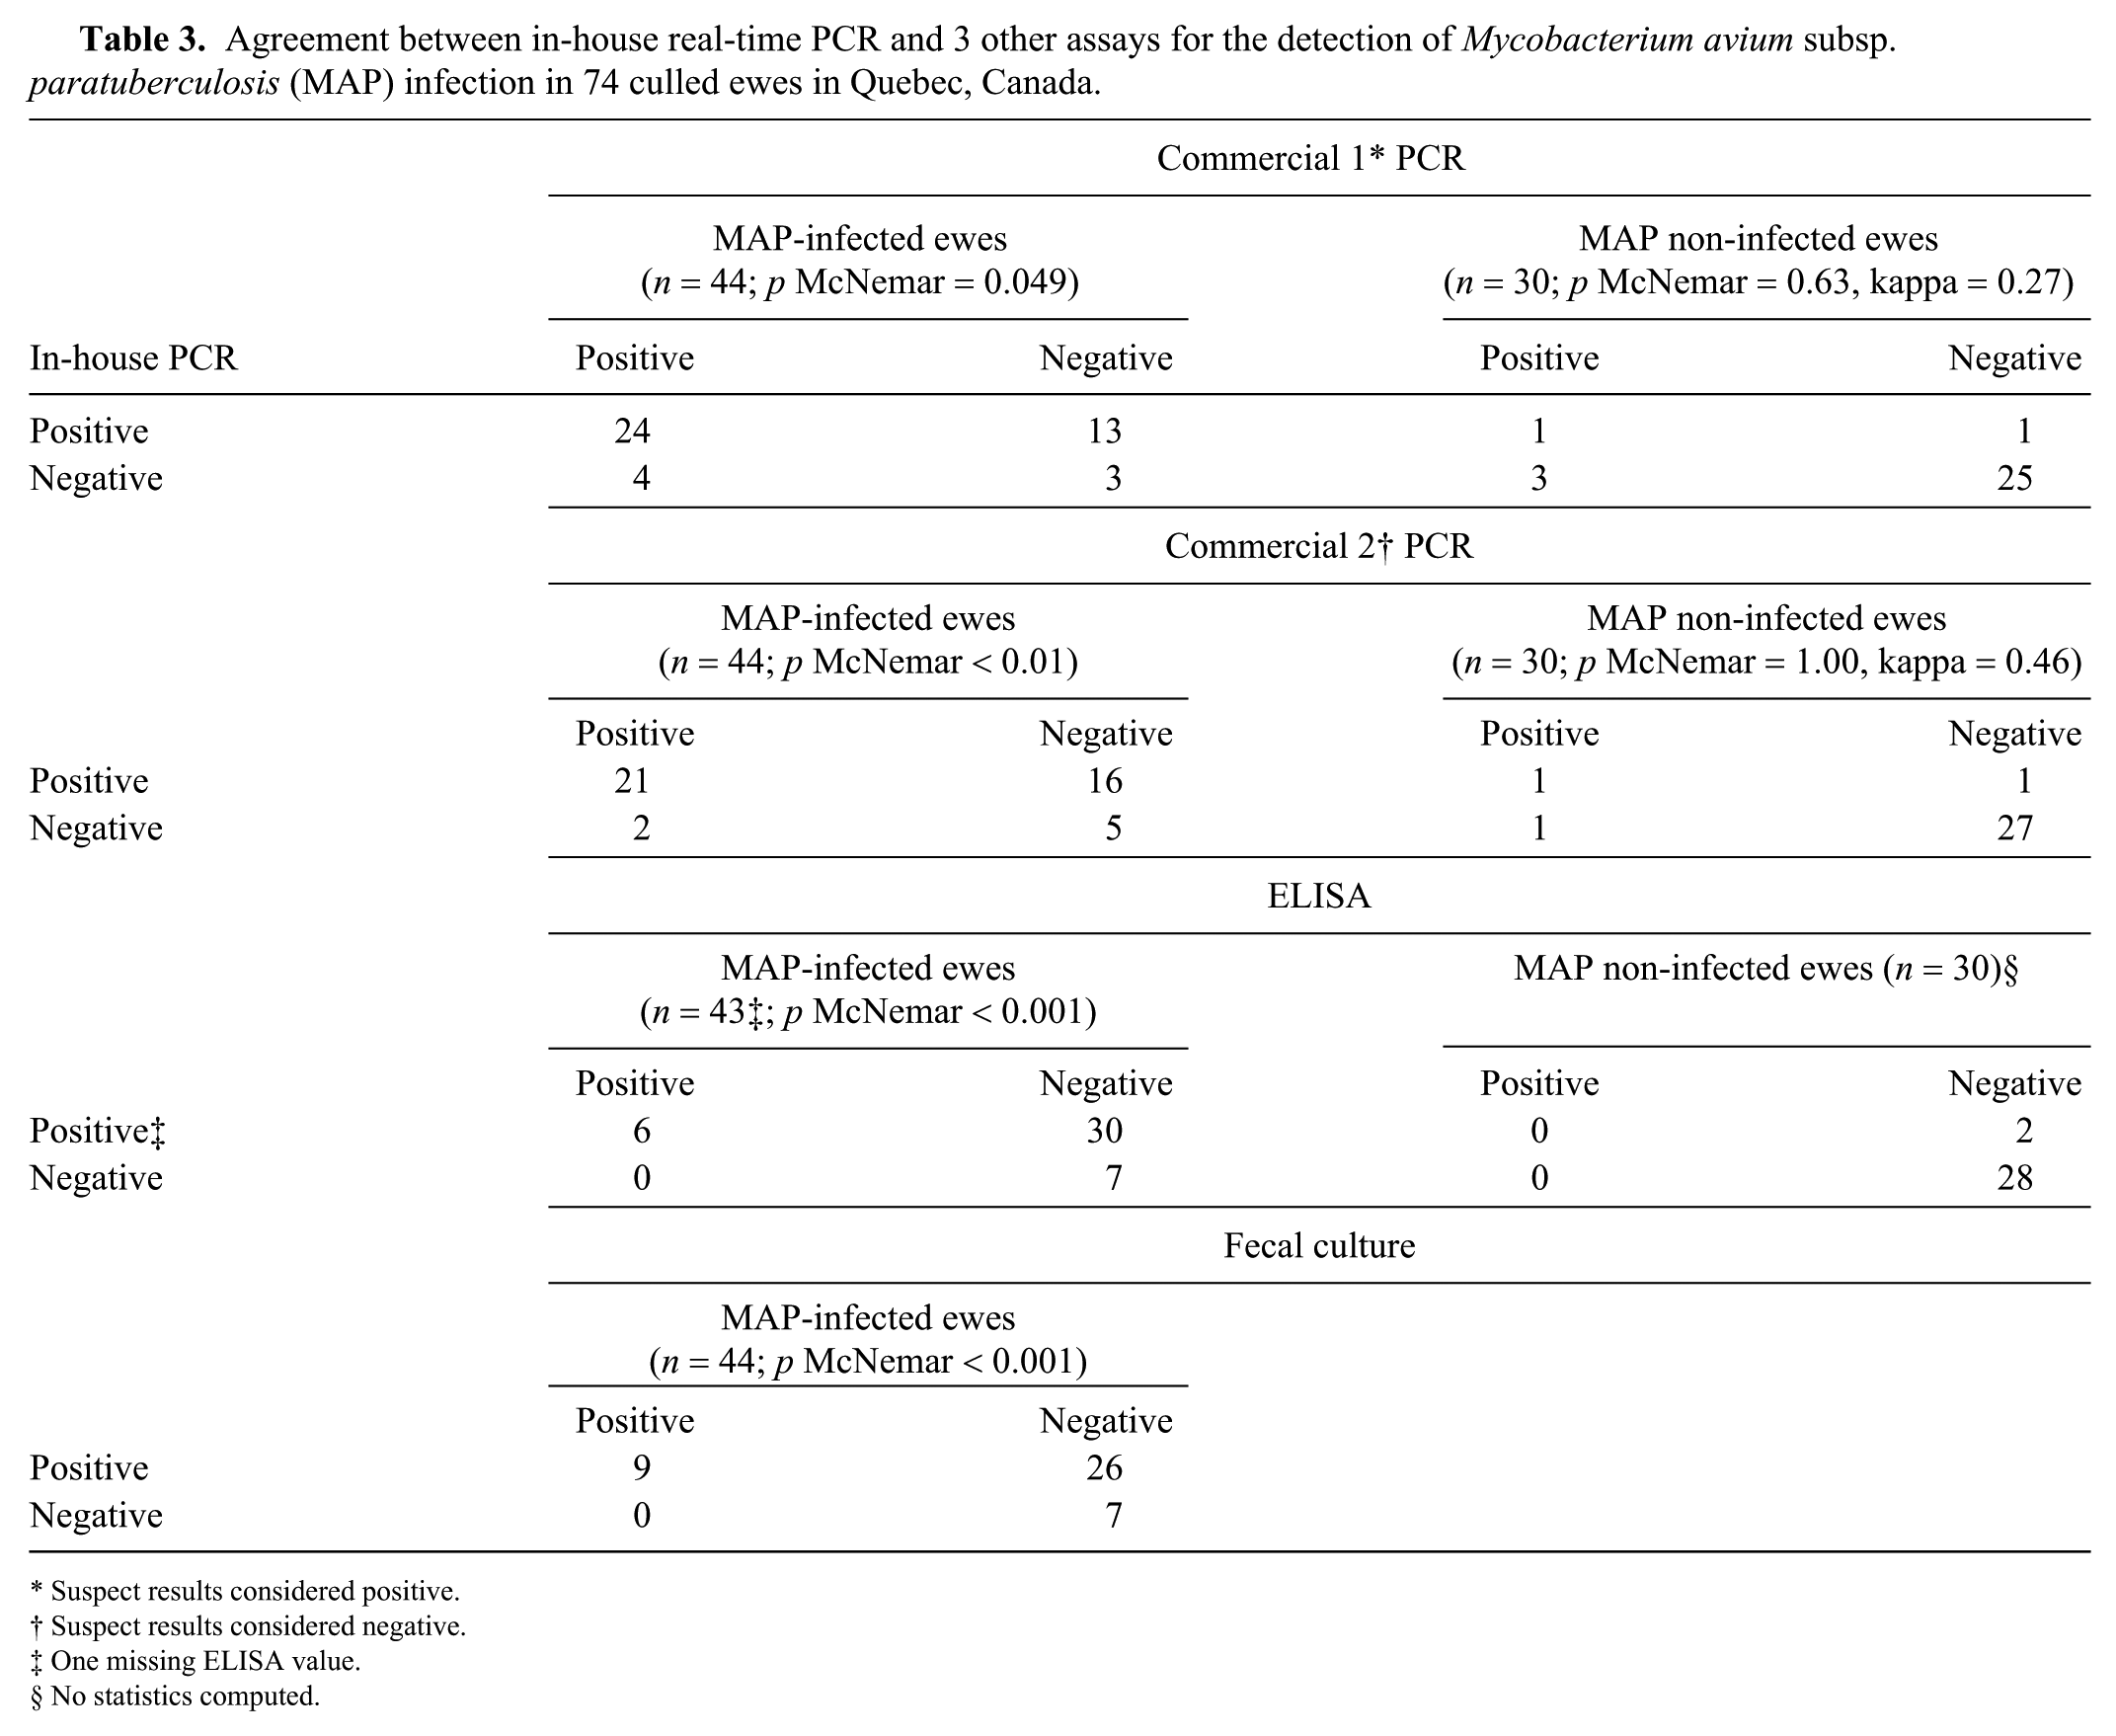
Suspect results considered positive.
Suspect results considered negative.
One missing ELISA value.
No statistics computed.
Discussion
We adapted and then evaluated the performance of an in-house fecal PCR assay for the detection of MAP infection in ewes. A handful of studies have used PCR directly on sheep feces4,21,22,29 or have validated the use of PCR in intestinal tissues and blood for the detection of MAP.18,28 We validated the use of direct PCR on sheep fecal samples compared to the gold standard (tissue culture).
Among all assays evaluated, the in-house fecal rtPCR had the highest sensitivity (84%). The higher sensitivity of the in-house rtPCR compared to the commercial rtPCR could be the result of the presence of 14–20 copies in the MAP genome of the IS900 target used for the in-house rtPCR compared to the single copy of the hspX gene targeted in the commercial rtPCR.14,24 The sensitivity of fecal culture was much lower (21%), which is in agreement with the probable higher analytical sensitivity of the fecal IS900 PCR compared to culture as suggested previously.21,22
It should be noted that fecal PCR will detect potentially infected animals, whereas our case definition was based on infected animals according to tissue culture. The sensitivity of fecal PCR for detecting infected animals will depend on the analytical sensitivity of the PCR, but also on the proportion of infected animals excreting MAP in their feces. In our study, the sampled ewes were relatively old (65% were at least 5 y old) and thin (81% had a body condition score of ⩽2.5), which certainly contributed to a higher sensitivity. The sensitivity of the in-house fecal rtPCR will most likely be lower in younger or healthier sheep populations, which are less likely to excrete the bacteria in detectable amounts. This is supported by 2 studies reporting an estimated sensitivity of 47.5% for a quantitative fecal PCR based on the IS900 gene in 2–3-y-old sheep, 24 and of 42.6% for the same commercial rtPCR used (Tetracore) in dairy sheep at least 2 y old. 4 Consequently, the sensitivity estimates for the in-house rtPCR should only be inferred for populations similar to the one studied herein, which was a group of ewes at least 2 y old and culled for various reasons including advanced age and wasting.
Specificities of 87–93% were observed for the 2 rtPCR assays. Unfortunately, we did not have access to sheep flocks with a MAP-free status from the same geographic area. Consequently, the specificities of the 2 rtPCR assays were likely underestimated considering that all ewes originated from infected flocks. As previously reviewed, this could have led to ewes falsely classified as non-infected as a result of the imperfect sensitivity of tissue culture and histology when performed from a few selected anatomic sites per animal, or from the inclusion of ewes passively shedding the bacteria, especially if flocks were exposed to heavily infected environments. 28 Considering that, for all flocks sampled in our study, 30–83% of selected culled ewes were found to be infected, we can reasonably presume that MAP had been circulating in these flocks for months to years. Moreover, in each flock, ewes selected for culling were generally kept in the same pen prior to sampling, which might have increased passive shedding and thus the risk of having a positive PCR result in a non-infected animal. A lack of specificity given cross-reactivity of the PCR assays with other mycobacterial and non-mycobacterial species is considered unlikely, and thus, most of these PCR-positive sheep should probably be considered as active or passive shedders. In fact, the primers used for the in-house PCR targeting the IS900 insertion sequence were selected for their high specificity in bovine fecal samples. 19 A100% specificity of the IS900 PCR was also reported in formalin-fixed, paraffin-embedded intestinal tissues from sheep 39 and various organs of sheep. 18 Similarly, another study conducted in sheep unexposed to MAP reported an absence of cross-reaction of a real-time quantitative IS900 PCR in fecal samples, which included 51 non-MAP species of mycobacteria of which 10 also contained IS900-like sequences. 22 Finally, a study using latent class modeling has estimated the specificity of a quantitative fecal PCR also based on IS900 sequence detection at 99% in 2–3-y-old sheep. 24 Similarly, in dairy sheep from Ontario, Canada, the specificity of a rtPCR based on the hspX gene, which was used in the commercial PCR, was estimated at 97.8% in a population of ⩾2 y old. 4
We observed low sensitivity (14%) of the ELISA, which is similar to sensitivities of 14–21% previously reported in sheep.20,24 Higher sensitivity of 75–83% has previously been reported in ewes, but this sensitivity evaluation was done on clinically affected sheep with microscopic lesions. 18 In sheep, the sensitivity of the ELISA was reported to be much lower in the presence of the paucibacillary form compared with the multibacillary form. 33 Thus, the absence of multibacillary lesions in most ewes in our study might explain the apparent low sensitivity of the ELISA. Moreover, the sensitivity might have been affected by the age of sampled ewes, given that a decline in antibody response to MAP with age has been reported in cattle. 27
On the other hand, the ELISA was highly specific, as previously reported in sheep.18,20 It should be noted that our estimates of ELISA performance depend on the cutoffs used for interpretation. In dairy cattle, a lower cutoff of ⩾0.25% S/P ratio was suggested as positive for this test. 10 However, in our study, lowering the cutoff to this value would have increased the sensitivity estimate to only 20%, while reducing the specificity.
According to a longitudinal study, ~55% of sheep exposed to MAP are resistant to the infection. 11 This means that the sheep will have a detectable immune response and can shed viable MAP in their feces during early stages of infection, but will eventually clear the infection and will not have intestinal lesions. 12 These animals could be advantageously kept in flocks. However, most of these resistant animals could be classified as positive using the ELISA or fecal culture at some time. This underscores the fact that fecal PCR and ELISA results should be interpreted with great caution in sheep <1 y old. Little is known about the concept of resistance in sheep infected at an older age. However, it is known that older sheep are less susceptible to infection when exposed to MAP. 25
In our study, MAP was detected in tissue culture in 57% of the sampled ewes. All flocks were positive, including the one with no initial suspicion of the disease. This might reflect the difficulty in detecting the disease by producers, probably given the absence of specific clinical signs combined with the slow development of the disease. Interestingly, only 20% of the infected ewes had histologic lesions consistent with paratuberculosis, indicating that prevalence studies based on microscopic lesions alone would likely underestimate the level of infection. Such numbers suggest that the infection could be 5 times more frequent than the 3% prevalence previously reported in culled sheep in the province of Quebec based on microscopic lesions. 3 The low percentage (20%) of infected ewes with lesions also suggests that most of them were subclinically infected, 37 and that other conditions, in addition to paratuberculosis, are likely involved to explain the high frequency of wasting in culled ewes. These reasons were not investigated in our study. However, maedi-visna might be involved considering its high prevalence in the Quebec sheep population. 3 Nonetheless, a previous publication reported that paratuberculosis was the most frequent cause of ewe mortality in sheep flocks in Quebec. 2 Overall, this evidence suggests that the infection is most likely widespread among Quebec sheep.
Based on our results, and considering that transient shedding of MAP in resistant sheep is more likely to be observed in younger animals, using our in-house fecal rtPCR to test adult sheep selected for culling might represent a valuable option to determine flock status. Based on the predictive values estimated herein, which should only be inferred for sheep populations similar to the one studied in terms of MAP prevalence and ewe characteristics, the probability that a culled ewe with a positive fecal in-house PCR assay would be truly infected is estimated at 95%. A lower probability of 80% of not being infected was estimated for a ewe with a negative in-house PCR test result. Future developments could consider the use of this rtPCR to quantify the bacterial load in feces and/or to evaluate its sensitivity for pooled fecal samples used to estimate MAP flock status. This would be valuable to sheep producers and their veterinarians in establishing flock status and selecting control options.
Supplemental Material
DS1_JVDI_10.1177_1040638718810744 – Supplemental material for Validation of an in-house real-time PCR fecal assay and comparison with two commercial assays for the antemortem detection of Mycobacterium avium subsp. paratuberculosis infection in culled sheep
Supplemental material, DS1_JVDI_10.1177_1040638718810744 for Validation of an in-house real-time PCR fecal assay and comparison with two commercial assays for the antemortem detection of Mycobacterium avium subsp. paratuberculosis infection in culled sheep by Julie Arsenault, Jagdip Singh Sohal, Anne Leboeuf, Pierre Hélie, Gilles Fecteau, Yves Robinson and Yvan L’Homme in Journal of Veterinary Diagnostic Investigation
Footnotes
Acknowledgements
We acknowledge the 7 sheep producers and their veterinarians, the inspection staff at the slaughter plant, and Léda Villeneuve from the Center of Expertise in Sheep Production of Quebec (CEPOQ) for their collaboration to the project, as well as Gabrielle Claing and Lauriane Duplaix for bibliographic review.
Declaration of conflicting interests
The authors declared no potential conflicts of interest with respect to the research, authorship, and/or publication of this article.
Funding
This project was financed by the Canadian Agricultural Adaptation Program (CAAP) of Agriculture Canada.
References
Supplementary Material
Please find the following supplemental material available below.
For Open Access articles published under a Creative Commons License, all supplemental material carries the same license as the article it is associated with.
For non-Open Access articles published, all supplemental material carries a non-exclusive license, and permission requests for re-use of supplemental material or any part of supplemental material shall be sent directly to the copyright owner as specified in the copyright notice associated with the article.