
Abstract
Staphylococcus aureus encompasses 2 subspecies (aureus and anaerobius) with significant differences in their epidemiology and pathogenicity. We evaluated the suitability of matrix-assisted laser desorption/ionization time-of-flight mass spectrometry (MALDI-TOF MS) for the rapid identification of both subspecies using a panel of 52 S. aureus isolates (30 subsp. anaerobius and 22 subsp. aureus) recovered from different origins, countries, and years. The on-board library identification system correctly identified 42 of 52 (81%) S. aureus isolates at the species level with score values >2.0. Limited performance was observed for differentiation of S. aureus subspecies (particularly subsp. anaerobius). Visual inspection of MALDI-TOF MS profiles identified 5 subspecies-specific mass peaks (m/z 3430 and 6861 in S. aureus subsp. anaerobius, and m/z 4046, 6890, and 8093 in S. aureus subsp. aureus) with 100% sensitivity and specificity values, which is potentially useful for differentiating these subspecies. The suitability of 3 models, Genetic Analysis (GA), Quick Classifier (QC), and Supervised Neural Network, for automatic identification of both subspecies was evaluated using the Recognition Capability (RC) and Cross Validation (CV) values provided by the on-board ClinProTools software. The GA and QC models reached RC and CV values of 100%. Both models were externally validated using a panel of 26 S. aureus isolates of both subspecies, with both models correctly classifying all isolates of both subspecies. MALDI-TOF MS coupled with ClinProTools software represents a rapid and simple approach for S. aureus subspecies discrimination.
Keywords
Introduction
Staphylococcus aureus, a well-known commensal and pathogen of humans and a large number of animal species, is comprised of 2 subspecies: aureus and anaerobius. 8 S. aureus subsp. aureus is a major human pathogen responsible for superficial skin and soft tissue infections as well as potentially life-threatening invasive conditions such as bacteremia, pneumonia, endocarditis, or osteomyelitis. 4 In addition, S. aureus subsp. aureus is an important food-borne pathogen that produces a number of different enterotoxins. 15 In animals, S. aureus subsp. aureus is responsible of a wide variety of conditions, such as mastitis, arthritis, and septicemia.13,17 S. aureus subsp. anaerobius has been traditionally designated as the etiologic agent of subcutaneous abscesses (Morel disease) in small ruminants, particularly in young animals. 8
Several PCR techniques have been developed for S. aureus identification (at species level), but to our knowledge no molecular tools are currently available for S. aureus subspecies differentiation, although the need for a molecular method for improved specific identification of S. aureus subsp. anaerobius has been identified. 12 Traditionally, the subspecies can be easily differentiated by the production of the enzyme catalase (S. aureus subsp. aureus and S. aureus subsp. anaerobius are considered catalase-positive and -negative, respectively). However, since 2002, reports of catalase-negative S. aureus subsp. aureus associated with a variety of clinical processes in humans have ocurred,2,9,31,33 which limits the significance of this biochemical trait for differentiating these subspecies.
Matrix-assisted laser desorption/ionization time-of-flight mass spectrometry (MALDI-TOF MS) has revolutionized the identification of bacteria in clinical microbiology laboratories given the simplicity and robustness of the methodology.26,27, 32 Different studies have demonstrated the accuracy of MALDI-TOF MS for the identification of S. aureus.10,11,14,28 However, to our knowledge, no study has explored the suitability of MALDI-TOF MS for differentiating the subspecies of S. aureus, even though this technique has proved to be a rapid and accurate method for subspecies identification of other bacterial pathogens.18,21,25 In this context, MALDI-TOF MS could be a rapid and simple tool to discriminate between the subspecies of S. aureus. Therefore, we evaluated the suitability of MALDI Biotyper software (which includes 1 entry for S. aureus subsp. anaerobius and 13 for S. aureus subsp. aureus) to differentiate S. aureus isolates at the subspecies level and explored other software aimed at identifying specific differential peaks that could be used for the rapid identification of isolates of subspecies aureus and anaerobius.
Material and methods
Bacterial isolates and culture conditions
We used a working collection of S. aureus isolates (n = 52) of both subspecies. Isolates of subsp. aureus (n = 22) were recovered in Spain between 2004 and 2011 from different hosts and clinical conditions. The subsp. anaerobius isolates (n = 26) were recovered in 1981–2015 from subcutaneous abscesses in small ruminants from 6 countries (Table 1). The isolates were identified at the subspecies level based on classical phenotypic tests (aerobic growth; clumping factor; nitrate reduction; catalase test; pigment production; Voges–Proskauer test; acid production from trehalose, mannose, and galactose). 8 Additionally, 3 aerotolerant mutants 7 and 1 catalase-positive mutant of S. aureus subspecies anaerobius 6 were also included in the study (Table 1). Isolates were cultured on brain–heart infusion broth and incubated for 24 h at 37°C in aerobic (subsp. aureus) or anaerobic (subsp. anaerobius) conditions. Isolates were divided into 2 groups. Group 1 (n = 26; 9 isolates of S. aureus subsp. aureus and 17 of S. aureus subsp. anaerobius) was used for the visual inspection of spectra and the construction of models for the automatic classification of subspecies isolates of S. aureus. Group 2 (n = 26; 13 isolates of S. aureus subsp. aureus and 13 of S. aureus subsp. anaerobius) was used to confirm the subspecies-differential ions detected using the group 1 isolates and for the external validation of the constructed models.
Details of the 52 Staphylococcus aureus isolates (30 S. aureus subsp. anaerobius and 22 S. aureus subsp. aureus) included in the present study and the results of the characteristic peak masses (mass/charge, m/z) used for the differentiation of both S. aureus subspecies (aureus and anaerobius) by matrix-assisted laser desorption/ionization time-of-flight mass spectrometry.
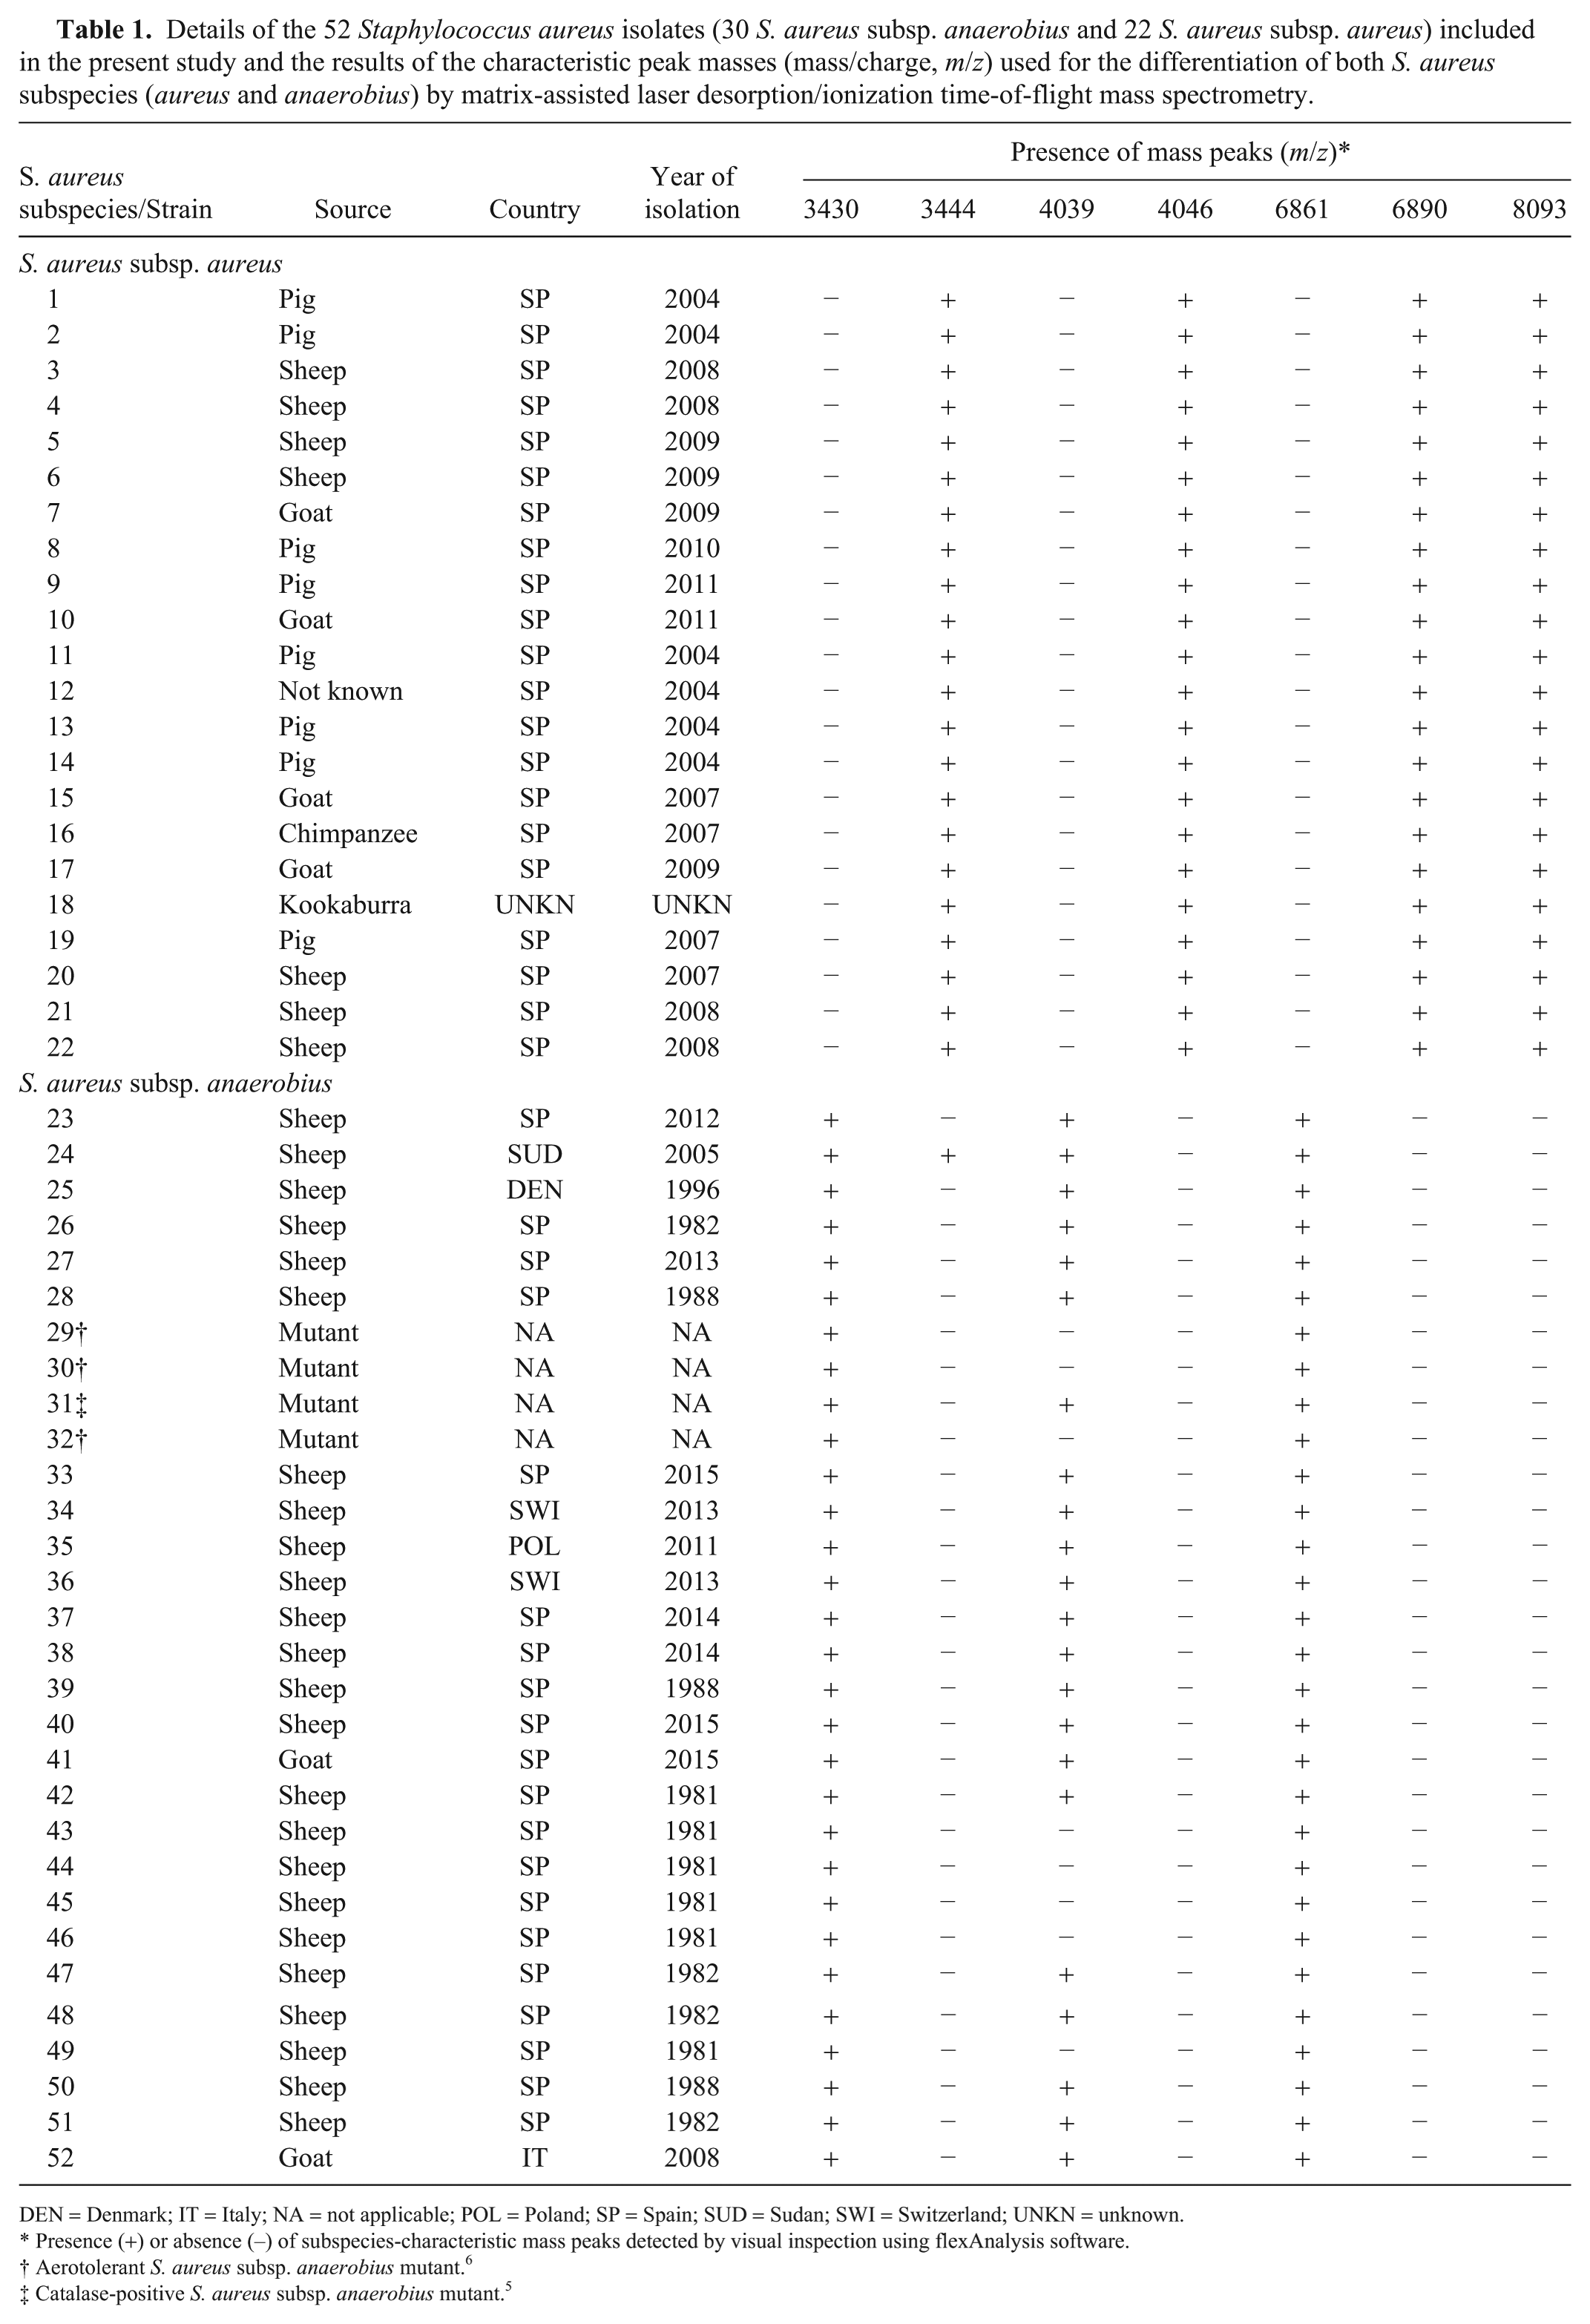
DEN = Denmark; IT = Italy; NA = not applicable; POL = Poland; SP = Spain; SUD = Sudan; SWI = Switzerland; UNKN = unknown.
Presence (+) or absence (–) of subspecies-characteristic mass peaks detected by visual inspection using flexAnalysis software.
Aerotolerant S. aureus subsp. anaerobius mutant. 6
Catalase-positive S. aureus subsp. anaerobius mutant. 5
Sample preparation and MALDI TOF MS spectra acquisition
To obtain MALDI-TOF MS profiles, all isolates were subjected to a protein–peptide extraction protocol based on formic acid–acetonitrile (Bruker Daltonik, Bremen, Germany). A 1-mL aliquot of extracted proteins and peptides was spotted in 3 different locations on the 384 MALDI plate. Afterwards, 1 mL of matrix (10 mg/mL of α-cyano-4-hydroxycinnamic acid) re-suspended in the standard solvent (50% acetonitrile, 2.5% trifluoroacetic acid; Millipore Sigma, St. Louis, MO) was added to each of these spots, allowing co-crystallization before spectra acquisition. Spectra acquisition was performed for each spot in a single run obtaining 3 spectra per sample using an ultrafleXtreme device (Bruker Daltonik) in the linear and positive mode within a mass range of 2–20 kDa. Each spectrum was acquired using the flexControl software (v.3.4) in an automatic mode and externally calibrated using the Bacterial Test Standard (Bruker Daltonik). A peak shift of 500 ppm was accepted.
MALDI TOF MS identification using MALDI Biotyper software
Identification of all 52 isolates was performed by the MALDI Biotyper Real Time Classification software (which included 190 reference entries of staphylococci among the 5,989 entries in the Bruker Daltonik database). The MALDI Biotyper software generated a score value–based ranking list of the 10 best identification matches. For interpretation of the identification results, 2 variables were considered 22 : 1) score values following the MALDI-TOF MS Biotyper Compass (⩾2.000 = identification at species level with high confidence; 1.999–1.800 = identification with low confidence; ⩽1.799 = non-reliable identification), and 2) consistency ranking list of the first 2 best matches (A = the correct subspecies is the unique subspecies with a score value ⩾2.000; B = the correct subspecies is first ranked but the other subspecies in the second rank also gave a score value ⩾2.000; C = first and second matches have score values ⩾2.000 but the correct species is second ranked; D = first and second matches have score values <2.000 [correct genus identification]).
flexAnalysis software: visual inspection
Visual inspection of all spectra belonging to group 1 was performed using flexAnalysis software (v.3.4, Bruker Daltonik; after smoothing, normalization, baseline subtraction, and peak picking) to detect subspecies-specific ions. Sensitivity and specificity values were calculated for each potential subspecies-specific mass peak.
ClinProTools software: visual inspection, model construction, and validation
ClinProTools (on-board software provided by Bruker Daltonik) provides an alternative for data management of MALDI TOF MS spectra for recognition of potential biomarkers. This software allows the construction of models for automatic classification based on differences in the spectra. This program also supports the visual inspection of larger cohorts of spectra, facilitating the detection of peaks discriminating between the evaluated spectra groups. The model construction was performed as described, 23 except that only previously identified subspecies-specific ions that showed 100% sensitivity and specificity were considered for model construction using the Add peak command of ClinProTools. Three different algorithms were evaluated for the construction of the classification model: Genetic Algorithm (GA), Supervised Neural Network (SNN), and Quick Classifier (QC). GA allows the user to define the number of peaks used for model generation, whereas this option is not available in QC and SNN, and the number of peaks is automatically assigned by the program. The 3 models were generated using the spectra of group 1 (26 isolates, 3 spectra/isolate). The GA, QC, and SNN models were evaluated according to 2 parameters: Recognition Capability (RC; which depends on the number of model generation spectra correctly classified evaluating the same spectra used to construct the model) and Cross Validation (CV; which depends on the ability of the model to classify a subset of spectra by the model constructed using the remaining spectra). Finally, to assess the diagnostic performance of the model(s) that showed the best RC and CV values, the group 2 isolates were used for external validation.
Results
MALDI-TOF MS identification at species- and subspecies-level
Using the MALDI Biotyper software, most of the S. aureus isolates (42 of 52, 81%) were correctly identified at species level with score values >2.0. Ten of 52 isolates (19%) were classified as S. aureus with low confidence (1.900–1.998), all of them belonging to subspecies anaerobius (Table 2). All other Staphylococcus species included in the Bruker MALDI Biotyper database gave score values <2.000. Overall, isolates of S. aureus subsp. aureus gave score values (average: 2.506; range: 2.394–2.620) quite similar to those exhibited by S. aureus subsp. anaerobius (average: 2.094; range: 1.900–2.352; Table 2). Considering scores values of the first and second identification options, all isolates of S. aureus subsp. aureus were correctly identified at subspecies level with consistency identification category A (Table 2). Only 3 of 30 (10%) S. aureus subsp. anaerobius isolates were correctly identified (consistency A) at the subspecies level. S. aureus subsp. anaerobius isolates were identified with low confidence level (~43%, consistency identification categories B) and 10 isolates had D consistency. Three isolates exhibited consistency identification category C or were non-categorized, being misidentified with S. aureus subsp. aureus (Table 2).
MALDI-TOF MS Biotyper identification results of the 52 Staphylococcus aureus isolates (30 S. aureus subsp. anaerobius and 22 S. aureus subsp. aureus) included in the present study.
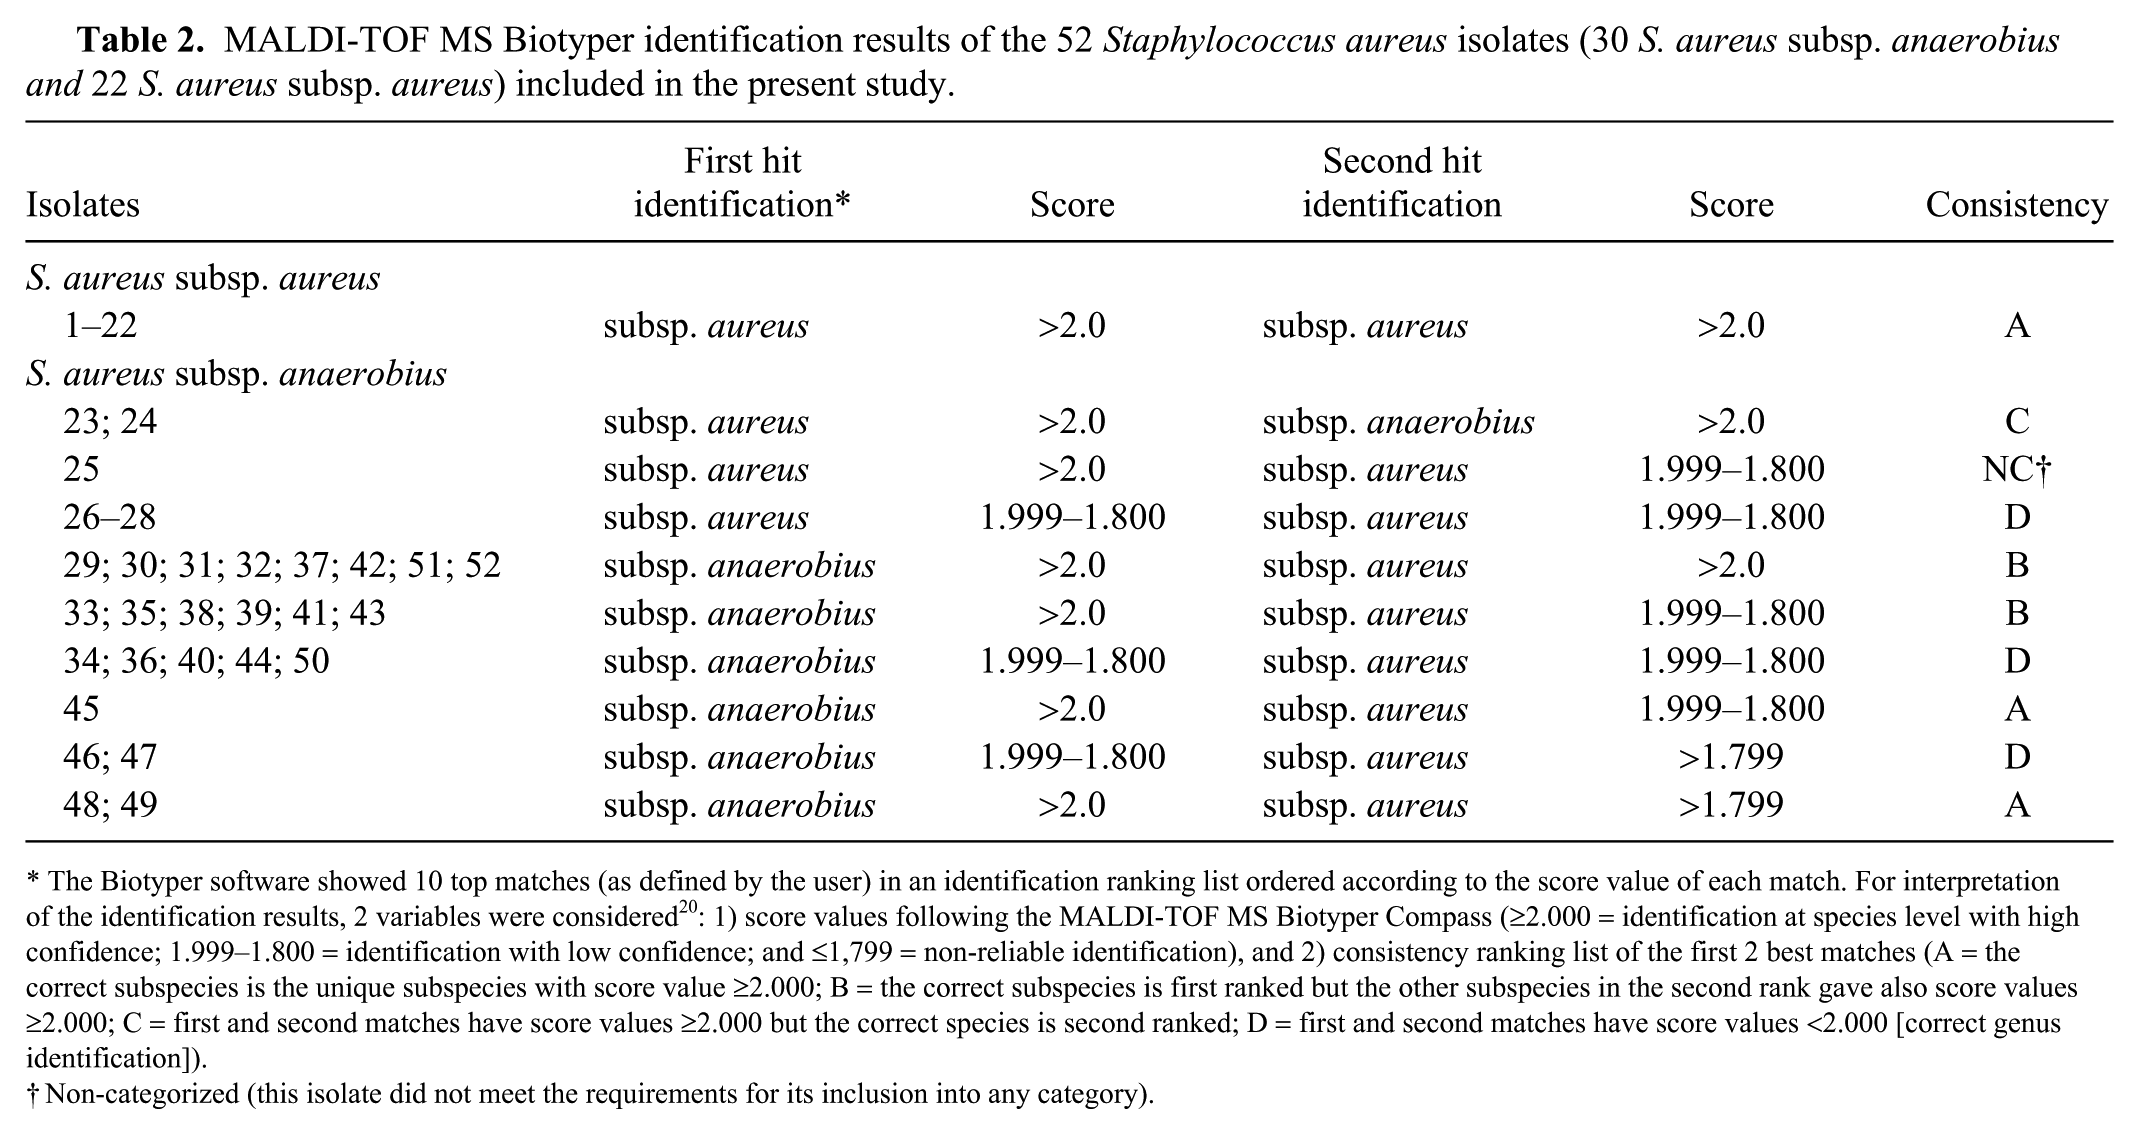
The Biotyper software showed 10 top matches (as defined by the user) in an identification ranking list ordered according to the score value of each match. For interpretation of the identification results, 2 variables were considered 20 : 1) score values following the MALDI-TOF MS Biotyper Compass (⩾2.000 = identification at species level with high confidence; 1.999–1.800 = identification with low confidence; and ⩽1,799 = non-reliable identification), and 2) consistency ranking list of the first 2 best matches (A = the correct subspecies is the unique subspecies with score value ⩾2.000; B = the correct subspecies is first ranked but the other subspecies in the second rank gave also score values ⩾2.000; C = first and second matches have score values ⩾2.000 but the correct species is second ranked; D = first and second matches have score values <2.000 [correct genus identification]).
Non-categorized (this isolate did not meet the requirements for its inclusion into any category).
Spectra inspection using flexAnalysis
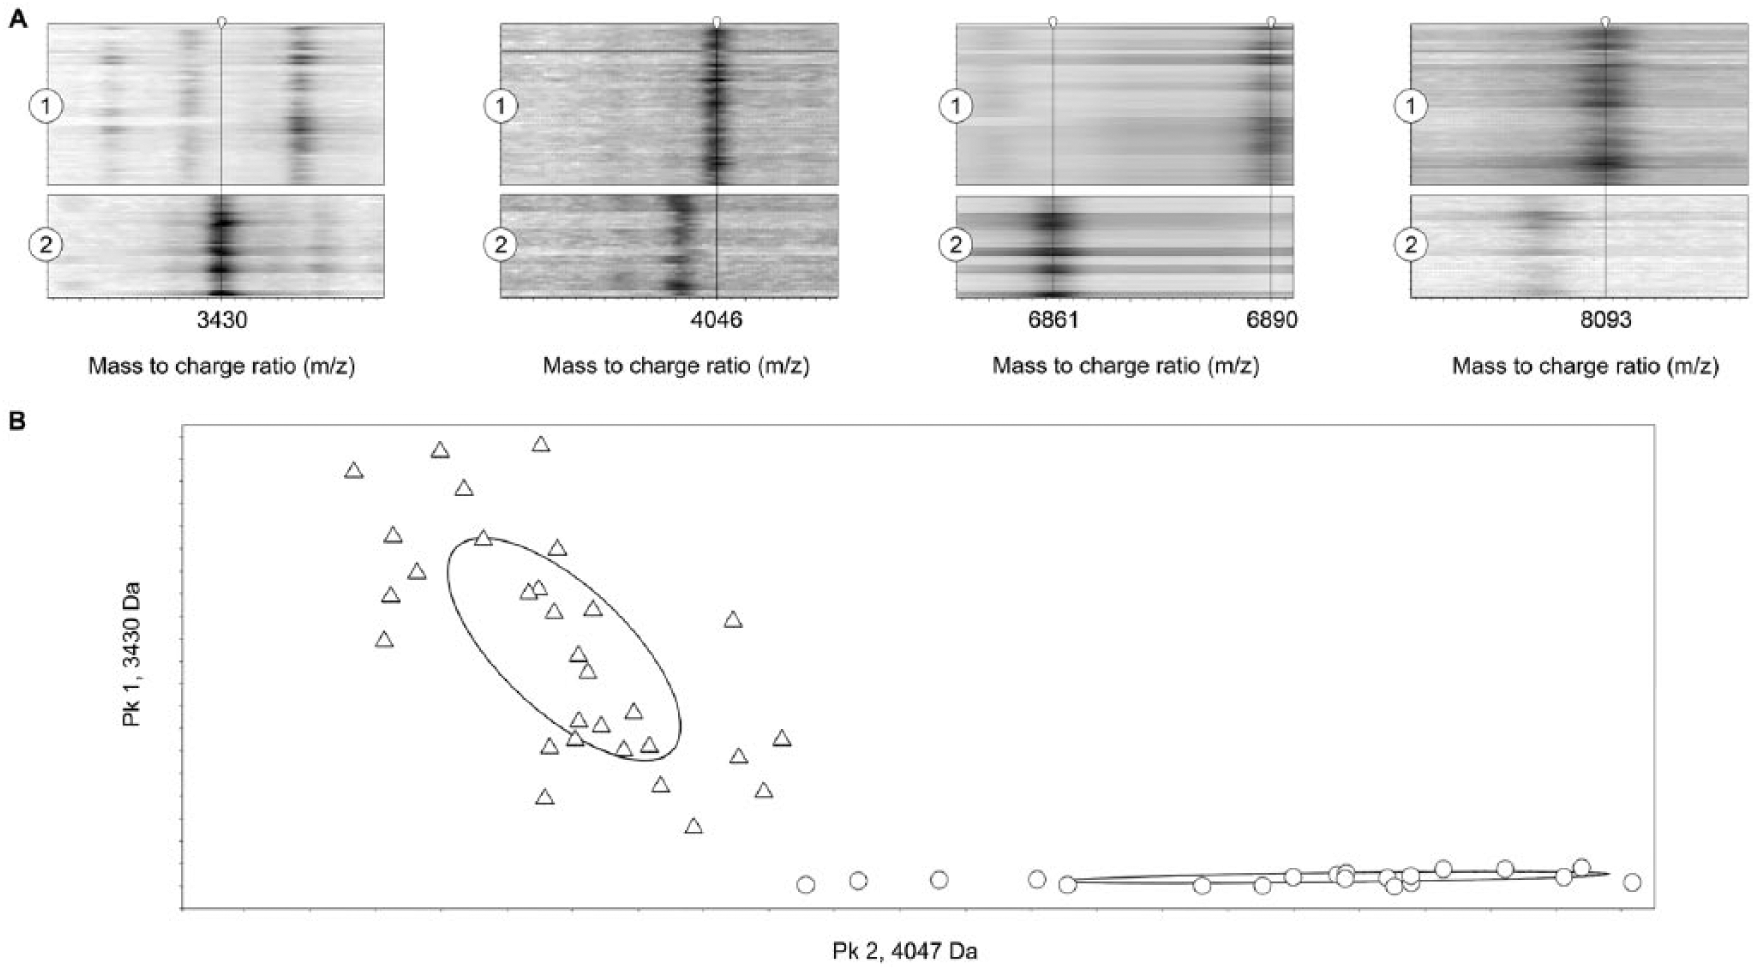
Overall, 78 spectra (3 spectra for each S. aureus isolate of both subspecies of group 1) were analyzed using flexAnalysis software. The visual inspection of these spectra showed some differential peaks in the isolates of both subspecies (Table 1). Thus, peaks mass/charge (m/z) 3430 and 6861 were identified in all isolates of S. aureus subsp. anaerobius, but neither peak was present in any of the S. aureus subsp. aureus isolates (Tables 1, 3). Additionally, peak m/z 4039 was observed in S. aureus subsp. anaerobius, but only in 22 of 30 isolates (73%; Table 3). On the other hand, peaks m/z 3444, 4046, 6890, and 8093, which were present in all of the S. aureus subsp. aureus isolates, were consistently absent, with one exception, in the S. aureus subsp. anaerobius isolates (Tables 1, 3). Peak m/z 3444 was observed in S. aureus subsp. anaerobius isolate 24 (Table 1). All peaks showed relative intensity of ⩾600 arbitrary units (a.u.) and signal-to-noise result of ⩾5 (data not shown), but only peaks m/z 3430, 4046, 6861, 6890, and 8093 showed 100% sensitivity and specificity values (Table 3, Fig. 1). Regardless of differences in aerotolerance or the catalase activity of the 4 S. aureus subsp. anaerobius mutant isolates, all 4 isolates showed the 3 typical subspecies MS peaks. Moreover, a detailed revision of the MS spectra of the S. aureus strains included in the Bruker database (belonging to different origins, countries, and years) identified the 5 proposed differential peaks in nearly all of the strains. Therefore, these distinctive peaks may allow the differentiation of both S. aureus subspecies based on their MALDI-TOF MS profiles.
Performance of subspecies-characteristic mass ions used for the differentiation of both subspecies (aureus and anaerobius) of Staphylococcus aureus.
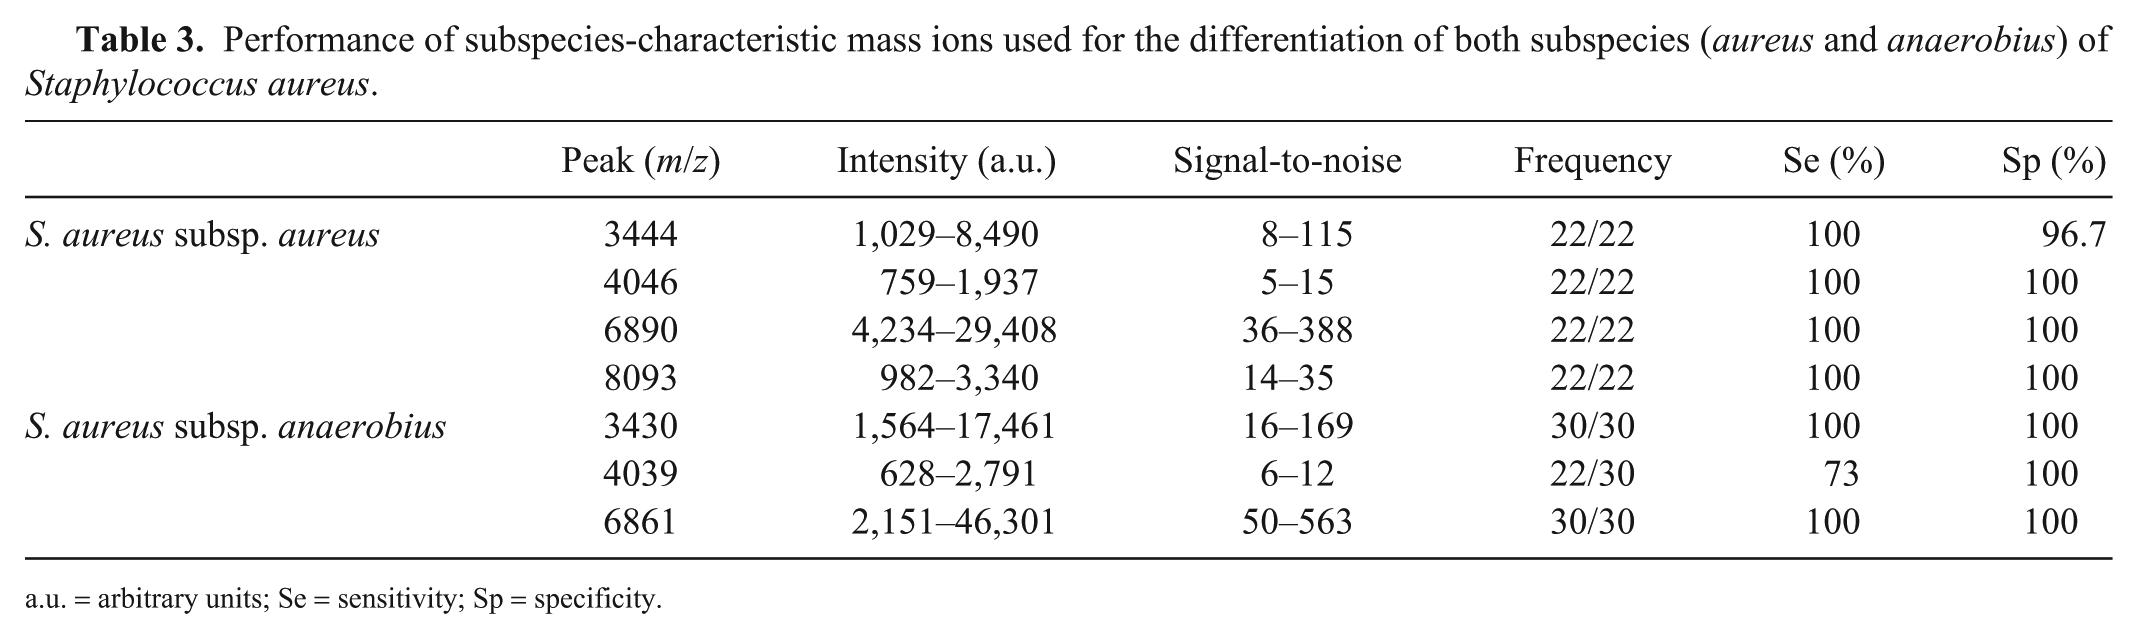
u. = arbitrary units; Se = sensitivity; Sp = specificity.
ClinProTools illustrations:
ClinProTools: visual inspection, model construction, and validation
The peak calculation command of ClinProTools revealed the existence of 133 peaks with signal-to-noise result of ⩾5 in the mass range 2–18 kDa in the 78 spectra previously analyzed with the flexAnalysis software. The GA model included the 5 subspecies-specific peaks (m/z 3430, 4046, 6861, 6890, and 8093) identified by flexAnalysis that were manually included on ClinProTools models. For the SNN and QC models, only peak m/z 4046 was considered. The suitability of the 3 models was evaluated using the RC and CV values provided by ClinProTools. The GA and QC models reached RC and CV values of 100% (Table 4). The SNN model reached RC and CV values of 94% and 100%, respectively. Further external validation of the GA and QC models was performed using an additional blind panel of 26 S. aureus isolates of both subspecies (group 2). The GA and QC models classified correctly all isolates of both subspecies (Table 4).
Recognition Capability, Cross Validation values, and external validation data of the classification models generated based on Genetic Analysis, Quick Classifier, and Supervised Neural Network algorithms, using 52 Staphylococcus aureus isolates (3 spectra per isolate) to differentiate S. aureus subspecies.
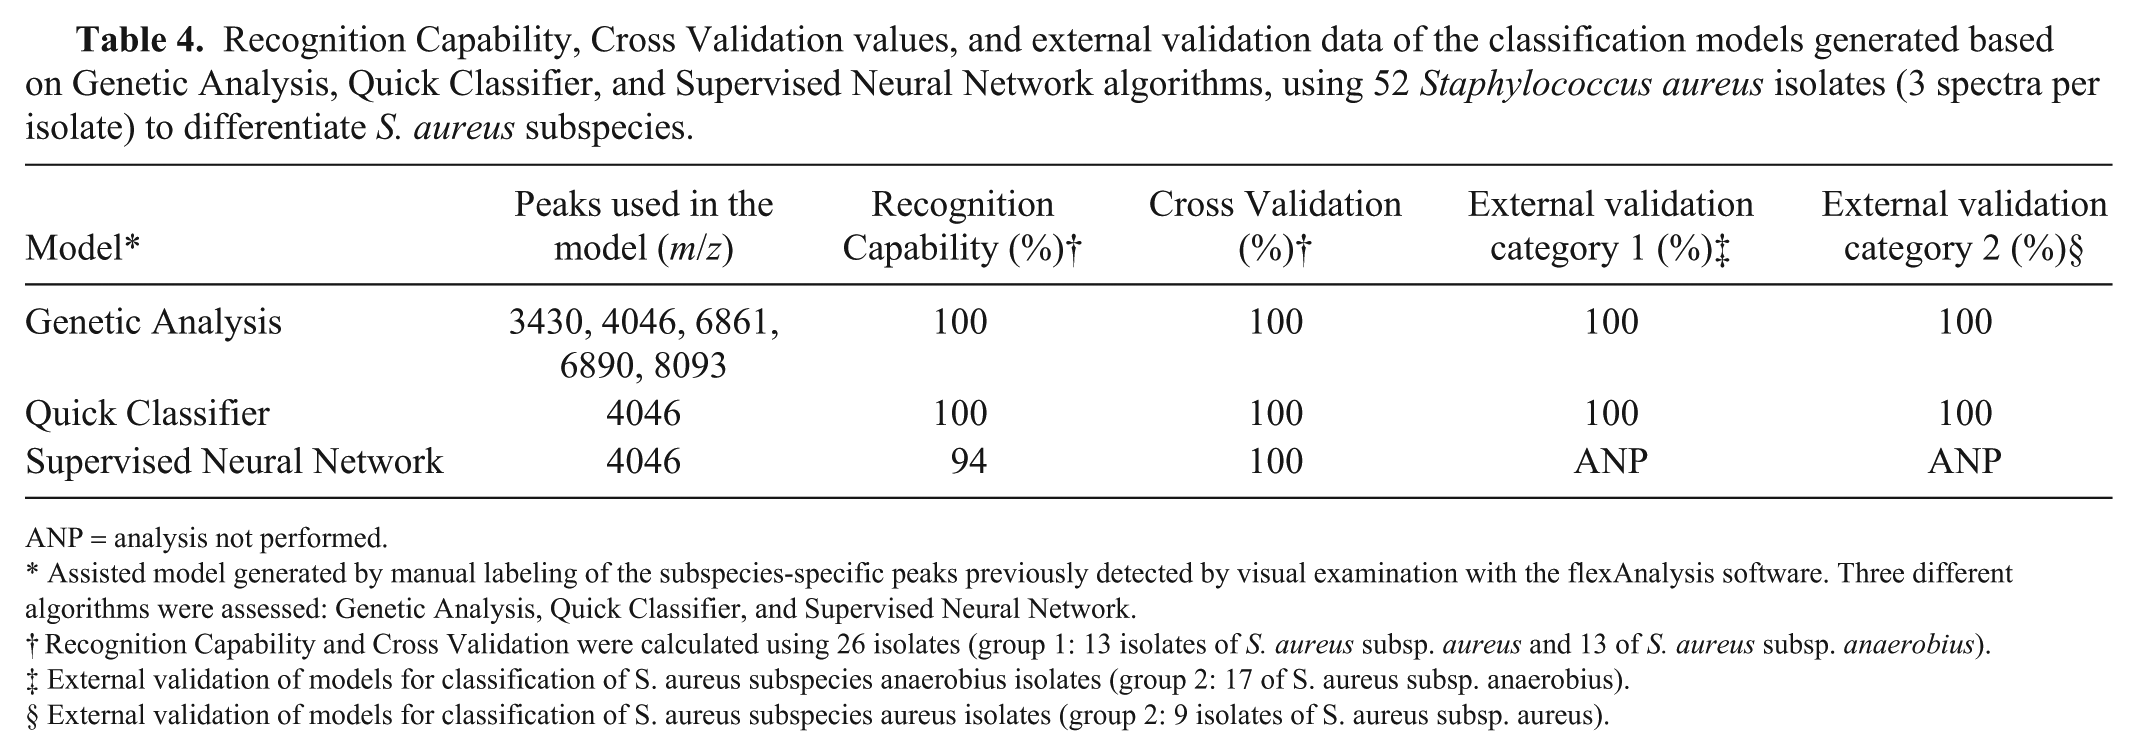
ANP = analysis not performed.
Assisted model generated by manual labeling of the subspecies-specific peaks previously detected by visual examination with the flexAnalysis software. Three different algorithms were assessed: Genetic Analysis, Quick Classifier, and Supervised Neural Network.
Recognition Capability and Cross Validation were calculated using 26 isolates (group 1: 13 isolates of S. aureus subsp. aureus and 13 of S. aureus subsp. anaerobius).
External validation of models for classification of S. aureus subspecies anaerobius isolates (group 2: 17 of S. aureus subsp. anaerobius).
External validation of models for classification of S. aureus subspecies aureus isolates (group 2: 9 isolates of S. aureus subsp. aureus).
Discussion
Overall, most (42 of 52, 81%) S. aureus isolates were correctly identified at the species level with score values >2.0. However, this result is slightly lower than those reported in previous studies in which 93–100% of S. aureus isolates were correctly identified.1,14,24,29 In all of these studies, there is no indication of the S. aureus subspecies, but considering the clinical origin of the isolates it is reasonable to assume that all were S. aureus subsp. aureus. In this sense, all isolates of this subspecies were correctly identified, confirming the suitability of MALDI-TOF MS for identifying S. aureus and its differentiation from other species of Staphylococcus. The lower proportion of S. aureus isolates correctly identified by MALDI-TOF in our study is likely biased by the low performance of this technique for the identification of isolates of S. aureus subsp. anaerobius; one-third of the isolates of this subspecies gave score values <2.0 when identified by MALDI-TOF MS Biotyper.
Identification based exclusively in the first identification score provided by Biotyper may not be the best approach for accurate identification given that it has been shown that an evaluation of at least the score value of the second identification is required for Chryseobacterium spp. in aquaculture. 22 Consequently, the consistency of MALDI-TOF MS identification results in our study was evaluated considering the 2 best scores provided by MALDI-TOF MS Biotyper. Following this criterion, all isolates of S. aureus subsp. aureus were correctly identified at the subspecies level with consistency identification category A. On the other hand, the MALDI-TOF MS Biotyper showed a low confidence level of identification for S. aureus subsp. anaerobius with most isolates exhibiting consistency identification categories B, C, or D, and only 3 of 30 isolates (10%) identified correctly (consistency A) at the subspecies level. The accuracy of MALDI-TOF MS identification can be improved by increasing the numbers of mass spectra profiles of a particular bacterial species.5,30 The Bruker MALDI-TOF MS Biotyper database includes only one main spectrum of S. aureus subsp. anaerobius. The addition to the database of spectra of additional isolates of S. aureus subsp. anaerobius may improve the accurate identification of this subspecies.
MALDI-TOF MS can discriminate at the subspecies level when the method is combined with specific biomarkers. A careful manual inspection of peaks throughout the spectra using flexAnalysis software revealed 5 well-defined peaks (m/z 4046, 6890, and 8093 for S. aureus subsp. aureus, and 3430 and 6861 for S. aureus subsp. anaerobius) capable of subspecies differentiation. The Bruker database (5,989 entries) included 14 S. aureus entries (13 subsp. aureus and 1 subsp. anaerobius). The 5 discriminating peaks identified in our study were always detected in their respective subspecies isolates (peak m/z 6890 was not observed in 3 S. aureus subsp. aureus entries [23%] although it showed the highest intensity and signal-to-noise results for this subspecies). Peak m/z 6890 has been consistently identified previously in those studies that have analyzed the mass spectra of S. aureus.3,16,19 Moreover, others 16 also identified the other 2 S. aureus subsp. aureus peaks. These data together with the results of our study showing 100% sensitivity and specificity values for all 5 discriminating peaks suggest that they could be useful for the rapid differentiation of both subspecies.
Every MALDI profile must be analyzed carefully when subspecies classification is performed by visual inspection based on the presence or absence of the 5 proposed peaks (m/z 3430, 4046, 6890, 6861, and 8093) to differentiate S. aureus isolates. Manual inspection of mass spectra is time-consuming and, for that reason, unrealistic in the routine workflow of a diagnostic laboratory. ClinProTools software, combined with MALDI-TOF MS data, permitted the direct analysis of the spectra of isolates and the construction of classification models for the automatic differentiation of microorganisms based on their subtypes, providing results immediately without requiring a technician’s interpretation. This approach has been successfully used for the identification of Photobacterium damselae subspecies. 23 In our study, 3 different classification models (GA, QC, and SNN) were constructed using the ClinProTools software. For the SNN and QC models, it is not possible to define the number of peaks that are automatically assigned by the program. Thus, QC and SNN models were constructed in the automatic mode applying the default parameter settings for spectra preparation and peak calculation. However, the GA classification model allows the manual inclusion of selected mass peaks ions. As automated peak picking can give inconsistent results in terms of accuracy, 23 the 5 discriminating peaks identified by visual inspection with the flexAnalysis software with 100% sensitivity and specificity values were labeled by manual handling in this classification model. Both GA and QC models reached RC and CV values of 100%, whereas the SNN model reached RC and CV values of 94% and 100%, respectively, suggesting potential good performance of these models. However, to strengthen identification reliability, further validation analysis was performed only with the GA and QC models using a blind panel of S. aureus isolates of both subspecies. Both models correctly classified 100% of isolates of both subspecies, suggesting good performance of these models in the identification of isolates belonging to S. aureus subsp. aureus and subsp. anaerobius.
Footnotes
Acknowledgements
We thank Almudena Casamayor and Elisa Pulido for their invaluable technical assistance.
Declaration of conflicting interests
The authors declared no potential conflicts of interest with respect to the research, authorship, and/or publication of this article.
Funding
The study was funded by the Regional Government of Madrid structural funds and European Union [S2013/ABI-2747 (TAVS-CM)].