
Abstract
Clot waveforms are generated by coagulation analyzers, such as the ACL-TOP, that utilize photo-optical turbidimetric methods to measure prothrombin time (PT) and activated partial thromboplastin time (aPTT), which are standard clotting tests (SCTs). Additional quantitative clot waveform analysis (CWA) parameters include maximum velocity of the PT curve (PT1d), maximum acceleration of the aPTT curve (aPTT2d), and their change in optical density (ODdelta). We explored the potential for CWA to contribute unique information compared to SCTs and quantitative fibrinogen assay (QFA) in dogs with clinical indications for laboratory evaluation of coagulation. We retrospectively evaluated the frequency and agreement between normal, high, and low values of CWA and SCTs for 203 dogs relative to reference intervals (RIs). Most dogs had SCTs within RIs, but most CWA values were high regardless of whether SCT values were within, below, or above the RI. Agreement between SCTs and CWA was slight (kappa <30%). Clinically significant bleeding was noted in 28 of 203 (14%) dogs. SCTs were not different between bleeders and non-bleeders. Median QFA, PT1d, aPTTdelta, and aPTT2d values were statistically significantly higher than RIs in non-bleeders compared to bleeders, whose median values were not below RI. Compared with SCTs, CWA identified differences between the 2 groups. However, wide overlap between the 2 groups limits the use of CWA to clinically discriminate between bleeders and non-bleeders in a heterogeneous population of dogs. Further studies on the diagnostic utility of CWA in coagulopathic dogs are needed.
Introduction
Coagulation panels are used to assess the risk of clinical bleeding in patients prior to invasive procedures and to evaluate clotting disorders in various conditions including trauma, sepsis, liver failure, disseminated intravascular coagulation (DIC), neoplasia, and immune-mediated disease. Coagulation testing at our institution currently includes prothrombin time (PT) and activated partial thromboplastin time (aPTT), which comprise the standard clotting tests (SCTs), plus the Clauss quantitative fibrinogen assay (QFA). These tests are used to evaluate disorders of secondary and mixed hemostasis. 26 An increase in PT or aPTT above their reference intervals (RIs) or an elevation of >1.5 times the upper limit of the RI of the international normalized ratio (INR) has been used to guide hemostatic management in humans and animals.2,11,22,33,37,52 The INR is calculated using the PT and a laboratory-derived international standard in order to correct for differences in reagents among laboratories.
Prolongation in PT and aPTT occurs in 14–28% of critically ill human patients. 21 Several reviewers have concluded that SCTs are insufficient predictors of bleeding risk in both humans and animals and do not assess the strength or quality of clot formation, maximal thrombin generation, fibrinolysis, or hypercoagulability.1,12,21,26,33,37 In one study of human ICU patients, 75% of patients had minor prolongations in INR (1.6–2.5) with a prevalence of moderate and major hemorrhage of 6.9% and 2.3%, respectively. 54 Therefore, the predictive value of bleeding risk in critically ill patients at these commonly seen minor prolongations is limited. 33 Similar mild prolongations in SCTs in animals are also often regarded as being of questionable value.
As alternatives, viscoelastic tests, such as thromboelastography (TEG) and rotational thromboelastometry (ROTEM), are whole blood–based global coagulation assays that incorporate all stages of coagulation (initiation, amplification, propagation, fibrinolysis) including the role of red blood cells, fibrinogen, and platelets in the kinetics of clot formation. Such tests have been used to identify systemic hyperfibrinolysis and are sometimes advocated to complement SCT in the evaluation of hypo- and hypercoagulability.10,23 There is growing but weak evidence supporting the use of viscoelastic testing to predict bleeding risk in human patients undergoing elective surgery or trauma.9,14,20,37,57 However, viscoelastic tests are subject to operator and reagent variability, and are not as widely available as SCT. 18 There is a need for a robust, automated coagulation testing system that can improve the ability to monitor bleeding.
The ACL-TOP CTS 300 (Instrumentation Laboratories, Bedford, MA) is a fully automated, benchtop analyzer that uses the photo-optical turbidimetric method to analyze clotting. This reference analyzer is equipped with automated reagent management, quality control materials and support, and results validation, thereby reducing analytical errors and operator variability. Clot curve generation helps detect pre-analytical errors such as sample pre-activation that can impact results. Light is emitted from a diode at 880 nm and passes through a platelet-poor plasma sample placed in a cuvette. As fibrin formation proceeds, the sample becomes more turbid, scattering and reducing the amount of light falling on a photosensitive detector. Quantitative parameters are mathematically derived from the clot curve, including the maximum velocity of clot formation (1d), maximum acceleration (2d), maximum deceleration of clot formation, and the total change in optical density (ODdelta), all of which are expected to be decreased in bleeding disorders. Visual inspection of the waveforms provides qualitative information about clot initiation, propagation, and stability. 49 Clot waveform analysis (CWA) can provide additional information regarding the kinetics and stability of clot formation, including the pre-coagulation phase, clot lysis, and plasma fibrinogen concentrations, and has yielded useful information in diseases such as DIC and hemophilia in human medicine.4,13,19,27,29,40-44,46,49 The ACL-TOP hemostasis analyzer was validated for use in cats and dogs at our institution and the characteristics of some common canine coagulopathies have been evaluated.36,39
In veterinary medicine, the application of clot waveform data derived from the photo-optical turbidimetric coagulation method is still evolving. The focus of our study was to determine if CWA can provide novel information compared with PT, aPTT, or QFA. We compared the frequency of normal, high, and low CWA parameters relative to their RI, and characterized the agreement between these parameters and SCT to determine if the coagulation status suggested by both sets of data was concordant. We hypothesized that when SCTs are within RI, the corresponding CWA parameters would also be within their RI, and that when the SCTs are above RI, the CWA parameters would be below the RI. Thus, the null hypothesis is that results would correlate in categorizing clotting as “normal” or “abnormal” and that there is no value in evaluating CWA data separately. Our secondary objective was to compare CWA, SCT, and QFA values among dogs with and without clinically significant bleeding. We hypothesized that clinically significant bleeding would be associated with SCT values above the RI and CWA values below RI.
Materials and methods
Study population
The medical record database at the University of Minnesota Veterinary Medical Center (VMC) was searched for dogs that had coagulation panels performed between August 2015 and April 2016. In cases in which multiple coagulation panels were performed, only the first one was included in the analysis. Demographic information (breed, age, body weight, sex, and presenting complaint) was recorded for all dogs. Hematologic data including packed cell volume and complete blood count were collected when available. Information regarding blood product transfusions and mortality or survival to discharge was recorded when available. When the coagulation panel requested did not include a platelet count, the most recent platelet count performed within that visit for each patient was recorded.
Exclusion criteria consisted of conditions that interfered with photo-optical clot waveform generation in which clot waveform data were not available. These included analytical interferences as a result of icterus, severe lipemia, or pre-activation of the sample. Also excluded were curves that did not proceed to their completion within the assay time limit, did not meet the minimum requirements for delta values according to manufacturer’s quality assurance recommendations, or were lost from the database because of a technical error. Fibrinogen values below the assay linearity of 1.03 µmol/L (35 mg/dL) were associated with unreadable clot wave forms and were excluded. Dogs receiving therapeutic anticoagulation or with a known history of anticoagulant rodenticide ingestion were also excluded given data from a previous study that demonstrated frequent failure of adequate clot wave formation. 36 In addition, dogs that received blood product transfusions in a 28-d period prior to blood collection were also excluded.
Laboratory analysis
Samples had been obtained by atraumatic venipuncture into 1.8-mL 3.2% sodium citrate tubes (Vacutainer, BD, Franklin Lakes, NJ) and had been delivered to the laboratory within 10 min of collection. Overfilled or underfilled tubes were rejected. Samples were centrifuged at 2,800 × g for 15 min (Allegra X-22, Beckman Coulter, Indianapolis, IN) to produce platelet-poor plasma samples (<10 × 109/L) and directly loaded onto the analyzer. The ACL-TOP CTS 300 was used for all coagulation tests. Manufacturer’s reagents for PT (HemosIL RecombiPlasTin 2G, Instrumentation Laboratories), aPTT (HemosIL SynthASil APTT reagent, Instrumentation Laboratories), and QFA (HemosIL QFA thrombin, Instrumentation Laboratories) were used.
Quantitative CWA data obtained for each case included PT and aPTT delta (change in absorbance units during the coagulation phase), maximum value of PT 1st derivative (PT1d), and maximum value of the aPTT 2nd derivative (aPTT2d). Values were recorded and compared against internal RI generated according to guidelines published by the American Society for Veterinary Clinical Pathology.8,39 Briefly, 48 healthy dogs were recruited prospectively for sample collection. For RI generation, measurements were first transformed using the Box–Cox transformation, and then assessed for outliers using the Dixon r statistic and Tukey interquartile fences, as well as visually using histograms and quantile–quantile (Q-Q) plots. RIs were then computed using the robust method, with 90% confidence intervals computed using the bootstrap method. 39
Identification of clinically significant bleeding
The medical records of study dogs were reviewed for any observed bleeding, including the extent and location. Given the lack of universal definitions for clinically significant bleeding in veterinary medicine, the Safety and Efficacy of Enoxaparin in PCI Patients, an International Randomized Evaluation (STEEPLE) criteria for major bleeding, were adapted from human cardiovascular clinical trials given their presumed applicability to veterinary patients.32,34,55 According to the STEEPLE criteria, clinically significant bleeding was considered to be present if any one of the following was observed: bleeding that was fatal (patient was euthanized or died from overt bleeding based on clinical diagnosis, imaging, or autopsy findings), bleeding into a cavity including retroperitoneal and intracranial, bleeding that caused hemodynamic compromise requiring specific treatment, bleeding that required immediate intervention (surgery or endoscopy) for hemostasis, bleeding that prompted transfusion of one or more units of packed red blood cells or whole blood, or if there was clinically overt bleeding with a decrease in hematocrit of ⩾10%.
Statistical methods
Continuous data were evaluated for normality and expressed as median (range) if they did not follow normal distribution. We compared PT and aPTT with the delta for each of the 2 tests, PT with PT1d, aPTT with aPTT2d, and QFA with all 4 parameters (PTdelta, aPTTdelta, PT1d, and aPTT2d). The proportion of normal, high, or low PTdelta and PT1d values when PT was normal, low, and high were evaluated. Similarly, we evaluated the proportion of normal, high, or low aPTTdelta and aPTT2d values when aPTT was normal, low, or high, and also the proportions of normal, high, or low values of all 4 CWA parameters (PTdelta, aPTTdelta, PT1d, and aPTT2d) when QFA was normal, low, or high. To test the similarity of high, normal, or low results between the 2 tests, the frequency of agreement between them was assessed using the unweighted Cohen kappa statistic. Kappa statistics provide additional information beyond the observed proportion of agreement by accounting for agreement that may occur by chance alone. A kappa <0 indicates none or poor agreement, 0.01–0.20 indicates slight agreement, 0.21–0.40 indicates fair agreement, 0.41–0.60 indicates moderate agreement, 0.61–0.80 indicates substantial agreement, and 0.81–0.99 indicates almost perfect agreement.31,58 SCT and CWA parameters were considered to be similar if they agreed with each other in the following manner: a) both SCT and CWA values were within RI, b) CWA parameters were below RI when SCT were above RI, indicating slow or weak clot formation, and c) CWA parameters were high when SCT were low, indicating robust or dense clot formation. The numbers of dogs with and without clinically significant bleeding were recorded and grouped accordingly. Numerical continuous data (SCT, QFA, and CWA parameters) were compared among bleeders and non-bleeders using the Wilcoxon test; p ⩽ 0.05 was considered statistically significant. Statistical data analysis was performed using commercial software (R v.3.2.0, https://www.r-project.org/; Studio v.3.7 for Windows. SAS Institute, Cary, NC).
Results
A total of 306 coagulation panels were requested during the study period. Of these, 76 were serial testing and were excluded. Of the 230 remaining coagulation panels, 11 dogs were excluded because of known anticoagulant rodenticide ingestion and 9 for previous blood product transfusions. Of the remaining 210 dogs, 7 were excluded because of lack of clot curve data. A total of 203 canine coagulation panels meeting our study criteria were included for evaluation. Coagulation data were requested as part of diagnostic workup in dogs with various clinical indications including acute-onset lethargy, gastrointestinal signs (anorexia, vomiting, diarrhea), neurologic signs (paraplegia, dull mentation, circling, ataxia), nasal discharge including epistaxis, trauma (blunt and penetrating), icterus, necrotizing skin lesions, pallor, abdominal mass, hemoperitoneum, hemothorax, liver failure, anemia, thrombocytopenia, hypoglycemia, acute abdomen, pyrexia, leukopenia or leukocytosis, neoplasia, respiratory distress, acute onset of swelling, bleeding, suspicion for infectious diseases (septic peritonitis, bile peritonitis, Cuterebra infestation, pyothorax, bacterial pneumonia, acute cholangiohepatitis, hepatic abscess, suppurative panniculitis, viral necrotizing gastroenteritis, aspiration pneumonia, nasal aspergillosis, pyelonephritis), pancreatitis, diabetic ketoacidosis, sepsis, ischemic monoplegia, and bleeding following surgery, prior to invasive procedures such as liver biopsy, rhinoscopy, endoscopy, advanced imaging or surgery, or prior to chemotherapy following splenectomy.
The most common breeds were Labrador Retrievers (29 of 203), Golden Retrievers (20 of 203), Shih Tzus (7 of 203), Beagles (6 of 203), German Shepherd Dogs (5 of 203), Maltese (5 of 203), and 4 each of the following: Yorkshire Terrier, Newfoundland, mixed breeds, Miniature Schnauzer, Miniature Poodle, Jack Russell Terrier, Great Dane, American Staffordshire Terrier, Boston Terrier, Chihuahua, Cocker Spaniel, Doberman Pinscher. There were 91 neutered males (45%), 87 spayed females (43%), 18 intact males (9%), and 7 intact females (3%). The median age was 8.6 y (range: 2.4 mo–16.8 y), and the median body weight was 22.3 kg (range: 2.3–65 kg).
Proportion of dogs classified as normal, low, or high by CWA vs. SCT and QFA
The PT and aPTT values of most dogs fell within the RI (63% and 54% of dogs, respectively; Fig. 1). In contrast to PT and aPTT, most study dogs had QFA values above RI (64%). CWA parameters (PTdelta, aPTTdelta, PT1d, and aPTT2d) were above RI in most dogs (70%, 68%, 65%, and 64%, respectively; Fig. 1). The median values for PT, aPTT, and platelet counts were within the RI; however, the ranges incorporate values from below to markedly above the RI (Table 1). For QFA and CWA parameters, the ranges similarly include low and high values, but the medians were above the RI, reflecting the frequency of dogs with CWA values above the RI despite a tendency for normal PT and aPTT. A large proportion (54–100%) of CWA values were above RI regardless of SCT values (Fig. 2). When SCTs were within RI, values for CWA parameters were frequently high, occasionally normal, and rarely low. Similarly, when the SCTs were above RI, CWA were often high, with a few being normal or low. When the SCTs were below RI, CWA values were above RI in almost all dogs; the CWA values deviated from SCT categorization. In contrast, QFA and CWA values frequently fell into similar categories relative to their RI. When QFA was within or above the RI, a large proportion of values for the CWA parameters was also normal (75–86%) or high (90–96%), respectively. When the QFA was below RI, CWA parameters were also below RI, but the values were more variable in this category. Two-thirds of derivative (PT1d, aPTT2d) values were below RI (67–73%). In contrast, 53% of PTdelta values and 33% of aPTTdelta values were within RI, with the remainder being below or above RI. Overall, the agreement between SCTs and CWA parameters was slight (23–29%, κ = 0.03–0.08; Table 2).
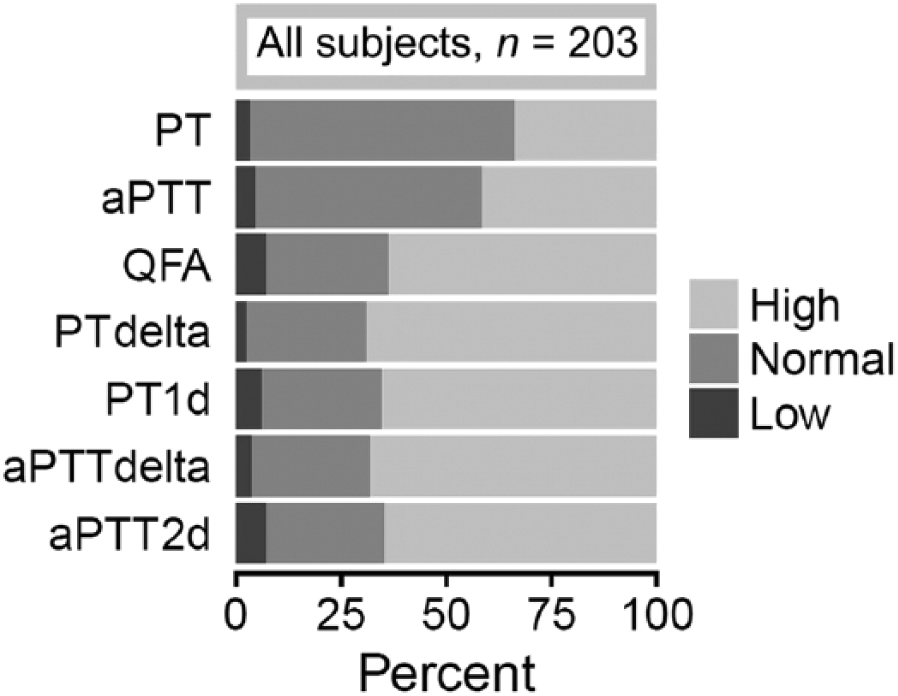
Frequency distribution of standard clotting test, fibrinogen, and clot waveform analysis values that were within (normal), above (high), or below (low) the reference intervals in dogs with clinical indication for coagulation evaluation (n = 203). aPTT = activated partial thromboplastin time; aPTT2d = peak maximum 2nd derivative of the aPTT clot curve; PT = prothrombin time; PT1d = peak 1st derivative of the PT clot curve; QFA = quantitative fibrinogen assay.
Median and range of standard clotting tests, fibrinogen assay, and novel clot waveform analysis parameters in 203 dogs with clinical indication for coagulation evaluation.
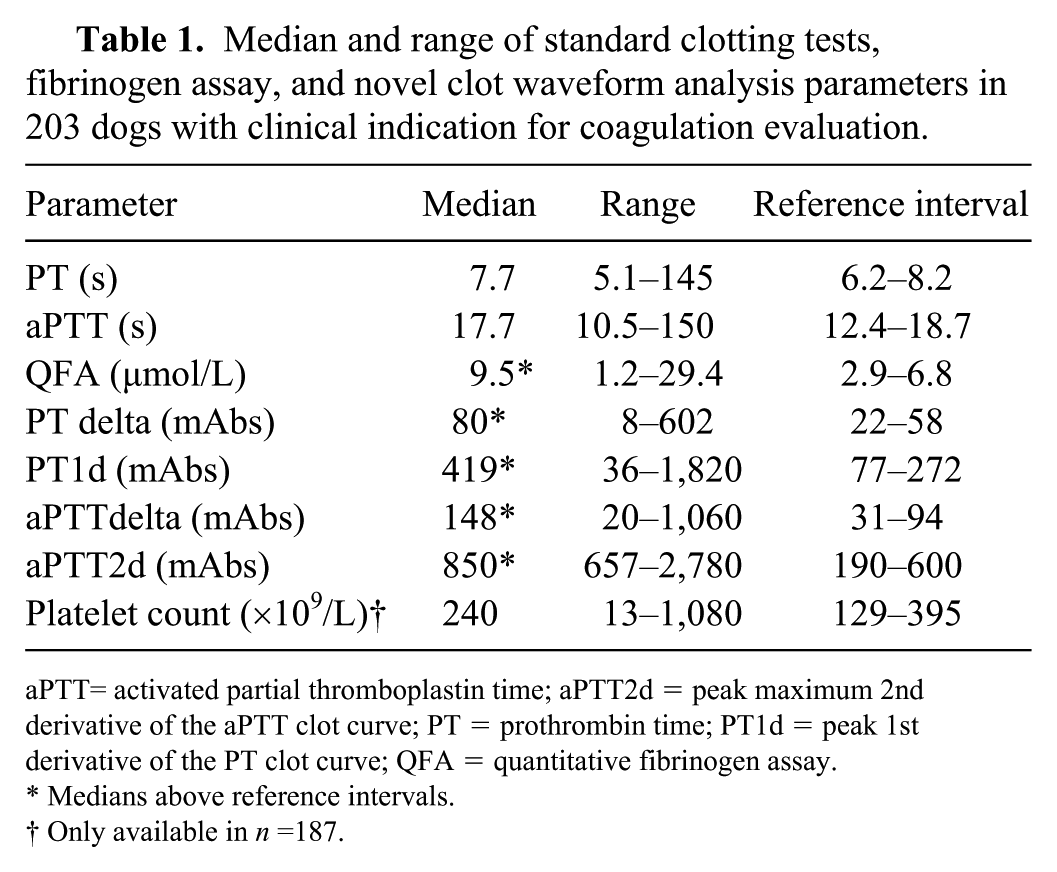
aPTT= activated partial thromboplastin time; aPTT2d = peak maximum 2nd derivative of the aPTT clot curve; PT = prothrombin time; PT1d = peak 1st derivative of the PT clot curve; QFA = quantitative fibrinogen assay.
Medians above reference intervals.
Only available in n =187.
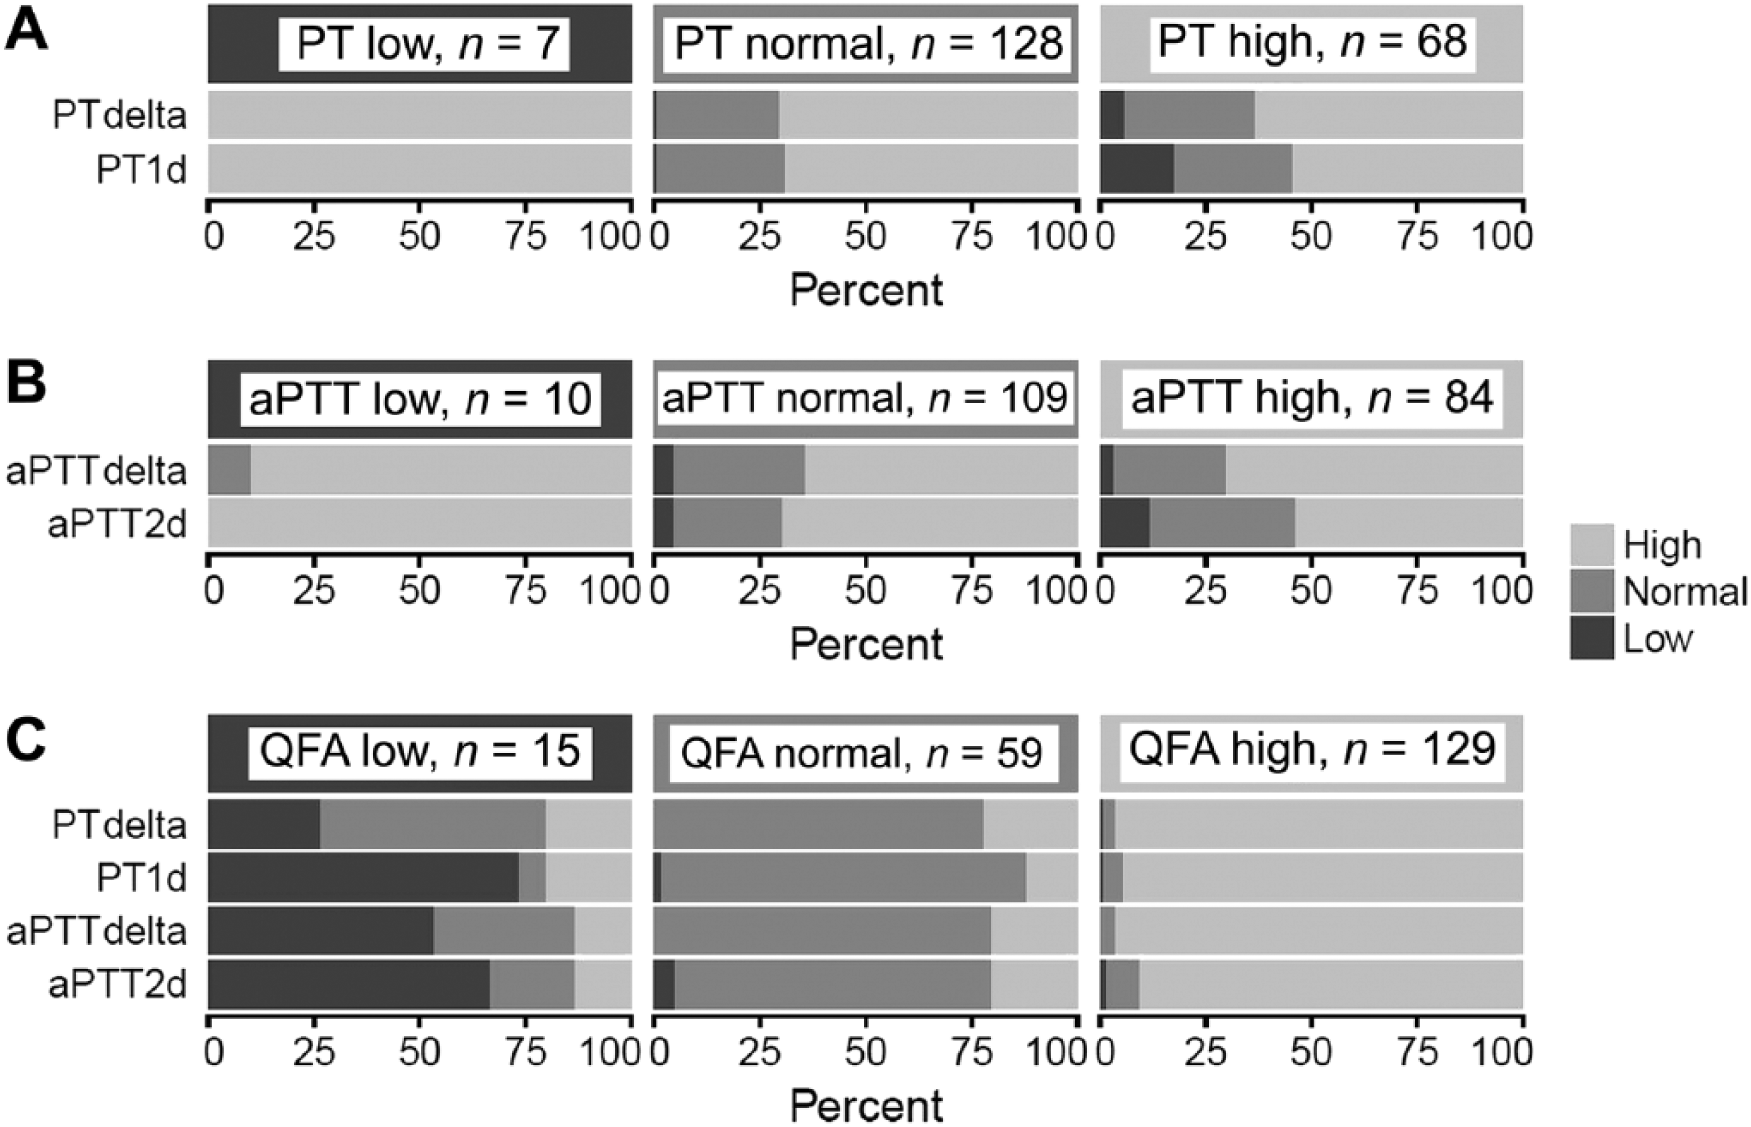
Proportion of clot waveform analysis (CWA) parameters that were within (normal), above (high), or below (low) the reference intervals grouped by corresponding standard coagulation tests (SCTs) in dogs with clinical indication for coagulation evaluation (n = 203). If there was perfect agreement between the 2 tests, values of the corresponding CWA parameters would also be normal when SCT values are normal, high when SCT values are low, or low when SCT values are high. However, SCT values were infrequently accompanied by similar changes in CWA parameters. In contrast, high fibrinogen (QFA) was frequently associated with high CWA parameters, and normal QFA with normal CWA parameters. When QFA was low, the relationship with CWA parameters was variable and unpredictable. aPTT = activated partial thromboplastin time; aPTT2d = peak maximum 2nd derivative of the aPTT clot curve; PT = prothrombin time; PT1d = peak 1st derivative of the PT clot curve; QFA = quantitative fibrinogen assay.
Proportion of clot waveform (CWA) parameters that showed agreement with standard clotting tests (SCTs) in 203 dogs with clinical indication for coagulation evaluation.
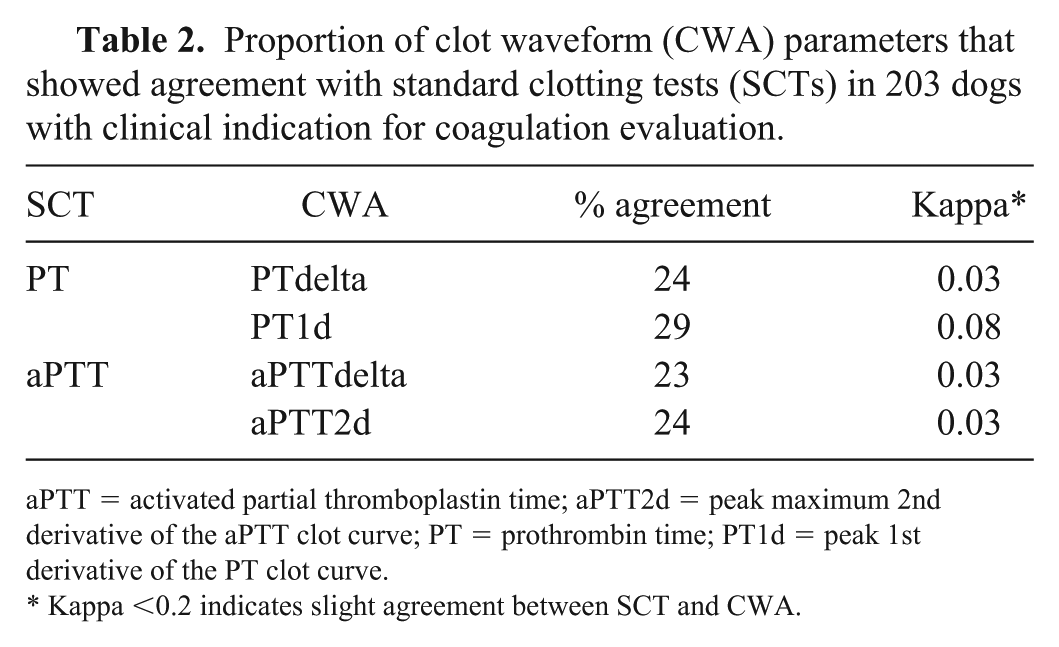
aPTT = activated partial thromboplastin time; aPTT2d = peak maximum 2nd derivative of the aPTT clot curve; PT = prothrombin time; PT1d = peak 1st derivative of the PT clot curve.
Kappa <0.2 indicates slight agreement between SCT and CWA.
CWA, SCT, and QFA in dogs with clinically significant bleeding
Fourteen percent (28 of 203) of study dogs satisfied at least one criterion for clinically significant bleeding. Significant differences were not identified based on age (p = 0.27), sex (p = 0.62), or body weight (p = 0.95) between dogs with and without bleeding. Of 38 of 203 (19%) dogs with prolongations in both PT and aPTT, only 7 of 38 (18%) had clinically significant bleeding. A similar proportion of dogs showed bleeding regardless of whether SCT values were normal, above, or below RI (Table 3). There was a lack of consistent relationship between categorization of SCT values relative to RI and the proportion of dogs with bleeding.
Classification of dogs with bleeding within each level of variation in standard coagulation test (SCT) and fibrinogen relative to their reference intervals.
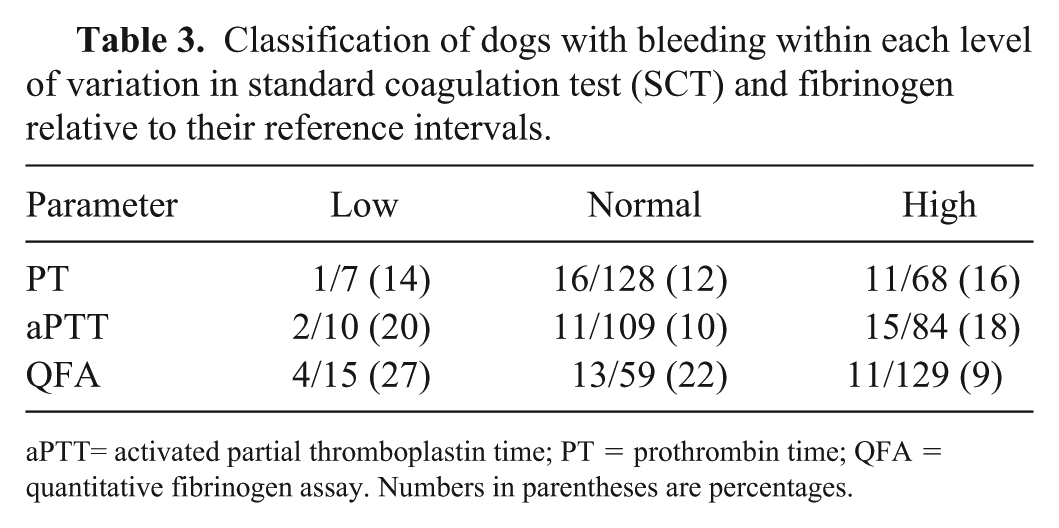
aPTT= activated partial thromboplastin time; PT = prothrombin time; QFA = quantitative fibrinogen assay. Numbers in parentheses are percentages.
Neither PT nor aPTT was statistically significantly associated with bleeding (Table 4). Dogs with and without bleeding had a median PT that was within the RI, and no significant difference was found between groups. PTdelta was not significantly different between the groups, and the median values for both bleeders and non-bleeders were above the RI. In contrast, dogs without bleeding had significantly greater PT1d values (median above RI) than dogs with bleeding, which had a median value within the RI. Similar to PT, there was no significant difference in the median aPTT between bleeders and non-bleeders, although the median for non-bleeders was within the RI and the median for bleeders was slightly above the RI. Bleeders had significantly lower median aPTTdelta and aPTT2d than non-bleeders, although the median values for both these CWA parameters were above the upper limit of RI in both groups. QFA was statistically significantly lower in bleeding dogs compared to non-bleeders, with the median being within the RI in bleeding dogs and above RI in non-bleeders. Despite the statistically significant differences in some parameters between bleeding and non-bleeding dogs, there is overlap in the values between the 2 groups (Fig. 3).
Comparison of the results of standard clotting tests (SCTs) and clot waveform analysis parameters among canine patients with (Yes) and without (No) clinically significant bleeding in 203 dogs with clinical indication for coagulation evaluation.
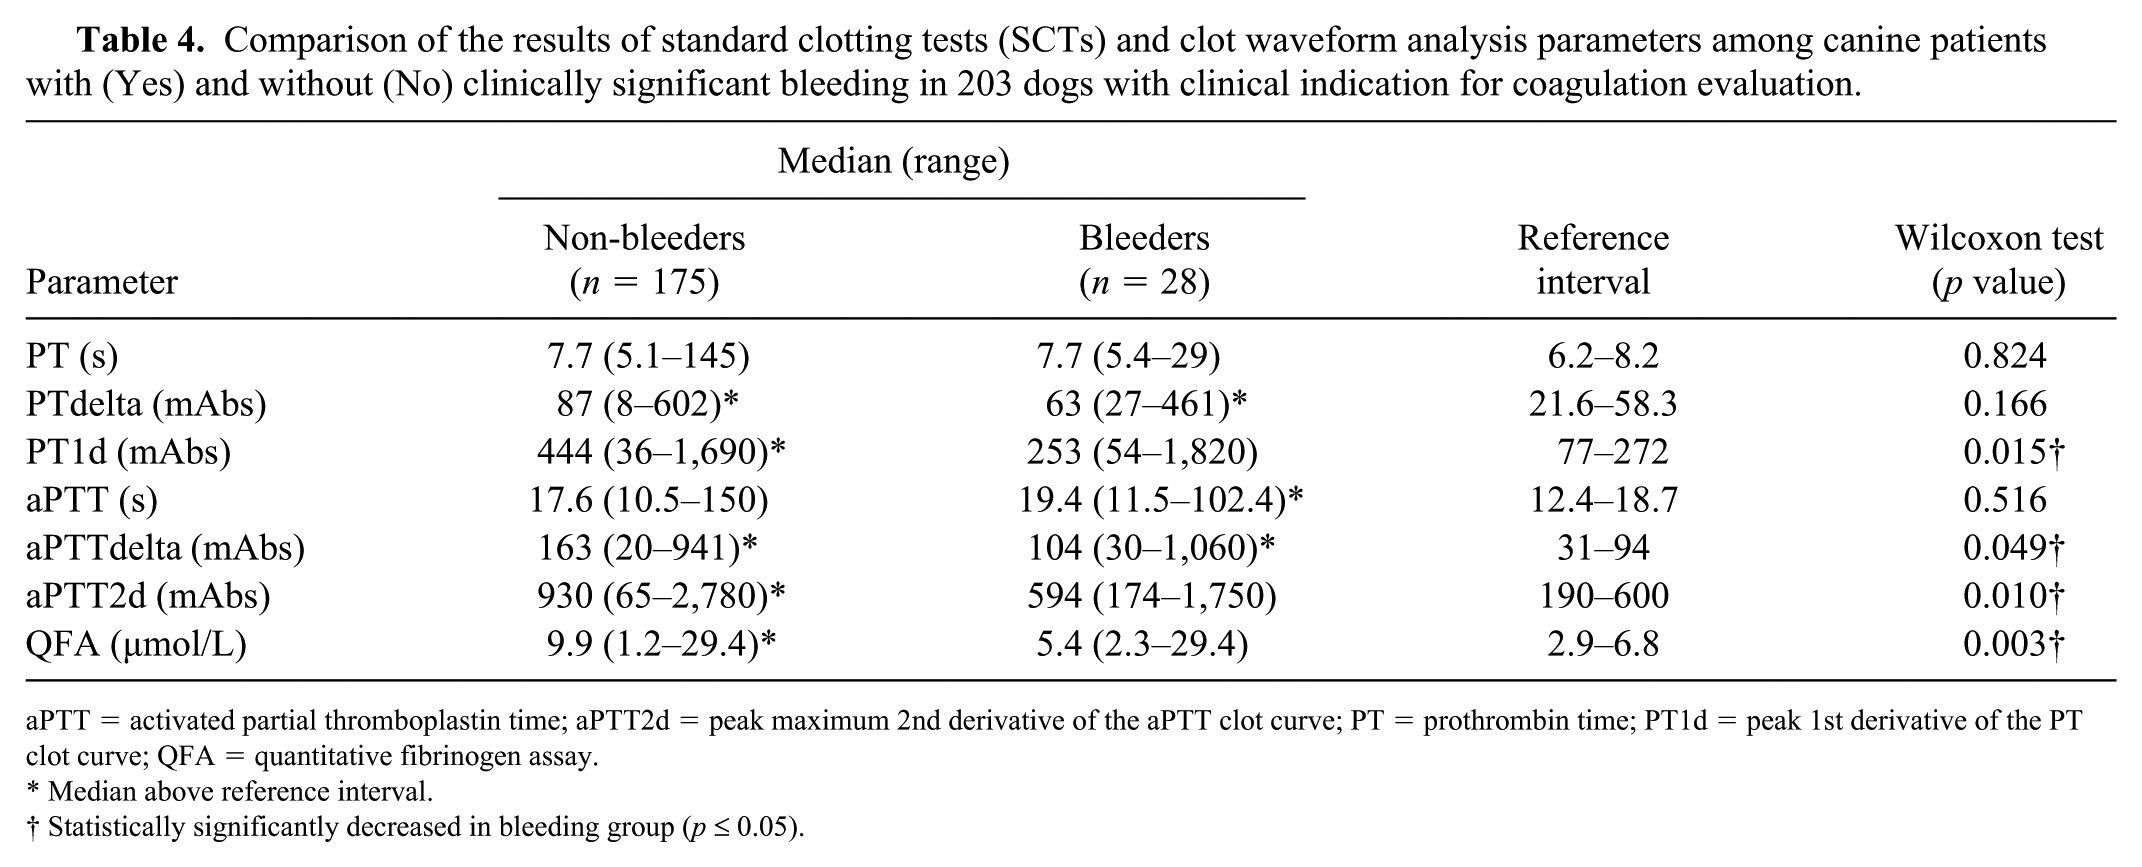
aPTT = activated partial thromboplastin time; aPTT2d = peak maximum 2nd derivative of the aPTT clot curve; PT = prothrombin time; PT1d = peak 1st derivative of the PT clot curve; QFA = quantitative fibrinogen assay.
Median above reference interval.
Statistically significantly decreased in bleeding group (p ⩽ 0.05).
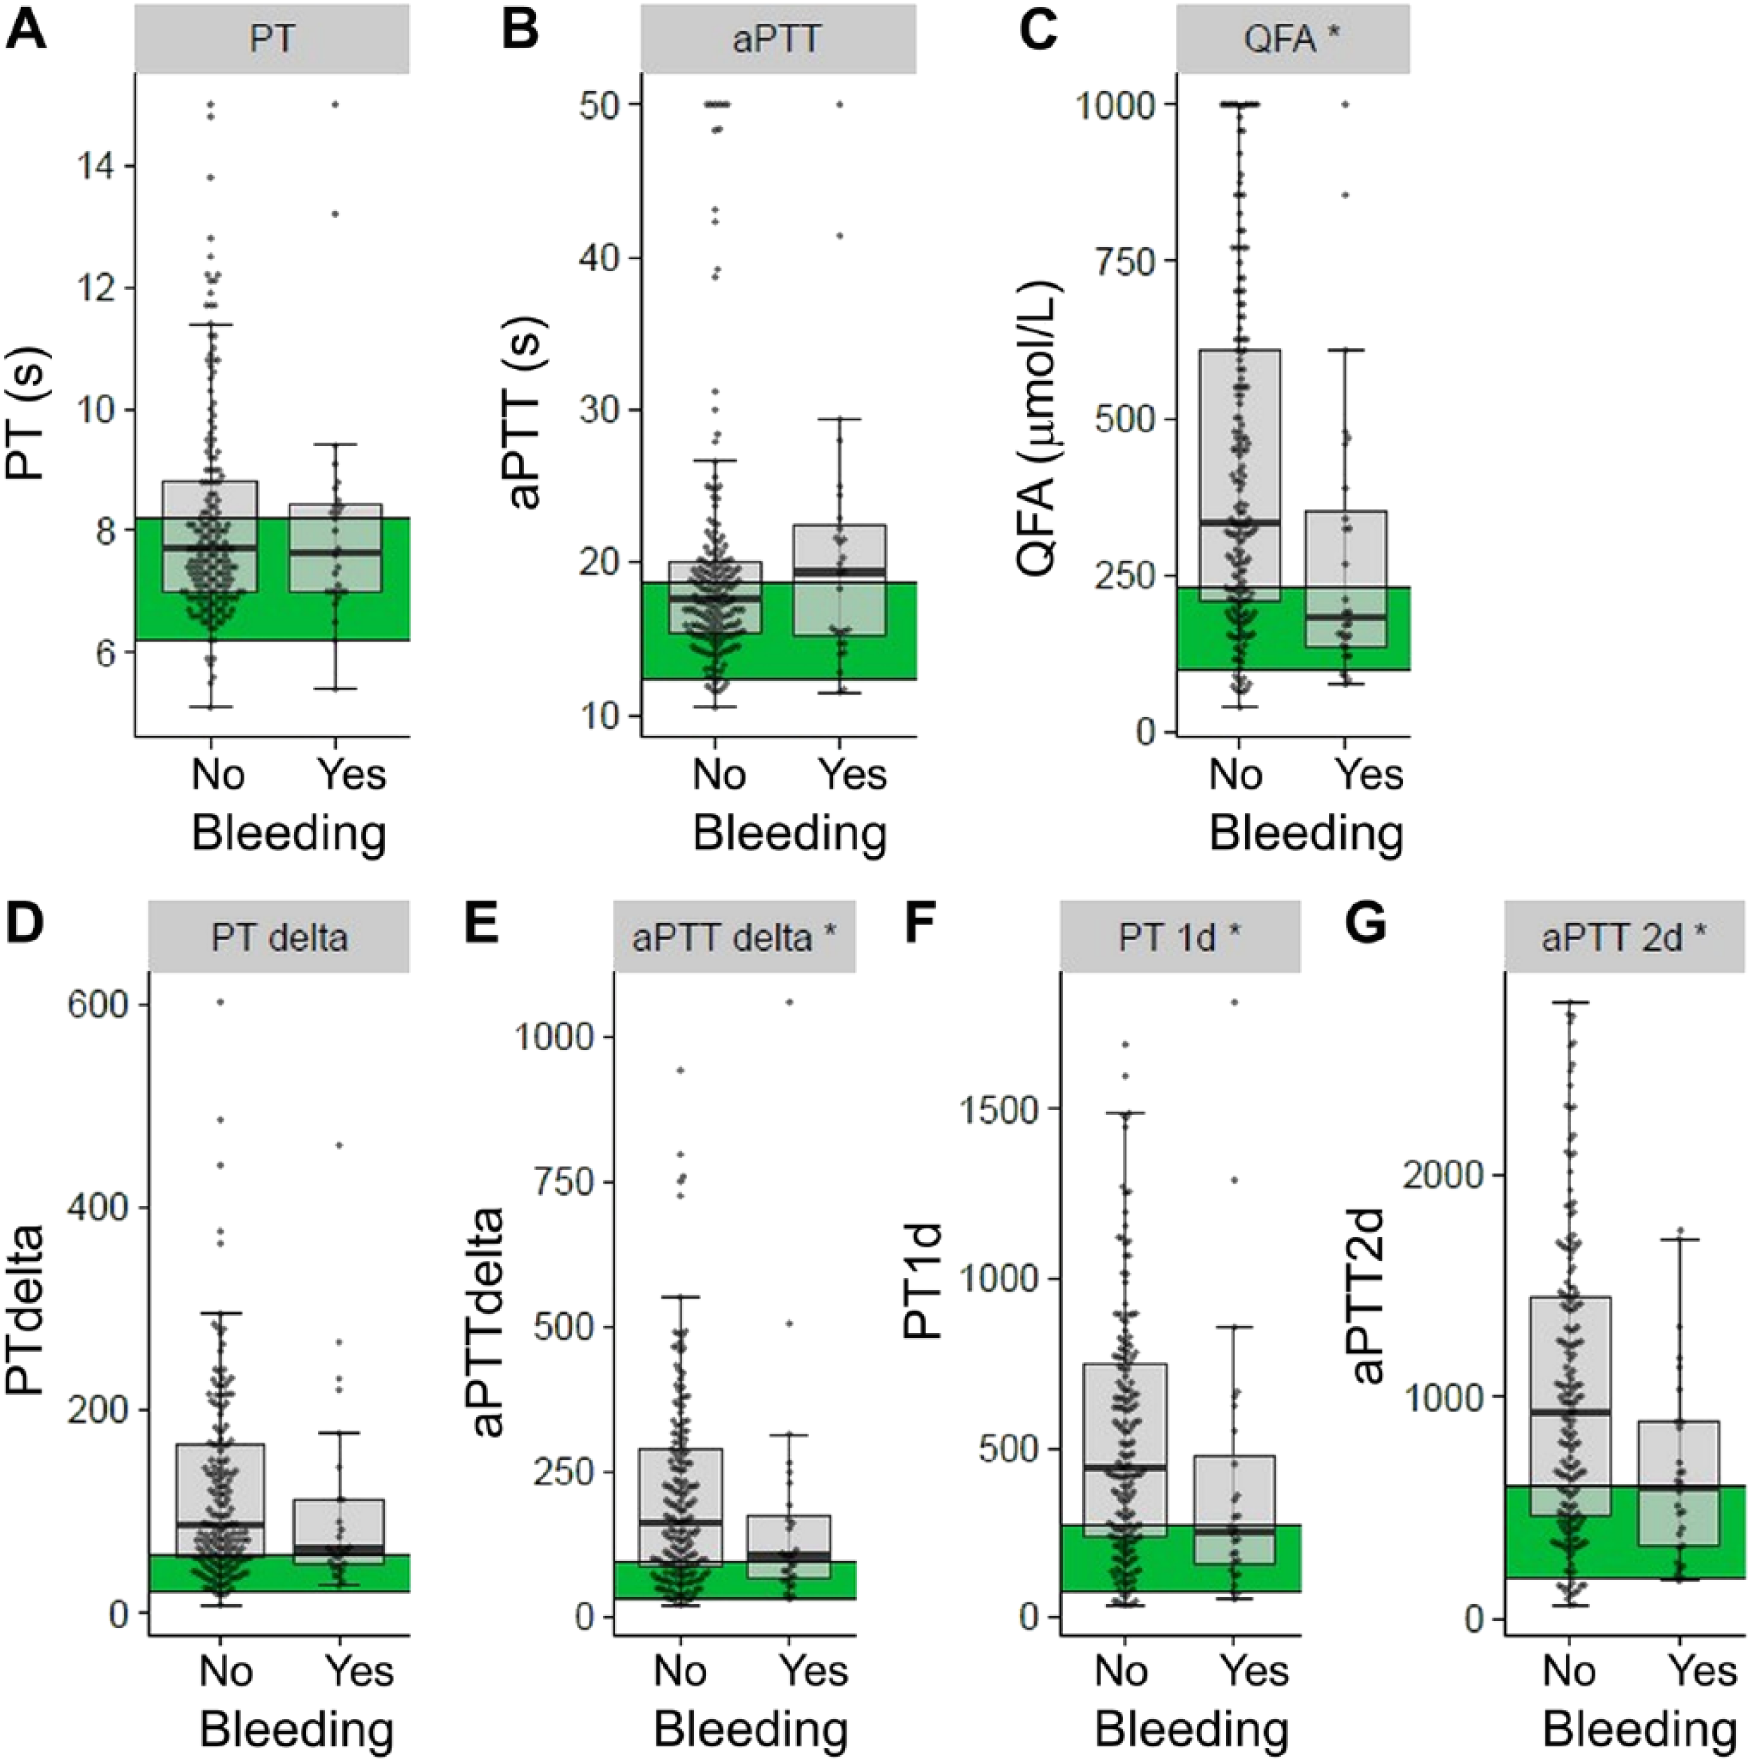
Box plots of distribution of the standard clotting tests (PT, aPTT), fibrinogen, and clot waveform analysis parameters (PTdelta, aPTTdelta, PT1d, and aPTT2d) in canine patients with (Yes) and without (No) clinically significant bleeding (n = 203). The line within each box represents the median, with the 25th (lower quartile) and 75th (upper quartile) percentiles represented by the lower and upper limits of each box, respectively. The horizontal black lines represent the limits of median ± 1.5 × interquartile range for each data set. Each data point is plotted on the graph as a gray dot. The green shaded region denotes the reference interval for each group. * p ⩽ 0.05 indicates statistical significance. aPTT = activated partial thromboplastin time; aPTT2d = peak maximum 2nd derivative of the aPTT clot curve; PT = prothrombin time; PT1d = peak 1st derivative of the PT clot curve; QFA = quantitative fibrinogen assay.
Discussion
We found a majority of dogs to have only slight agreement between SCTs and CWA in the categorization as hypocoagulable, hypercoagulable, or normal, suggesting that CWA results cannot be presumed consistently based on SCT data. In particular, finding high CWA values in dogs with SCT above RI was unexpected and deserves further study as a possible explanation for the poor correlation between prolonged SCT and abnormal bleeding.
Coagulation tests were requested by attending clinicians based on suspicion of an underlying coagulopathy or as a screening tool prior to performing invasive procedures. Despite this clinical suspicion, just over half of the dogs had normal PT and aPTT, although both low and high values were observed. A similar finding was reported previously in a study of 40 sick dogs that had coagulation panels performed, with the median PT being slightly below the RI and median aPTT within RI. 30 In a 2015 study of human patients undergoing elective surgery, PT and aPTT tests were found to be of low yield, given only 6–7%, respectively, were prolonged. 3 Our results suggest that CWA could complement SCT data, potentially contributing novel information to the laboratory evaluation of dogs with coagulation disorders.
In contrast to PT and aPTT, the majority of dogs had QFA, delta, and derivative values above the RI. QFA results likely reflect frequent underlying inflammation in this population of dogs, as well as variation in disease conditions incorporating differences in production and/or consumption of fibrinogen. This has been described in various diseases in human patients such as diabetes mellitus, inflammatory bowel disease, cardiovascular diseases, sepsis, and trauma.7,15 Fibrinogen was shown to be significantly increased in dogs with local inflammation, SIRS, or sepsis in a population of canine ICU patients. 51 Hyperfibrinogenemia has also been documented in various malignancies in humans and dogs, and has been associated with poor outcome.16,24,35,45,47,48,53 In humans, fibrinogen concentration has been shown to be positively correlated to CWA parameters independent of clotting times or other factors that influence plasma turbidity such as hemolysis or icterus. 38 Our findings suggest a less predictable relationship in hypofibrinogenemic dogs. This observation may have been influenced by bias resulting from the exclusion of hypofibrinogenemic dogs with uninterpretable clot curves and the small number of dogs in this category.
We found no statistically significant differences in PT or aPTT between dogs with or without bleeding. Given wide variation in observed values in both groups, the incidence of bleeding was similar regardless of whether SCT values were within, above, or below RI. Our SCT results are similar to those in several previous studies on coagulopathy in dogs. Dogs with spontaneous hemoperitoneum had significantly prolonged PT and aPTT compared with control dogs, but medians were within the RI. 6 However, in another study, prolongation of SCTs was not correlated to clinical bleeding in a group of dogs with DIC. 36 Although numerous guidelines recommend transfusion therapy when PT or aPTT values are prolonged >1.5 times baseline, evidence to support this practice is limited in both dogs and humans.3,12,17,22 Given that traditional coagulation tests were initially developed as in vitro screening tests for human patients with hemophilia, such tests poorly reflect in vitro hemostasis and are not useful predictors of bleeding.5,17,21,23,33,56
Most dogs in the bleeding group had normal but lower QFA (median within RI) than most dogs without bleeding (median above RI), although there was significant overlap. Theoretically, hypofibrinogenemia could decrease the kinetics and OD of the clot, implying hypocoagulability or hyperfibrinolysis, which can be reflected in decreasing maximal OD in the curve, which we did not specifically evaluate in our study. However, only 27% of dogs in our study that had a low QFA showed clinical signs of bleeding. In an experimental study in dogs in which acute hemorrhagic shock was induced, significant decreases in fibrinogen concentration were noted. 25 In another study, dogs with ascites were shown to have significantly decreased fibrinogen concentrations and significantly increased plasma D-dimer and C-reactive protein concentrations, suggesting that dogs with transudative, exudative, or hemorrhagic ascites had primary hyperfibrinolysis. 59 Alternatively, hyperfibrinogenemia may have facilitated more robust coagulation regardless of other factors involved in the process.
In contrast to PT and aPTT, 3 of 4 CWA parameters (aPTTdelta, PT1d, and aPTT2d) were statistically significantly different between dogs with and without bleeding, with higher values in non-bleeding group suggesting that dogs in the non-bleeding group were either normal or had relative hypercoagulability (medians above RI). Interestingly, very few bleeding dogs had values below the RI. Given the wide overlap in CWA values between bleeders and non-bleeder groups in our study, CWA could not be used to clearly distinguish between the 2 groups in this heterogeneous population of dogs. Some of the wide variation in CWA values is likely attributable to the heterogeneity of the population with regard to underlying disease, pathophysiology, and aspects of in vivo coagulation not specifically evaluated in our study. In our previous manuscript, CWA patterns were found to differ among individual coagulation disorders (DIC, rodenticide toxicity, liver failure, and post hepatic cholestasis). 36 In humans, aPTT2d was strongly negatively correlated to aPTT, with mean aPTT2d significantly decreased when aPTT was prolonged rather than when it was normal. 46
The International Society on Thrombosis and Haemostasis subcommittee on the standardization of CWA provided recommendations on its clinical application and research for human medicine; however, similar recommendations in veterinary medicine do not exist because work in this area is currently very limited. 41 CWA parameters have been reported to aid the diagnosis and treatment of human hemophilia, DIC, sepsis, and for acquired anti–factor V inhibitors.4,12,13,27–29,40,42–44,49,50 Our study suggests that CWA parameters can provide information distinct from SCT and should be further evaluated as a potential laboratory tool in patients with both normal and abnormal clotting times.
Our study has various limitations, including its retrospective nature. Retrospective studies often fail to optimally control for some pre-analytical factors that influence coagulation results; however, such factors were minimized in our study by having samples collected from dogs within our hospital under stringent laboratory submission, sample evaluation and rejection, and performance guidelines. The inclusion criteria were intentionally broad to encompass a wide variety of clinical presentations and requirements for coagulation testing in order to determine the potential value of having CWA data as supplementary information to SCT. Although valuable in answering this question, the heterogeneity of the population also likely contributed to significant variation in the results and may have masked clearer patterns in smaller, more homogeneous groups with disease stratification. Criteria for major or significant bleeding were adapted from a human trial and may not apply well to veterinary patients; however, bleeding definitions have not yet been standardized in veterinary medicine. 55 Given that the classification as clinically relevant bleeding required adequate documentation in the medical records, the retrospective nature of our study provided some limitations in obtaining accurate information. In addition, although the median platelet count in study dogs was within RI, the range of values reflected a population that included dogs with clinically significant thrombocytopenia and thrombocytosis. Although SCT and CWA were analyzed using platelet-poor plasma, we did not specifically evaluate a potential role for platelets to impact the relationship between SCT and CWA parameters.
The purpose of our study was to evaluate the association between SCT and CWA without disease stratification; however, future prospective studies are needed to evaluate the diagnostic performance of CWA in specific canine coagulopathies to determine their value in assessment of the coagulation status of dogs, especially in light of the known limitations of SCT in predicting risk of bleeding. Additionally, visual qualitative analysis of the waveform was not performed in our study given lack of information regarding the interpretation of abnormalities in specific diseases in veterinary patients, but has been shown to have diagnostic value in human patients with DIC or sepsis.4,29,38,49,50 Future studies of canine coagulopathies could incorporate this aspect of analyses.
Footnotes
Acknowledgements
We thank the staff at the Veterinary Clinical Pathology Laboratory at the University of Minnesota for providing technical advice and assistance with data collection.
Declaration of conflicting interests
The authors declared no potential conflicts of interest with respect to the research, authorship, and/or publication of this article.
Funding
The authors received no financial support for the research, authorship, and/or publication of this article.