
Abstract
The aim of the current study was to determine canine reference intervals for prothrombin time (PT), activated partial thromboplastin time (APTT), fibrinogen, and antithrombin (AT) according to international recommendations. The STA Satellite® coefficients of variation of within-laboratory imprecision were 3.9%, 1.3%, 6.9%, and 5.1% for PT, APTT, fibrinogen, and AT, respectively. At 4°C, citrated specimens were stable up to 8 hr for whole blood and 36 hr for plasma, except for APTT, which increased slightly (<1 sec). Nonparametric reference intervals determined in citrated plasma from 139 healthy fasting purebred dogs were 6.9–8.8 sec, 13.1–17.2 sec, 1.24–4.30 g/l, and 104–188% for PT, APTT, fibrinogen, and AT, respectively. Based on Passing–Bablok comparison between STA Satellite and STA-R Evolution® using 60 frozen specimens from a canine plasma bank, the corresponding reference intervals were transferred to the STA-R Evolution: 7.1–9.2 sec, 12.9–17.3 sec, 1.20–4.43 g/l, and 94–159% for PT, APTT, fibrinogen, and AT, respectively.
Keywords
Introduction
There are few studies in the veterinary literature on reference intervals for coagulation markers of dogs, and most of the studies do not meet international recommendations such as defined in the International Federation of Clinical Chemistry and Laboratory Medicine (IFCC) and the Clinical and Laboratory Standards Institute (CLSI) guidelines. 2 Introduction of a new analyzer into the laboratory was the opportunity to make a proper a priori determination of coagulation test reference values in dogs, which may be further used for transference in other sites after proper verification using the new recommendations. 2 The current study was based on the 13-step procedure recommended by IFCC-CLSI and involved a reference sample representative of the canine population in France, according to the breed distribution reported by the Société Centrale Canine (http://www.scc.asso.fr/mediatheque/statistiques, accessed January 2008). The 4 analytes studied were chosen because they concerned the coagulation tests most frequently requested at the Central Laboratory of the clinics of the Ecole Nationale Vétérinaire de Toulouse (Toulouse, France).
The present study therefore consisted of determining the reference interval for prothrombin time (PT), activated partial thromboplastin time (APTT), fibrinogen, and antithrombin (AT) in purebred healthy dogs with the STA Satellite® analyzer a according to international recommendations. The reference intervals thus determined were transferred to another laboratory in the same city, using the same reagents but a different analyzer, namely, the STA-R Evolution® analyzer. a
Material and methods
The current study was performed between October 2007 and March 2008. Before each run of analyses, the STA Satellite analyzer was checked according to the manufacturer's recommendations. a Analyses were performed by coagulometric method for PT, APTT, and fibrinogen, and by a colorimetric test for AT. Reagents and characteristics of the techniques are summarized in Table 1. Where necessary, a veterinary configuration of the analyzer's software performed automatic dilutions, thereby increasing the standard human analytical ranges for the lowest and highest values.
As canine control solutions are not available for coagulation testing, the accuracy and imprecision of the STA Satellite analyzer were assessed with 2 human control solutions (STA Coag Control N + P) a according to the CLSI (formerly NCCLS). 11 Duplicate measurements of each control solution were done in the morning and afternoon for 5 consecutive days. Repeatability in canine plasma was evaluated from the duplicate results obtained for each analysis.
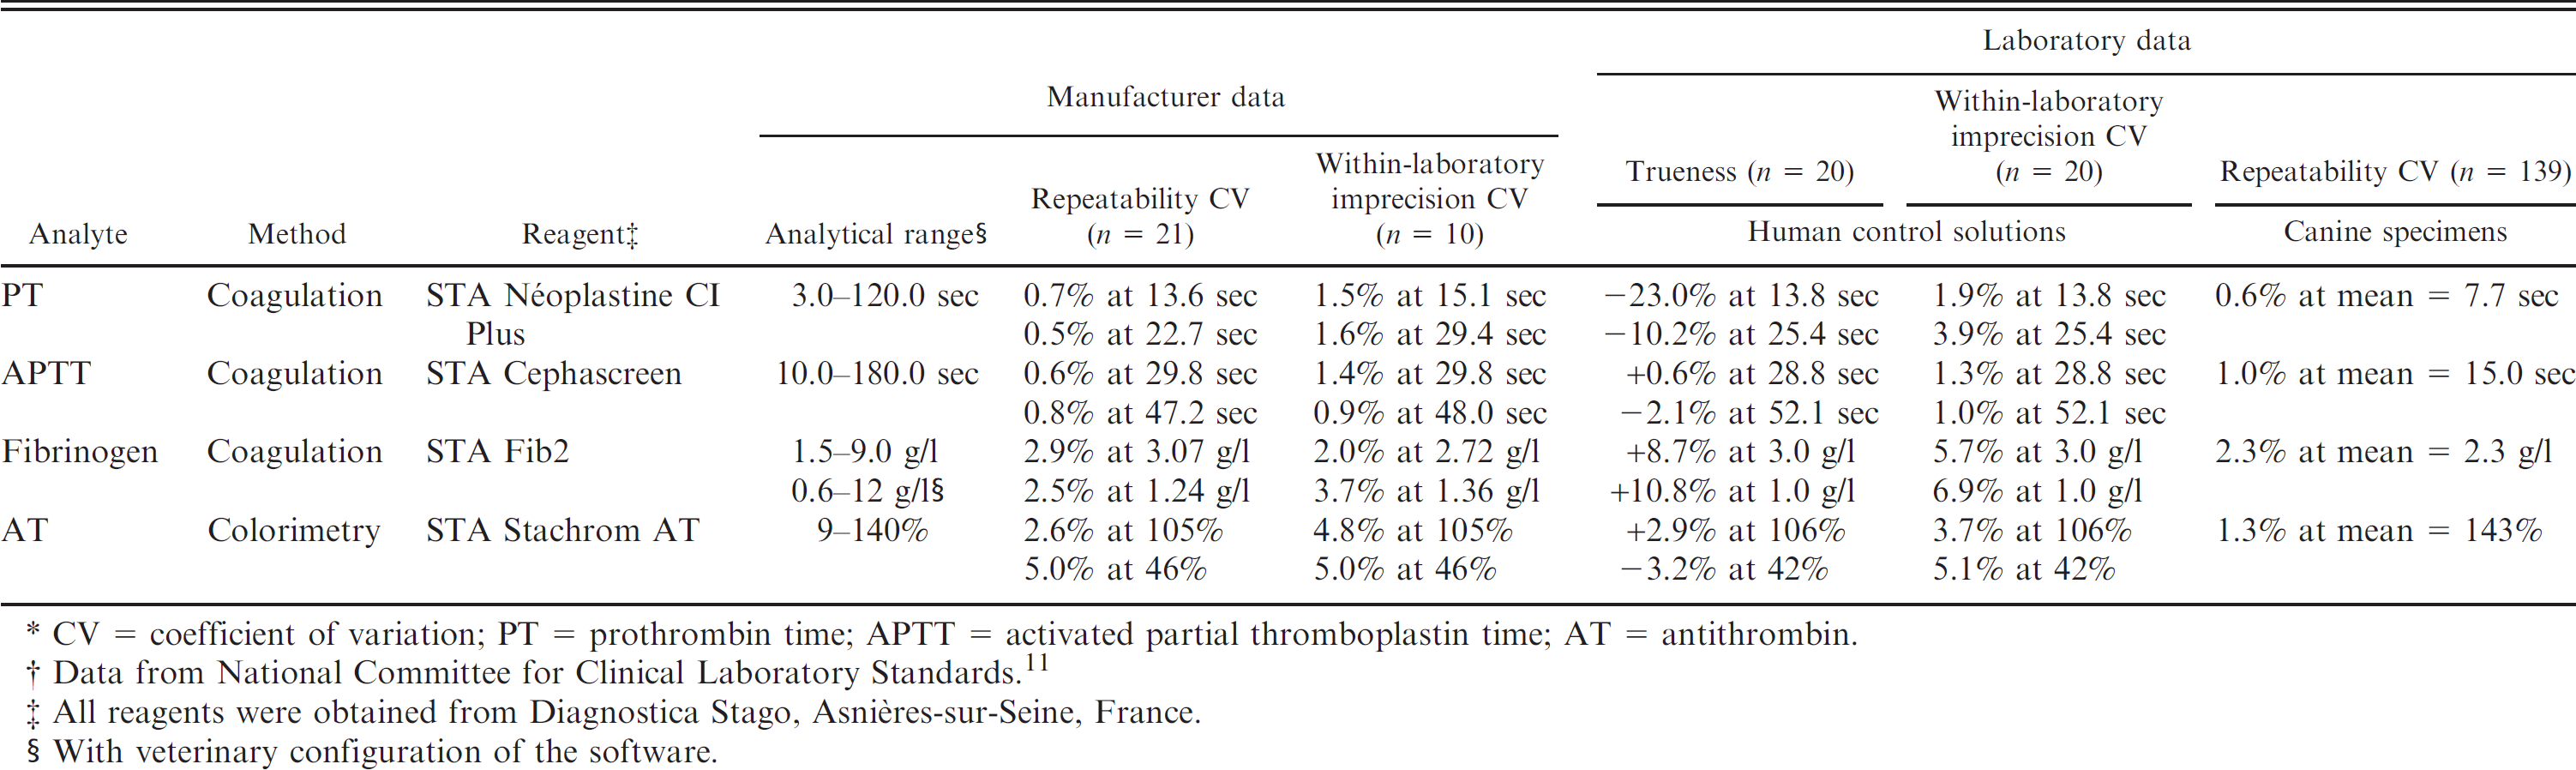
CV = coefficient of variation; PT = prothrombin time; APTT = activated partial thromboplastin time; AT = antithrombin.
Data from National Committee for Clinical Laboratory Standards. 11
All reagents were obtained from Diagnostica Stago, Asnières-sur-Seine, France.
With veterinary configuration of the software.
All canine specimens were collected from the jugular vein of overnight-fasted dogs into a 1.8-ml 3.8% Na3 citrate vacuum tube with a 0.8 mm × 40 mm needle. b The specimens were gently inverted 10 times, identified, and then stored at 4°C until centrifugation for 15 min at 1,300 × g. c Because of the distance of certain breeding locations, the maximum time before centrifugation and subsequent analyses was 7.5 hr, with most analyses being performed within 4 hr of sampling. Reference intervals were determined in a reference sample group composed of 139 dogs selected according to the following inclusion criteria: 1) purebred dogs (registered in the Livre des Origines Français) directly sampled at the breeder's kennel, 2) healthy animals (questionnaire and physical examination), and 3) dogs fasted overnight.
The proportions of the different breeds in the sample group were as representative as possible of the proportions of the breeds in the French canine population. When more than 5 dogs had to be sampled in a single breed, they were taken from at least 2 different owners. Exclusion criteria were incorrect sampling or filling of the tube, abnormal color of plasma, any reported illness in the month preceding sampling, abnormal bleeding, any treatment (except external antiparasitic), and nonfasted dogs.
Normality of distributions was tested by Anderson–Darling test, and reference intervals were determined by the nonparametric method according to IFCC-CLSI recommendations, 2 which is based on the ranking of the 2.5 and 97.5 percentiles. Because part of the present study required sample transport from the dog breeding establishments to the laboratory, stability of the analytes had to be tested in a preliminary study. Aliquots of 6 citrated canine whole blood specimens were analyzed by taking duplicate measurements within 1 hr of sampling, and after storage of whole blood for 4 hr and 8 hr at 4°C. Centrifugation was performed just before each run of analyses. Aliquots of 6 citrated canine plasma specimens were also analyzed by taking duplicate measurements within 1 hr of sampling, and then after storage for 12, 24, and 36 hr at 4°C. Transference of the reference intervals was based on a procedure of method comparison 5,10 using 60 canine specimens obtained from the plasma bank of the Central Laboratory. All calculations were performed with an Excel spreadsheet, a statistical analysis software, d and the freeware Reference Value Advisor (http://www.biostat.envt.fr/spip/spip.php?article63) for the determination of reference intervals.
Results
The within-laboratory imprecision and repeatability coefficients of variation (CVs) of the STA Satellite in the laboratory were similar or slightly higher than the manufacturer's indications. Bias was low except for PT in the “P” control solution and for fibrinogen (up to 10.8% bias; Table 1). There was no statistically significant change of the analytes in whole blood stored up to 8 hr and in plasma stored up to 36 hr at 4°C (Wilcoxon test, with Bonferroni correction for multiple comparisons, P > 0.05), except for APPT, which was slightly (<1 sec) but significantly increased in whole blood at the eighth hour and in plasma at the 36th hour (Wilcoxon test, P = 0.03).
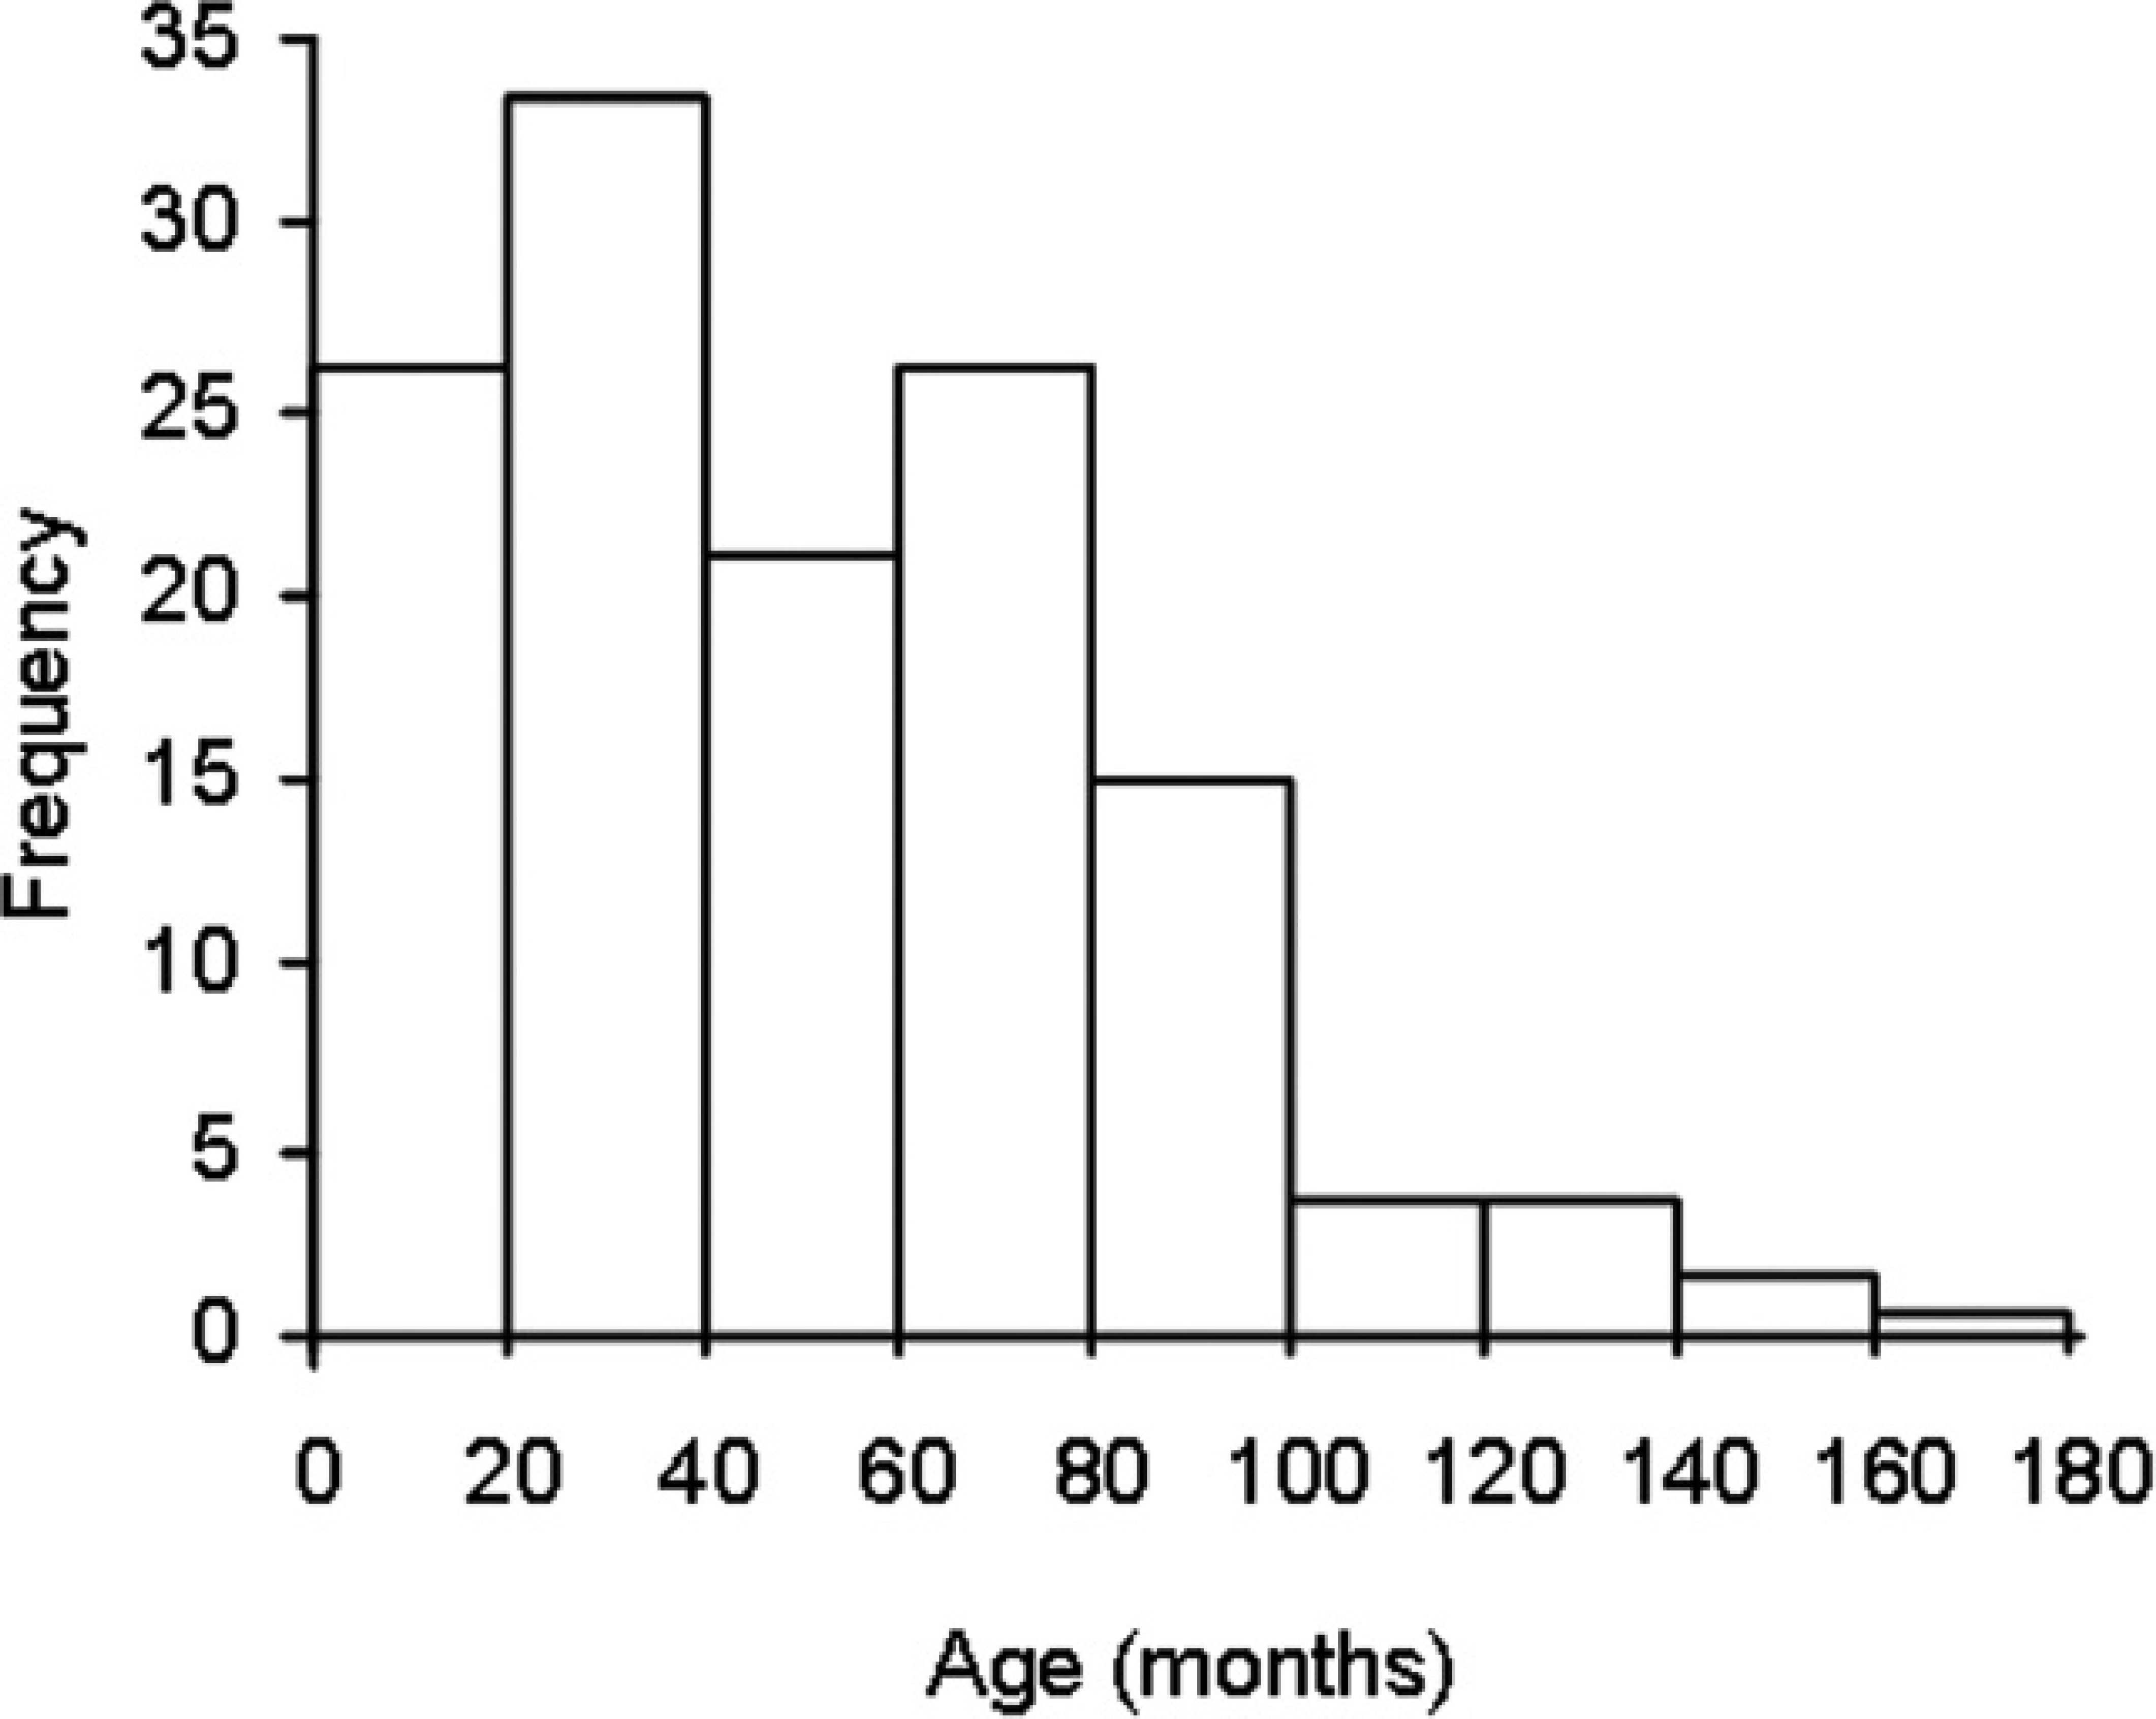
Distribution of ages of the 139 dogs used in the study of reference values of coagulation tests.
The main breeds of dog were Brittany (14), German Shepherd Dog (12), Labrador Retriever (10), Belgian Malinois (10), Yorkshire Terrier (9), Rottweiler (9), French Bulldog (9), and Australian Shepherd (9). There were 88 females, 2 spayed females, and 49 males. Ages ranged from 1 to 14 years (Fig. 1). The distributions of the 4 analytes in the reference sample group are presented in Figure 2. There was no outlier according to the Dixon–Reed criterion. 14 The AT distribution was not significantly different from Gaussian. All other distributions could be transformed into Gaussian, except for PT, which remained significantly different after all transformations tested. The best fit for PT was obtained by Box–Cox transformation (Anderson–Darling test, P = 0.014). Descriptive statistics with the corresponding reference intervals are summarized in Table 2. The nonparametric reference intervals thus determined were 6.9–9.0 sec, 13.1–17.7 sec, 1.24–4.62 g/l, and 104–188% for PT, APTT, fibrinogen, and AT, respectively. Partitioning according to sex was not relevant according to Harris–Boyd criterion, 4 even though the AT values were significantly lower in males than in females (Student's t-test after checking for homogeneity of variances, P = 0.002) with means of 136% and 147%, respectively. There were not enough values in each subgroup to make partitions according to age or breed.
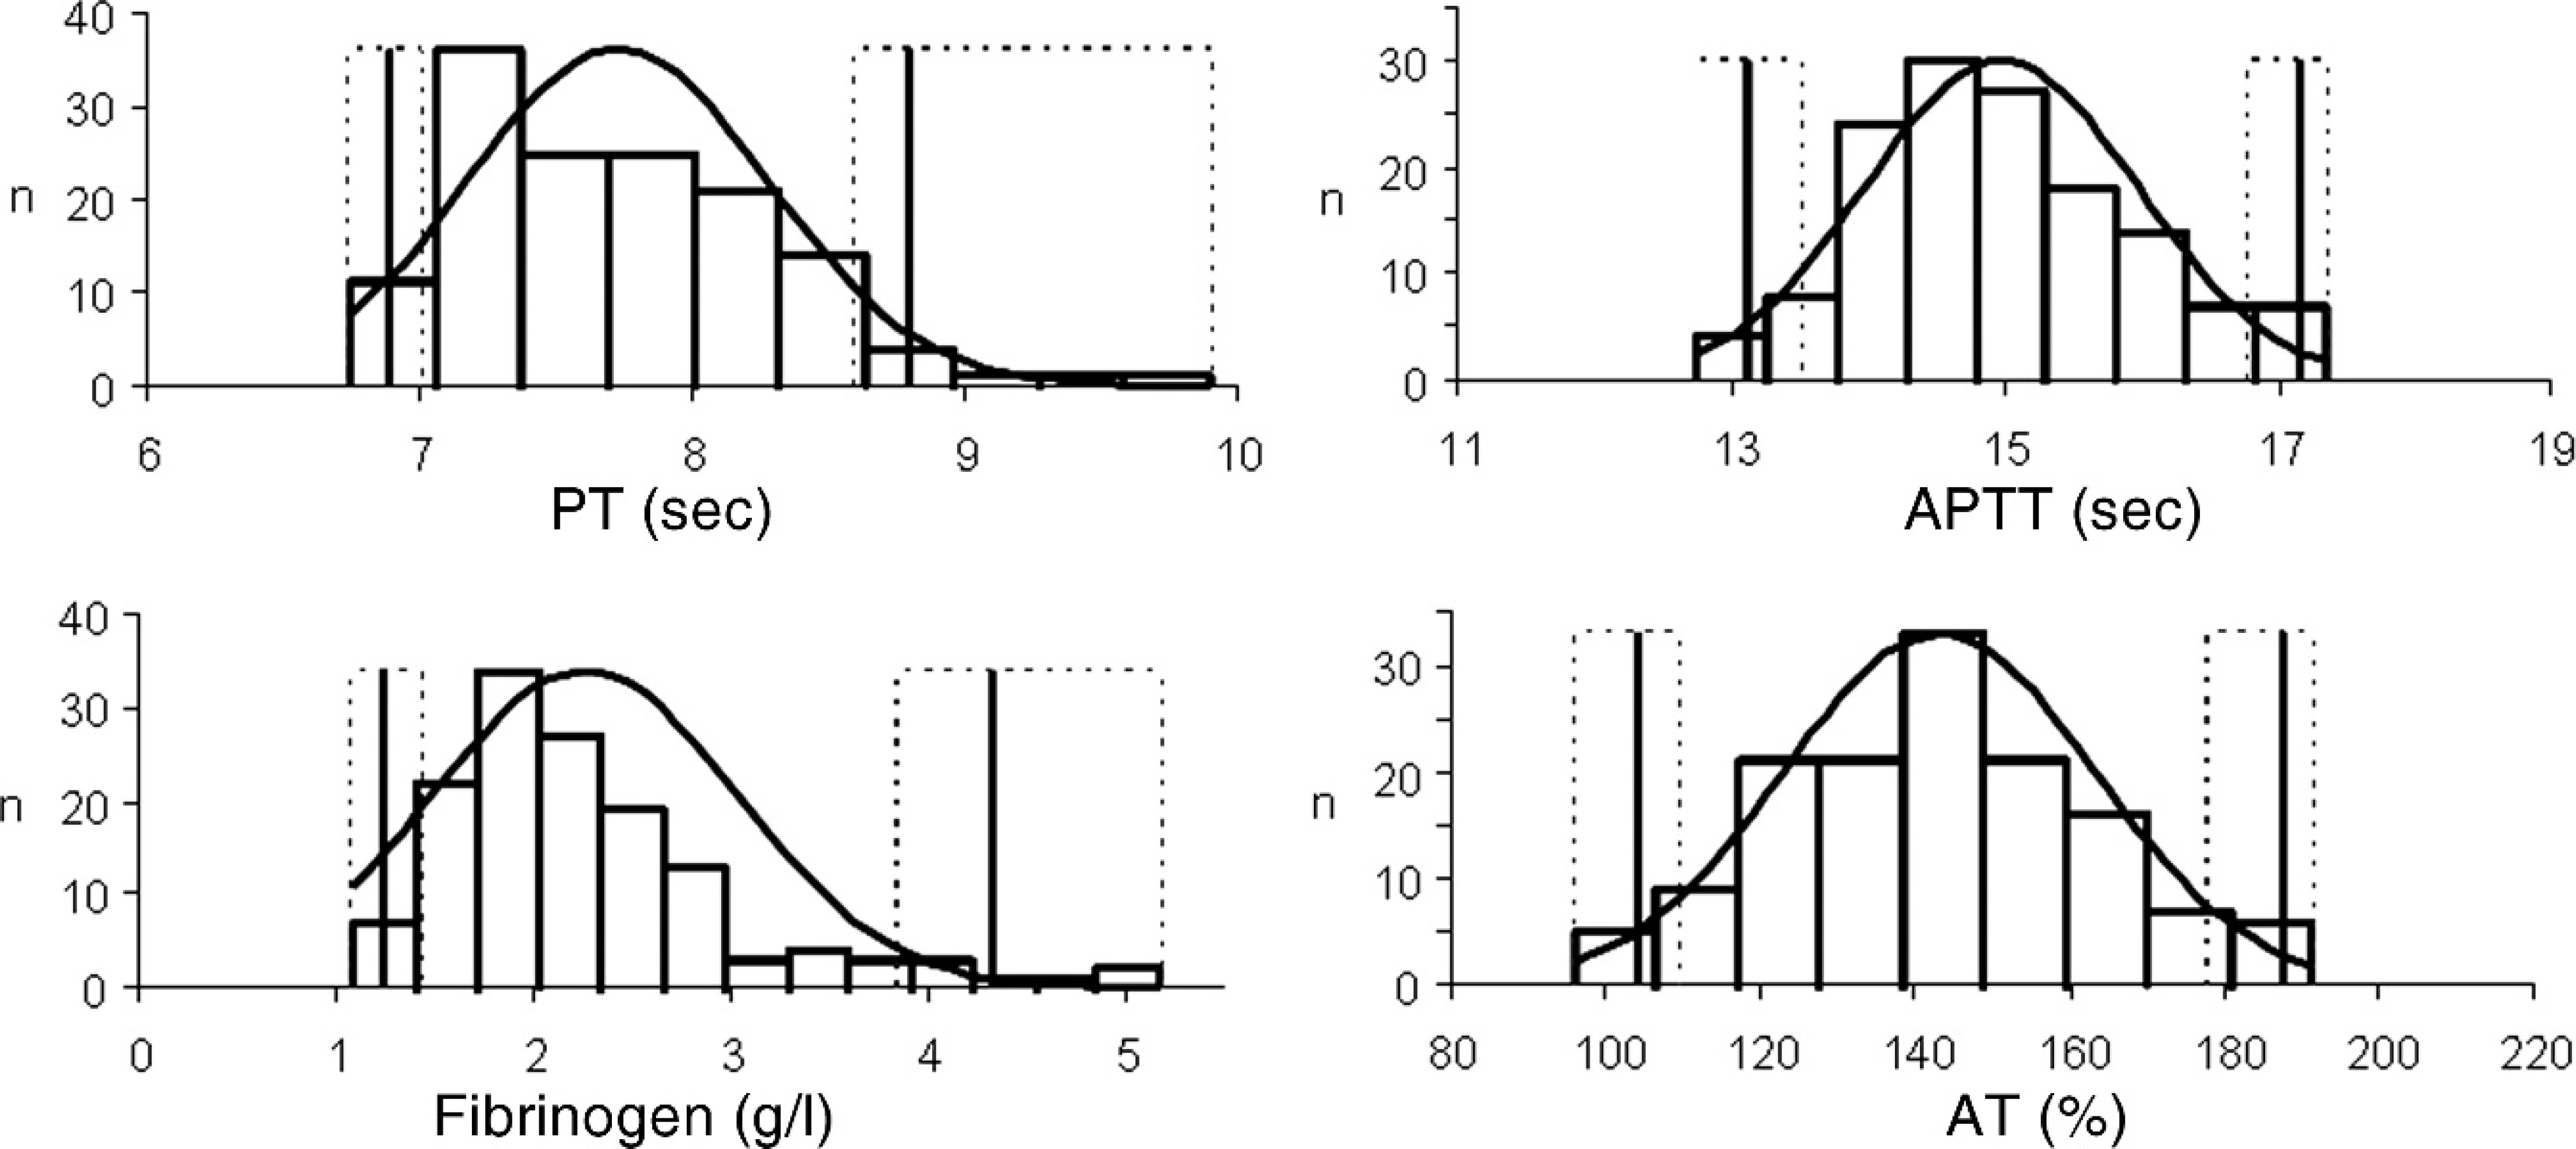
Histograms of prothrombin time (PT), activated partial thromboplastin time (APTT), fibrinogen, and antithrombin (AT) in 139 healthy dogs (black curve: Gaussian curve; vertical lines: reference limits with 90% confidence intervals).
For transference of the reference intervals to the STA-R Evolution analyzer, the results of some comparison analyses could not be obtained for technical reasons, so comparison was based on at least 53 paired analyses (Table 3). For AT, there was good correlation but a combined bias, with the results by STA-R Evolution being approximately 12% lower than with STA Satellite. Passing–Bablok equations were applied to the previously determined reference intervals to transfer reference intervals for the STA-R Evolution (i.e., 7.1–9.2 sec for PT, 12.9–17.3 sec for APTT, 1.20–4.43 g/l for fibrinogen, and 94–159% for AT).
Descriptive statistics and reference limits of prothrombin time (PT), activated partial thromboplastin time (APTT), fibrinogen, and antithrombin (AT) in 139 healthy dogs, and characteristics of the distributions. *
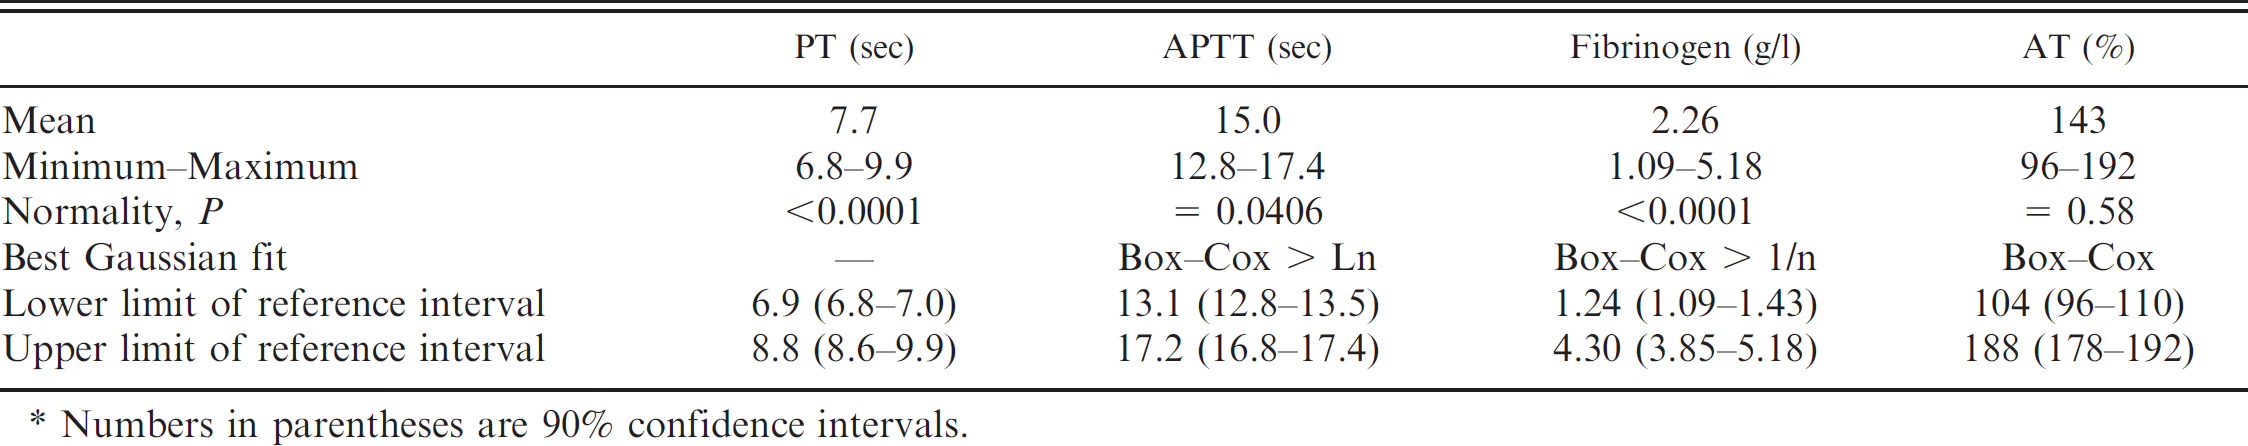
Numbers in parentheses are 90% confidence intervals.
Discussion
The pre-analytical conditions were chosen according to recommendations for coagulation testing in human clinical pathology. 1,13 These conditions are routinely used in veterinary clinical pathology; although, to the authors' knowledge, they have never been validated except for absence of a significant effect of citrate concentration between 3.2% and 3.8%, 8 lack of effect of sampling by direct venipuncture or through a catheter, 7 significant effect of abnormal colors of plasmas, 9 and of dehydration. 12
Prothrombin time, APTT, and fibrinogen are almost unchanged in canine plasma stored for up to 2 days at room temperature or at 4°C, 3 which is longer than the delays recommended for human specimens. 1 The durations of storage tested in the current study were chosen according to the actual conditions of the experiment where blood specimens collected at the individual breeders' locations usually arrived at the laboratory after less than 4 hr and, in a very few cases, after up to 7.5 hr. According to the results of the stability study, PT, fibrinogen, and AT would not have been altered even after 7.5 hr, but a moderate increase of APTT might have occurred. The latter change did not exceed the 90% confidence intervals of the reference limits, thus it should have no clinical relevance, which is the reason why the results were included in the study. Finally, the testing of plasma storage up to 36 hr was unnecessary: this had been done in case analyses needed to be postponed because of a technical difficulty.
Comparison of results obtained with the STA Satellite and the STA-R Evolution analyzers. *
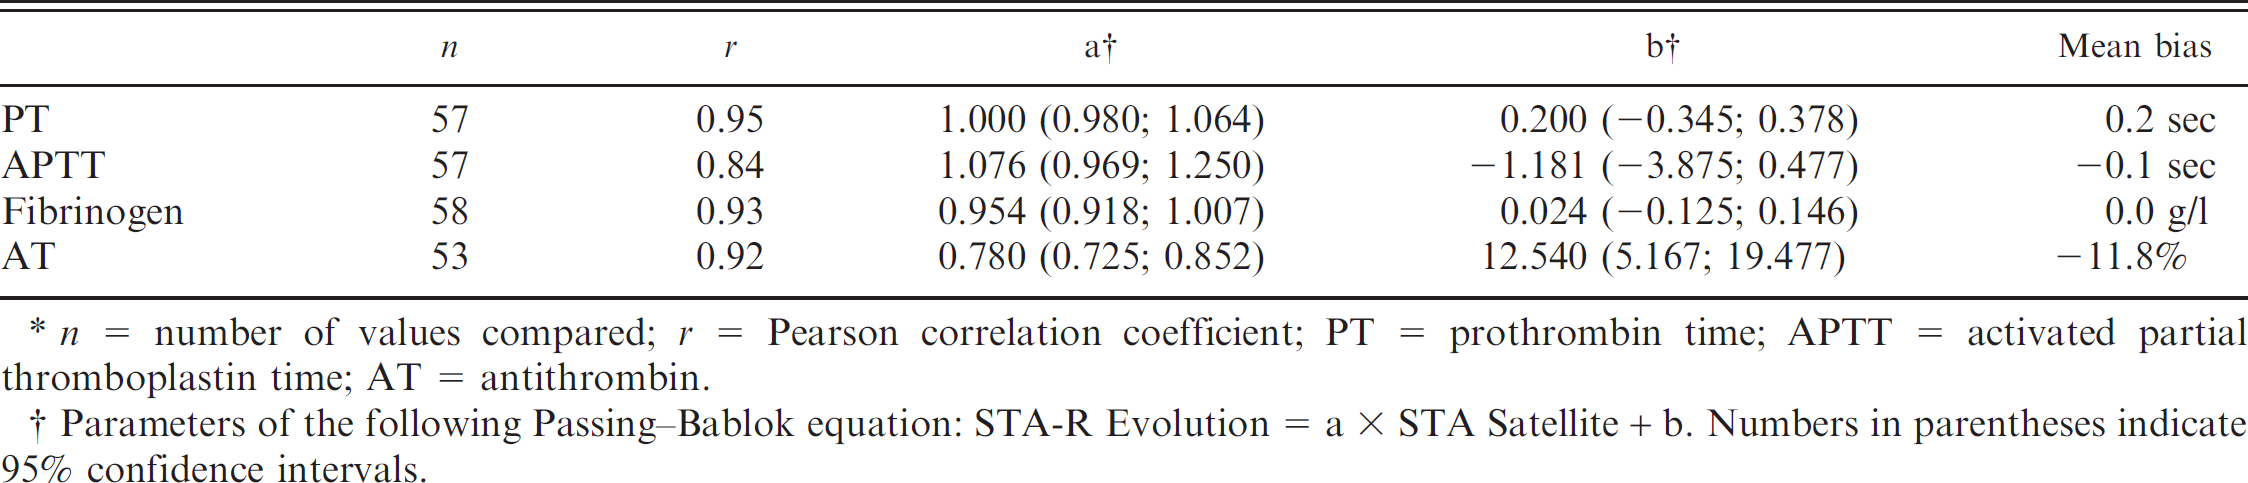
n = number of values compared; r = Pearson correlation coefficient; PT = prothrombin time; APTT = activated partial thromboplastin time; AT = antithrombin.
Parameters of the following Passing–Bablok equation: STA-R Evolution = a × STA Satellite + b. Numbers in parentheses indicate 95% confidence intervals.
Selecting the reference sample group according to “well-defined criteria” is the most difficult task when establishing reference intervals. The aim of selection is to make the reference individuals “as comparable to the patients as possible, except for the disease.” 6 In the current study, an attempt was made to match the canine population in France by selecting dogs according to prevalence of the main breeds and by not taking more than 5 animals from the same breeder to avoid a “family” effect. There remained 3 biases. The first one is the arbitrary choice to sample only purebred animals. This was based on the fact that, to the authors' knowledge, the proportions and types of crossbreeds are not reported in the veterinary literature, thus determining the corresponding reference sample group was hazardous. Moreover, crossbreeds reflect the mixing of different breeds, and it can be expected, but not proven, that values in crossbreeds fall somewhere within values obtained in purebred dogs. The second bias is the sex ratio, which is close to 2 females for 1 male in this sample group. This results from the authors' choice to sample dogs from breeders who have more females than males. This ratio is much higher than usually reported in the general canine population, but this should have had very little influence on the reference intervals as Harris–Boyd test showed that no partitioning according to sex should be applied. The third bias is because all specimens were collected from breeders within approximately 200 km of the authors' laboratory, both to ensure the stability of the specimens and allow rapid analyses on the day of sampling. It is likely that this “geographic” sampling bias had little effect on the reference interval results as populations of dogs have not been reported to differ notably between different regions of France.
The reference intervals were determined as recommended 2 by the nonparametric method. Except for AT, the distributions were statistically different from Gaussian, which might explain some of the differences with values previously reported for coagulation tests in dogs, which were mostly based on parametric approaches.
The transfer of the reference intervals from STA Satellite to STA-R Evolution is only a palliative method. It is recommended by IFCC-CLSI when reference populations can be expected to be identical, which was the case in the present study. However, there were some discrepancies in the results obtained by the 2 analyzers especially for AT, which may lead to a greater imprecision of the limits thus calculated for STA-R Evolution.
It has been reported that significant differences in coagulation test results could be due to the use of different reagents, especially for APTT. This supports the claim that each laboratory should determine its own reference interval for its specific conditions. However, such determinations are mostly performed from small samples with unverifiable assumptions about the underlying distributions. According to IFCC-CLSI, “individual laboratories should focus more on verifying reference interval established elsewhere.” 2 In the present case, the reference limits determined in a sufficient number of dogs with the nonparametric method can be used for validation studies involving a limited number of specimens, as indicated by IFCC-CLSI. 2
The reference intervals determined in the current study are similar to previously reported values, except for AT. This is due to the calibration of the techniques. In some studies, control dogs were used to determine the “normal” (i.e., 100%), after which the measurements were compared with this calibration, resulting in values centered on 100%. In other studies, including the present one, calibration was based on the use of a human calibration solution. The use of human calibrators has 2 major consequences: 1) it produces a bias, and 2) it probably results in a better transferability of results, as no canine calibrator is available to the authors' knowledge, and human calibrators are readily available and comparable in all settings.
According to IFCC-CLSI guidelines, the canine reference intervals determined in the present study can be used without prior validation by users of these 2 analyzers with the same manufacturer's reagents, for animals that fall into the same age range, and where the proportions of the canine breeds are almost identical to those in France. In other countries or with other analyzers or reagents, validation should be performed.
Acknowledgements
The authors are grateful to J. M. Palis and H. Doury (Diagnostica Stago Company) for technical help. Results partially presented at European Society of Veterinary Clinical Pathology Congress, Barcelona, Spain, September–October 2008. Reagents were offered by the manufacturer, who was not involved in study design, analyses, data interpretation, writing the manuscript, or the decision to submit for publication.
Footnotes
a.
Diagnostica Stago, Asnières-sur-Seine, France.
b.
Venoject®, Terumo Europe N.V., Leuven, Belgium.
c.
Rotofix 32A, Andreas Hettich GmbH & Co. KG, Tuttlingen, Germany.
d.
Analyse-it for Microsoft Excel (version 2.10), Analyse-it Software Ltd., Leeds, United Kingdom.