
Abstract
Since the identification of species Porcine circovirus 2, the relevance of genus Circovirus has increased given its impact on the swine industry. A new species (Porcine circovirus 3, PCV-3) has been detected in association with various clinical conditions. Consequently, there is an urgent need for reliable and widely accessible tests for both routine diagnostic and research purposes. We developed a direct PCR (requiring no DNA extraction) and a quantitative (q)PCR targeting the conserved rep gene to detect the PCV-3 genome. Test performance was assessed by testing 120 field samples within different matrices. Both methods were sensitive (detection of 10 viral genome/µL), specific, and repeatable. The substantially perfect agreement between the 2 assays strongly supports their high sensitivity and specificity. The low cost and short processing time of the direct PCR protocol, together with the reliable quantitative results provided by qPCR, support the establishment of common testing guidelines.
Introduction
Members of the Circoviridae family in the Circovirus genus are nonenveloped, icosahedral DNA viruses with a single-stranded circular genome of ~1.8–2 kb. Until the beginning of the 1990s, the relevance of this genus was limited to avian species, including species Beak and feather disease virus (BFDV), Pigeon circovirus (PiCV), and Goose circovirus (GoCV), which are responsible for clinically relevant diseases. 23 More recently, circoviruses have been proven to infect several host species belonging to different animal classes. However, their causative role in overt clinical disease is still unclear in most instances. 4 A remarkable exception is represented by species Porcine circovirus 2 (PCV-2), which has been identified as one of the major threats to the swine industry. 20 Several studies performed over time have demonstrated viral evolution capabilites 11 and high genetic diversity, particularly of the capsid gene.3,10 Such fast evolution is likely the result of natural immunity and vaccine-induced selective pressures. 12
In 2016, a new porcine circovirus species (Porcine circovirus 3, PCV-3) was detected in the United States,18,19 followed by detection in China, 26 Europe, 22 and Korea, 16 leading to the hypothesis of worldwide distribution. Despite low identity with PCV-2 at both the nucleotide and amino acid (aa) levels, PCV-3 appears to share a similar genome organization. To date, 3 open reading frames (ORFs) have been identified in its genome. ORF1 putatively encodes a 297-aa protein highly related to Circoviridae replicase (rep). ORF2 is located in the viral complementary strand in opposite sense from the rep gene and encodes a 214-aa capsid (cap) protein. The function of ORF3, which is related to murid herpesvirus M169 (of species Murid betaherpesvirus 1), is still unknown. 18
PCV-3 has been detected in pigs suffering from several clinical syndromes, including porcine dermatitis and nephropathy syndrome, reproductive disorders, respiratory disease,15,18,21 and myocarditis. 19 The presence of PCV-3 genome and/or antigen has been documented by several authors within histologic lesions in diseased animals, in the absence of other pathogens, 18 thus pointing to a potential role in several clinical conditions. PCV-3 has been detected in several tissues,19,26 serum, 22 and semen. 15 Moreover, it has been detected in the reproductive tract and in aborted fetuses. 26
Circulation of PCV-3 has also been reported in asymptomatic animals, 26 and definitive confirmation of its etiologic role is still lacking. Similarly, little, if any, information is available about PCV-3 epidemiology, the relevance of co-factors, the dynamics of viral infection, or disease pathogenesis.
Given the current paucity of data, and because of biologic, genomic, and epidemiologic similarities with PCV-2, it is important to validate rapid, reliable, and cost-effective tests that could be implemented both for diagnostic and research purposes. We describe herein the development and analytic validation of 2 PCR-based assays for detection of PCV-3: a direct PCR and a quantitative (q)PCR assay. A collection of field samples within different matrices was used to explore the performance of the assays.
Materials and methods
Positive control
Because PCV-3 sequences but no isolates were available, the full genome of PCV-3 (kindly provided by Dr. B. Hause, Kansas State University, Manhattan, KS) was chemically synthesized (GenScript Biotech, Piscataway, NJ) and cloned in a pUC57-Kan plasmid. Chemically competent Escherichia coli (One Shot TOP10, Thermo Fisher Scientific, Waltham, MA) were then transformed and selected by growth in a kanamycin-enriched lysogeny broth culture medium. Successful transformation and plasmid insertion were confirmed by single-colony DNA amplification and sequencing using the M13F (5’-GTAAAACGACGGCCAGT-3’) and M13R (5’-GCGGATAACAATTTCACACAGG-3’) primers, flanking the insertion site. Plasmid DNA was purified (QIAprep spin miniprep kit, Qiagen, Hilden, Germany). Additionally, potential residual bacterial genome contamination was removed by performing agarose gel electrophoresis, excising the specific DNA fragment, and purifying it (QIAquick gel extraction kit, Qiagen). The plasmid DNA was quantified (Qubit instrument, Thermo Fisher Scientific). The number of viral copies (i.e., plasmid) per µL was then calculated (DNA Copy Number and Dilution Calculator tool, https://goo.gl/ANXpex).
Development and optimization of the direct PCR assay
Several primer pairs were designed using Primer3Plus 24 to cover a region of ~500 bp located in the PCV-3 rep region. PCR was performed (Phire animal tissue direct PCR kit, Thermo Fisher Scientific). To evaluate assay performance, various thermal protocols and reagent concentrations were attempted and compared by testing a 10-fold plasmid dilution (108–1 copy/µL). In order to simulate an actual clinical matrix, the dilution was performed on swine lung homogenate (10 mL of phosphate-buffered saline [PBS]/g of tissue) that had previously tested negative for PCV-3 using all assays under development. However, given the impossibility of obtaining undeniably PCV-3–negative tissue and to prevent the risk that a low titer infection could artificially inflate the assay’s analytic sensitivity, a dilution curve was also performed on horse lung. The assay limit of detection (LOD, defined as the lowest viral amount that can be detected in at least 50% of replicates) and the absence of nonspecific amplification products were selected as criteria to evaluate and compare different assay settings. To test the effect of different matrices on assay performance, the same approach was used to validate the methods on swine serum and oral fluid.
Given that DNA extraction was not required for the direct PCR kit, the PCR was developed and optimized using the selected matrices directly as templates.
Reactions were performed (2720 thermal cycler, Applied Biosystems, Foster City, CA), and amplification and specificity of the bands were visualized (Gel Doc XR system, Bio-Rad, Hercules, CA) after electrophoresis on 2% agarose gel and staining (EuroSafe nucleic acid staining solution, EuroClone, Pero, Italy).
Development and optimization of the qPCR assay
A comparable approach was used for qPCR development with minor modifications. Both primers and probes were designed based on the rep gene using Primer3Plus. 24 Additionally, a commercially available exogenous internal control (IC; i.e., a region of the enhanced green fluorescent protein in a standard cloning vector) was also implemented in the qPCR validation. 14 To minimize the interference between the IC and viral target amplification, different IC plasmid and primer–probe combinations were evaluated to maximize PCV-3 detection sensitivity while consistently detecting IC, particularly at low PCV-3 titers.
The assay LOD, efficiency, and coefficient of determination (R2), which were calculated using a serial 10-fold dilution curve, were selected as criteria to evaluate and compare different assay settings. qPCR efficiency (E) was evaluated through the formula E = 10(−1/slope) − 1. Slope was obtained through the calculation of linear regression between crossing points (Cq) and corresponding log-transformed viral titers. R2 summarizes the goodness-of-regression line fit in explaining the relationship between dilution and Cq. Unlike direct PCR, qPCR requires purified DNA as template. Thus, the plasmid dilution curve in lung homogenate, serum, and oral fluid was extracted (ExtractSpin TS kit, BIOLAB, Gorizia, Italy) before further processing. qPCR was performed (DyNamo ColorFlash probe qPCR kit, Thermo Fisher Scientific; LightCycler nano instrument, Roche Diagnostic, Indianapolis, IN), and raw data were analyzed (LightCycler nano software v.1.1, Roche).
Analytical validation
After assay optimization, LOD and repeatability were evaluated in both assays; E and R2 were assessed in the qPCR only. A standard curve range of 108–1 copy/µL was built for each evaluated matrix (lung homogenate, serum, oral fluid), as described previously, and tested by both assays. The LOD was assessed by testing 10 times the standard curve lowest detected dilution. Repeatability was assessed by testing 6 replicates of 3 viral dilutions (107, 104, 101) in 3 independent runs. For qPCR, the effect of dilution, replicate, and PCR run on Cq values was assessed using a repeated measures general linear model (GLM) as described previously.5,9 Additionally, the coefficient of variation (CV) was calculated for different experiment levels (i.e., run and dilution) and matrices. For both assays, the agreement among qualitative results (i.e., positive or negative) of different PCR runs was evaluated using the Cohen kappa coefficient. 2 Assay specificity was evaluated using a panel of several swine DNA pathogens, including PCV-1, PCV-2, Mycoplasma hyopneumoniae, porcine parvovirus 1 (PPV-1; species Ungulate protoparvovirus 1), PPV-2, Actinobacillus pleuropneumoniae, Trueperella pyogenes, and Bordetella bronchiseptica.
Test sensitivity
A total of 120 samples, originating from 55 farms located in northern Italy and delivered to the Veterinary Infectious Disease (Dept. Animal Medicine, Production and Health, Padua University, Italy) laboratory for routine diagnostic purposes, were randomly selected for evaluation of test sensitivity. In particular, 39 lungs, 33 sera, 32 organ pools, 9 oral fluids, 3 nasal swabs, and 4 environmental samples (i.e., sponges collected from trucks after sanitation) were included in our analysis. Tissues were mechanically homogenized in PBS (10 mL of PBS/g of tissue) before further processing. Similarly, swabs and sponges were diluted in 500 µL of PBS and vortexed. DNA was extracted from 200 µL of liquid matrices (ExtractSpin TS kit, BIOLAB), setting the final elution volume to 100 µL. All samples were tested using the optimized direct PCR and qPCR protocols. The performance of the 2 methods was compared and their agreement evaluated using the Cohen kappa coefficient. 2
Results
Direct PCR protocol
The PCR optimization phase led to the definition of the following protocol: samples were pretreated by adding 2 µL of serum, oral fluid, or tissue homogenate to 20 µL of dilution buffer with 0.5 µL of DNARelease additive (Thermo Fisher Scientific). The solution was incubated for 5 min at 25°C followed by 4 min at 98°C. Two µL of the solution was then added to a standard PCR master mix composed of 1× Phire animal tissue PCR buffer, 0.6 µM of each primer (Table 1), and 0.4 µL of Phire hot start II DNA polymerase. Sterile NANOpure water (Thermo Fisher Scientific) was added to bring the final volume to 20 µL. The PCR thermic protocol was 98°C for 5 min followed by 45 cycles of 98°C for 5 s, 68°C for 7 s, and 72°C for 15 s. A final elongation step of 1 min at 72°C was performed.
Primer and probes used for detection of porcine circovirus 3.
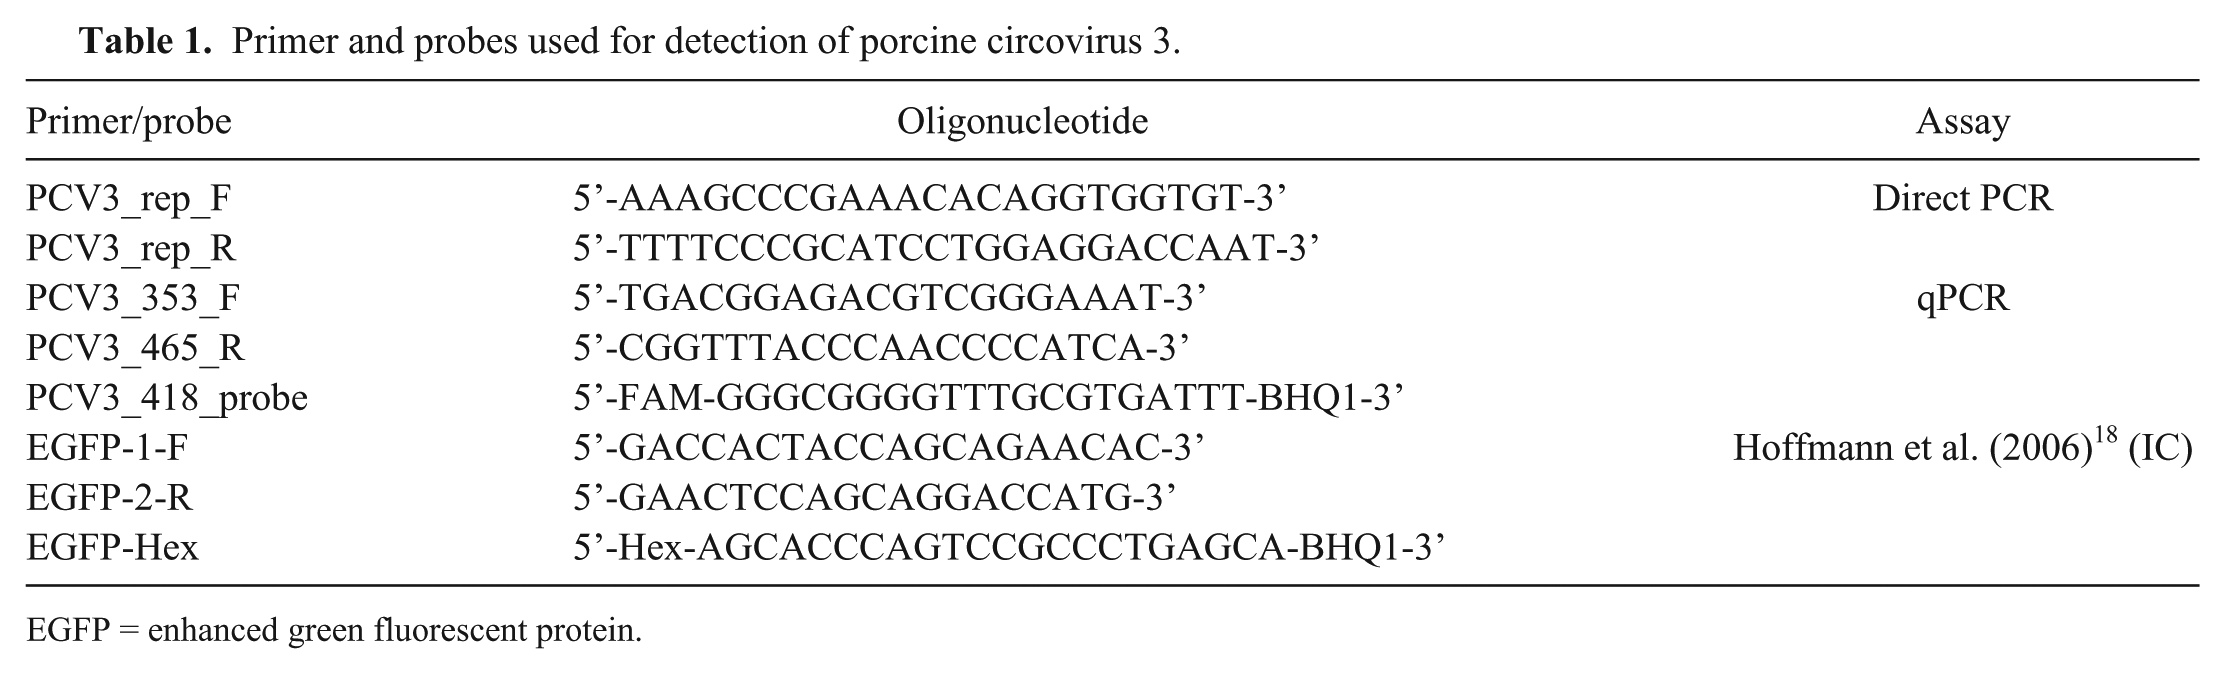
EGFP = enhanced green fluorescent protein.
qPCR protocol
The qPCR protocol was defined as follows: 2 µL of extracted DNA was added to a standard mix composed of 1× DyNAmo flash probe qPCR master mix (Thermo Fisher Scientific), 0.6 µM and 0.3 µM of PCV-3–specific primers and probe, respectively (Table 1), 0.4 µM and 0.2 µM of IC primers and probe, respectively (Table 1), and 5 pg of IC plasmid. Sterile NANOpure water was added to bring the final volume to 10 µL. The cycling parameters were 95°C for 7 min, followed by 45 cycles of 95°C for 10 s and 60°C for 30 s. The fluorescence signal was acquired at the end of each cycle extension phase.
Analytic validation
The viral genome was detected in the dilution range of 108–101 copies/µL by both assays and in all matrices examined (Fig. 1). The efficiency of the qPCR was 106.2% (slope = 3.18), with an error of 0.370 and R2 of 0.998 for the lung homogenate (fully comparable results were obtained independently of the matrix used for dilution preparation [i.e., swine or horse lung homogenate]), 90.9% (slope = 3.56), with an error of 0.226 and R2 of 0.992 for the serum, and 93.6% (slope = 3.48), with an error of 0.289 and R2 of 0.998 for the oral fluid.
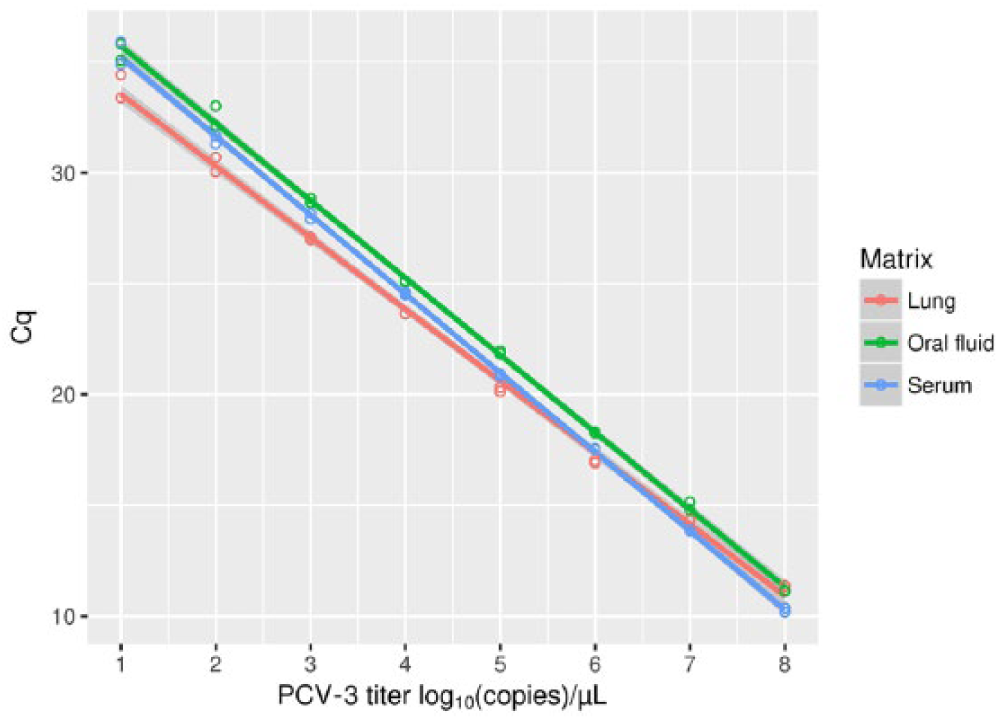
The results of a porcine circovirus 3 (PCV-3) genome 10-fold dilution range of 108–10 copies/µL tested using the quantitative PCR for different matrices. The regression lines between Cq and corresponding viral titer are also displayed.
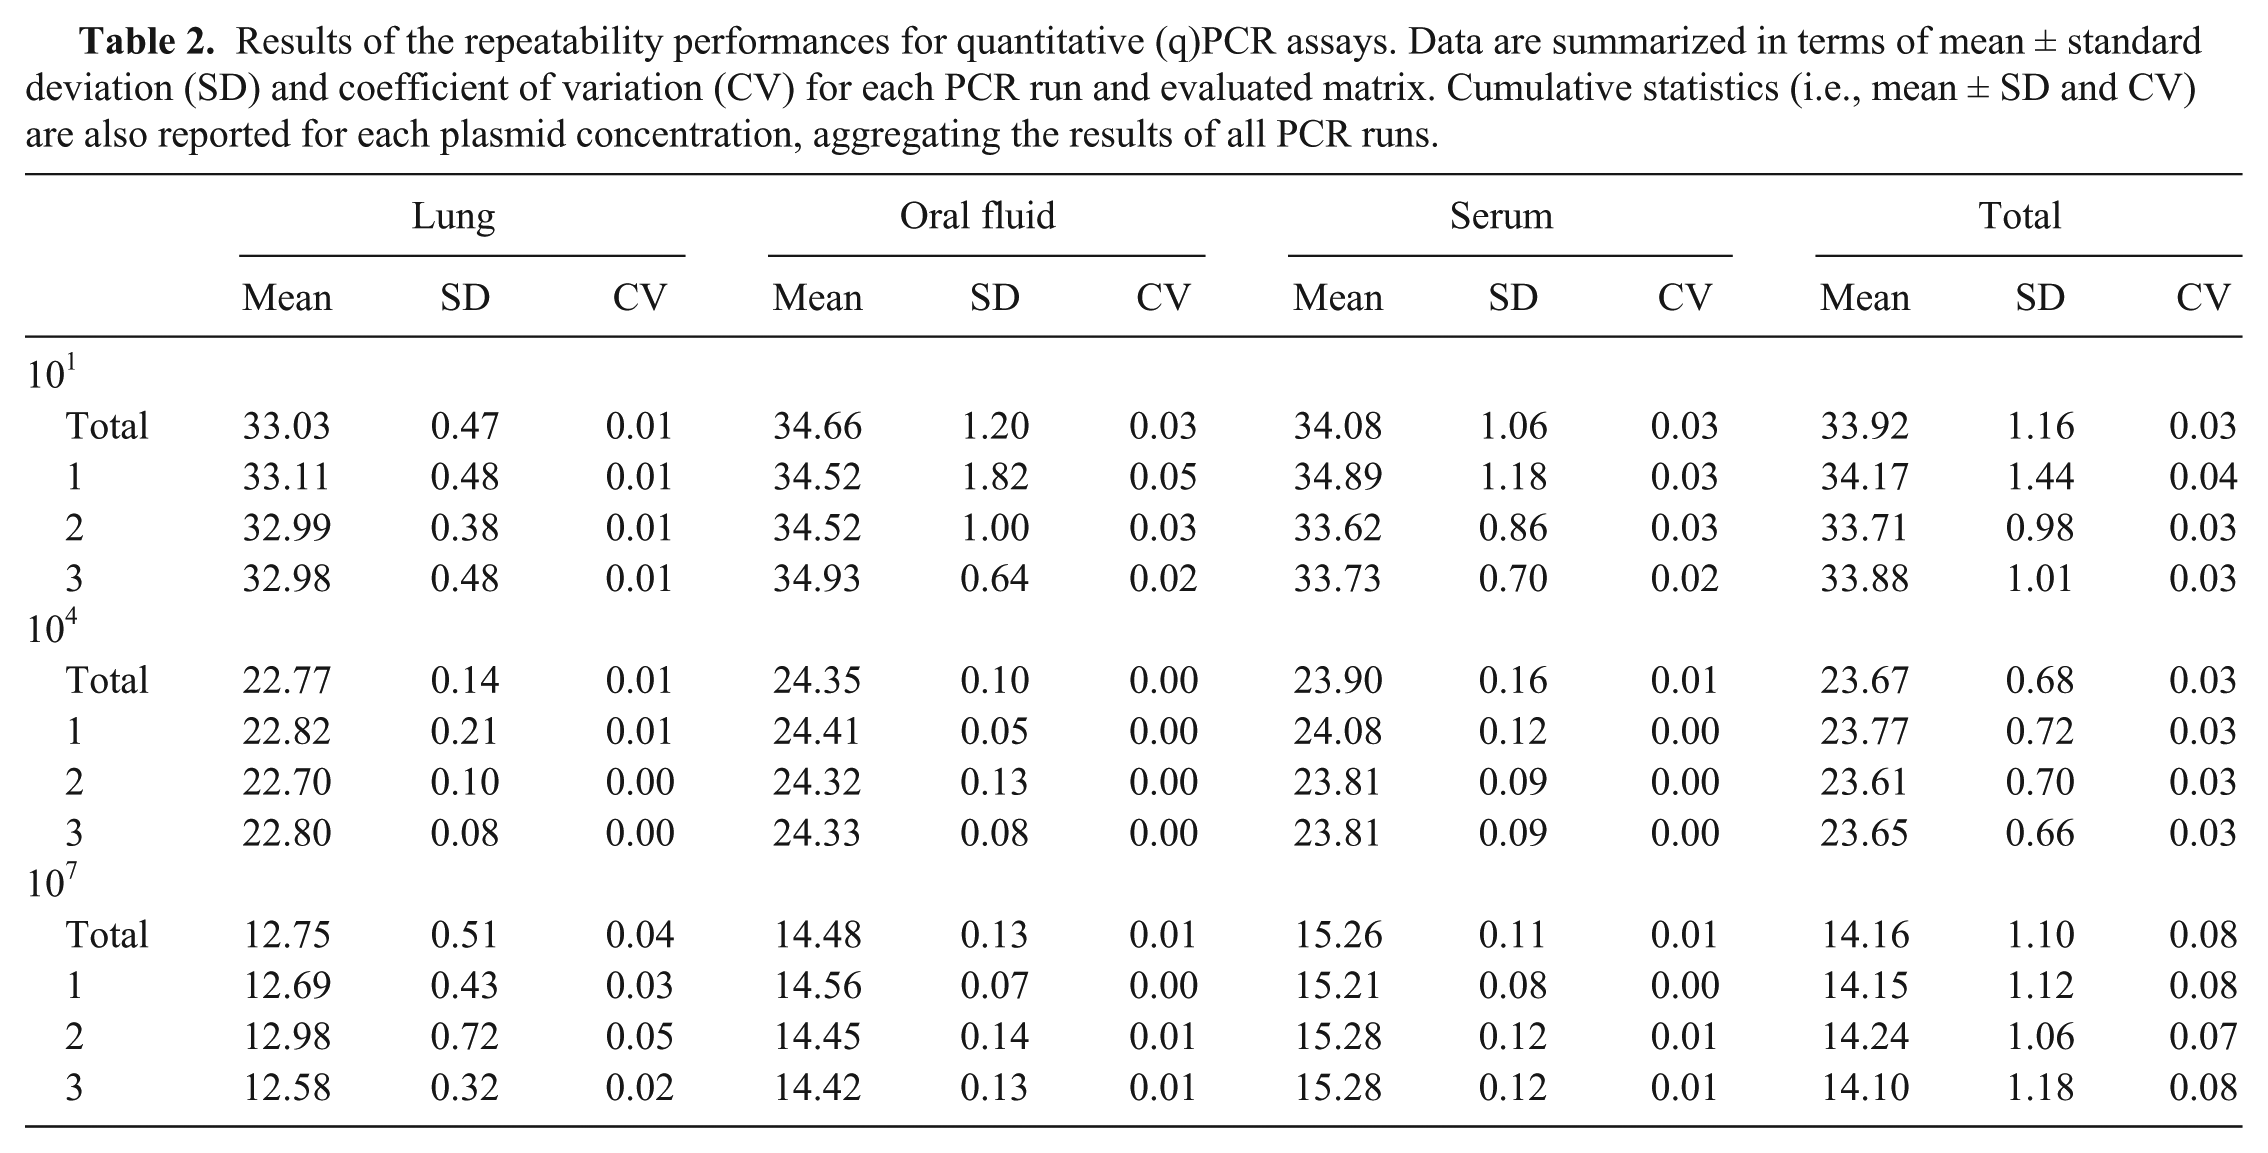
The repeatability of both assays was perfect (κ = 1) for all of the evaluated dilutions and matrices, with all replicates detected in all PCR runs. The GLM analysis, implemented to assess the repeatability of the qPCR quantitative results, revealed substantial equality of the standard curves, with only the effect of dilution being statistically significant (p < 0.05). No effect of the replicates of the PCR run and their interaction was detected at the set significance level (Fig. 2). The CV calculated for all experimental levels was constantly <0.06 (Table 2), further supporting the repeatability of the assay. Slightly higher, but still low CV (i.e., CV < 0.09) values were observed when different matrices were compared. The reaction efficiency that was calculated during repeatability evaluation was constantly close to 100%.
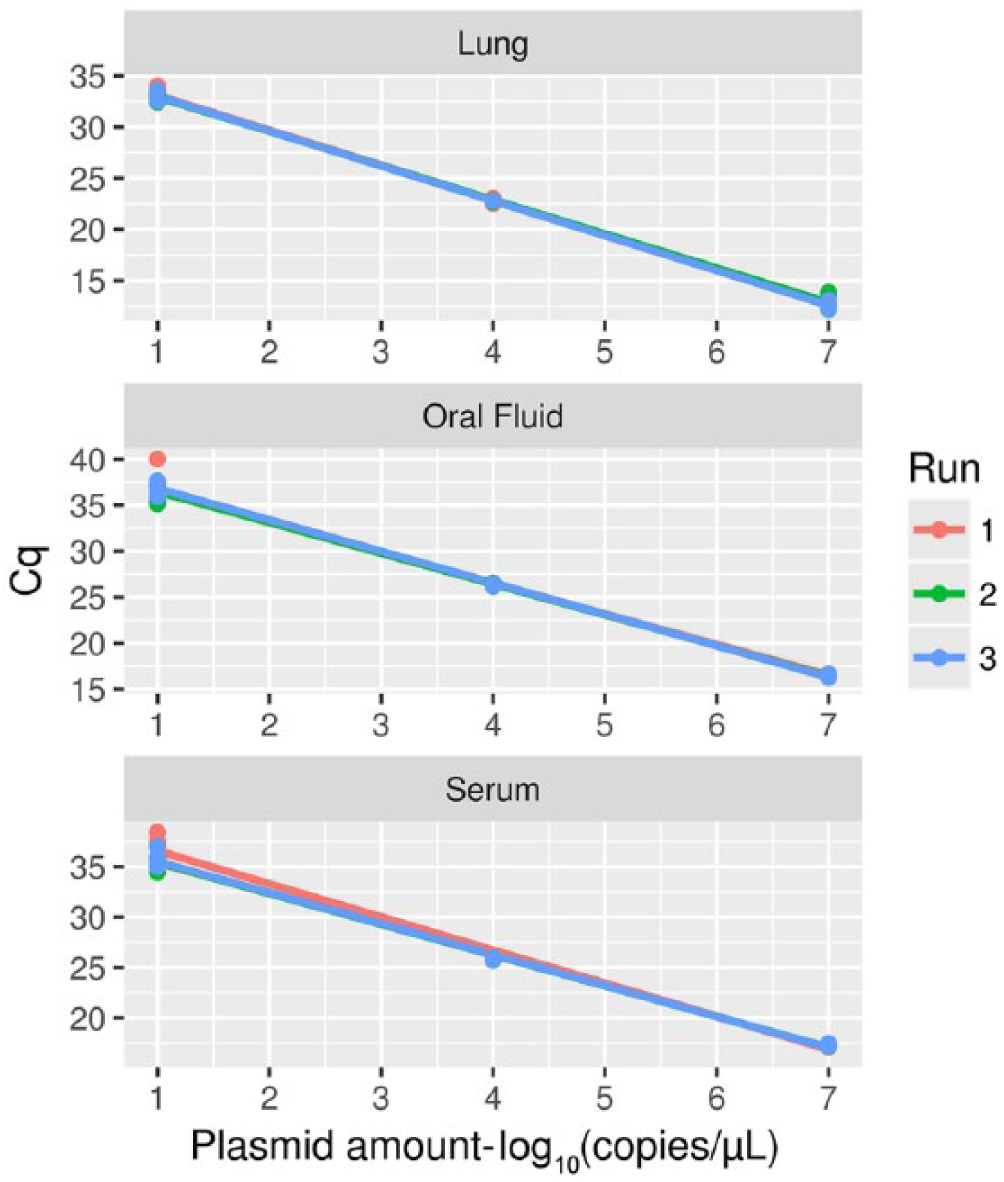
Regression lines depicting the relationship between 3 points of the standard curve (i.e., viral titers 107, 104, and 101 copies/µL) and the corresponding Cq, evaluated by testing each sample 6 times on 3 independent quantitative PCR runs. Single replicates (points) and the regression lines have been color coded according to the specific PCR run.
Results of the repeatability performances for quantitative (q)PCR assays. Data are summarized in terms of mean ± standard deviation (SD) and coefficient of variation (CV) for each PCR run and evaluated matrix. Cumulative statistics (i.e., mean ± SD and CV) are also reported for each plasmid concentration, aggregating the results of all PCR runs.
Nonspecific amplification was not detected with either direct PCR or qPCR when other pathogens were tested. The IC was consistently detected with a Cq of ~30. However, a higher and more variable IC Cq occurred at a very high viral concentration (i.e., >107 copies/µL).
Test sensitivity
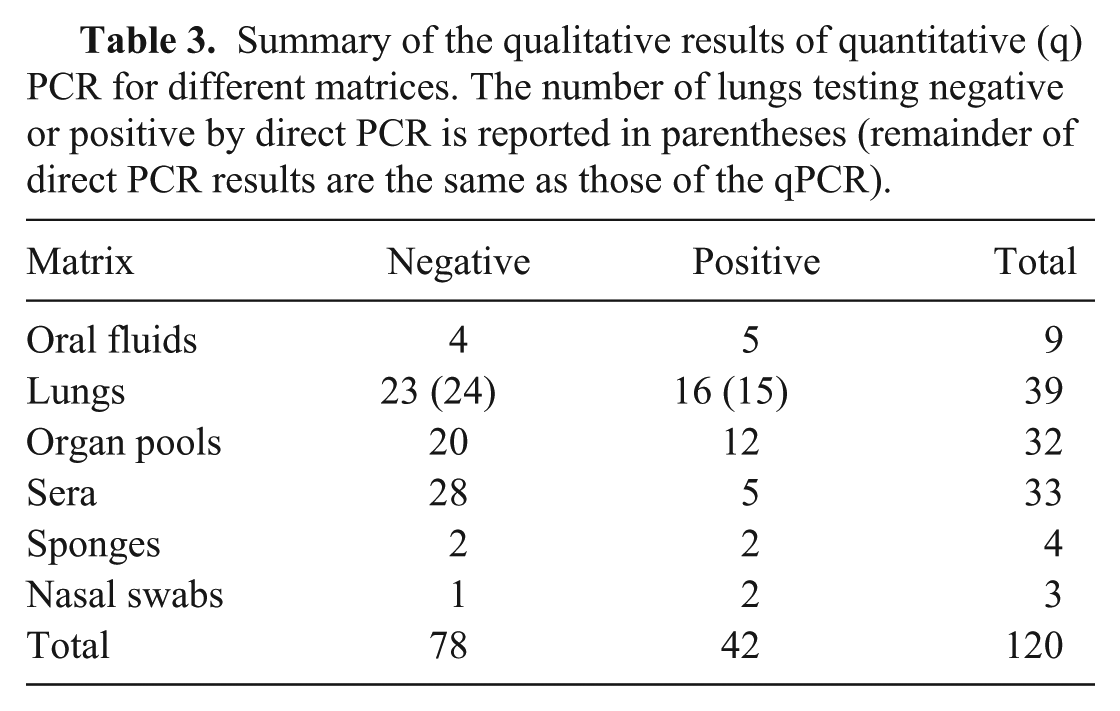
Using the direct PCR and the qPCR assays, 41 and 42 of 120 samples tested positive for PCV-3, respectively. The agreement between the 2 assays was almost perfect (κ = 0.98; 95% confidence interval = 0.95–1). Only one lung sample showed discordant results, negative to the direct PCR but positive to qPCR assay (estimated viral titer: 0.11 viral copies/µL).
All tested matrices displayed at least one positive sample (Table 3). Even if oral fluids, lungs, and organ pools had higher viral titers (Fig. 3), the difference, evaluated using the Kruskal–Wallis rank sum test, was not statistically significant (data not shown).
Summary of the qualitative results of quantitative (q)PCR for different matrices. The number of lungs testing negative or positive by direct PCR is reported in parentheses (remainder of direct PCR results are the same as those of the qPCR).
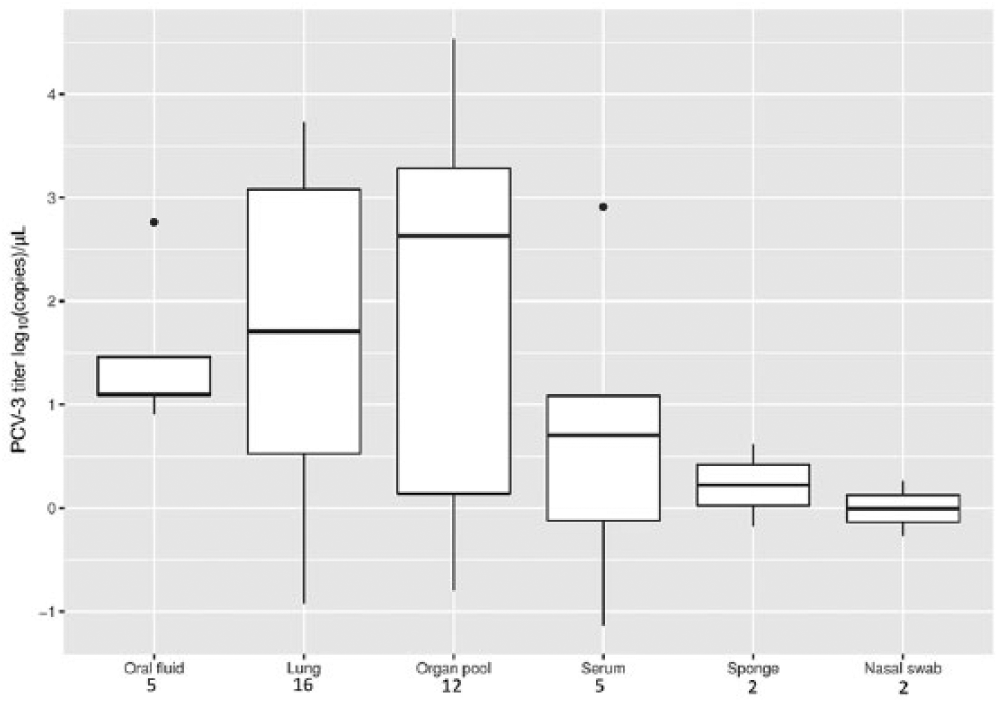
Boxplot reporting the porcine circovirus 3 (PCV-3) viral titer distribution in different matrices. The number of positive samples for each matrix is reported below the respective labels.
Discussion
Both direct PCR and qPCR assays demonstrated excellent sensitivity, being able to detect as few as 10 viral copies/µL. The perfect qualitative repeatability demonstrated by both direct PCR and qPCR indicates they are of equivalent value, evidence further supported by the validation results. Unfortunately, it was not possible to compare the newly developed methods with a defined “gold standard” given that no reference method has yet been defined. However, the substantially perfect agreement of the 2 methods across the field samples strongly indicates their high sensitivity and specificity. Remarkably, the only discordant sample was a lung sample that was characterized by an extremely low estimated viral titer, using qPCR, and not detected with direct PCR. Consequently, the direct PCR method LOD could have been reached. Additionally, because this assay is based on the direct testing of 2 µL of target sample, the effect of stochastic sampling of viral particles and/or tissue pieces could be exacerbated compared with the qPCR assay, including a DNA extraction phase from 200 µL of sample. The high quantitative repeatability of the qPCR was demonstrated by the absence of any effect observed across replicates or experiment runs and by the very low CV within and between runs at each plasmid concentration. This feature, coupled with the almost perfect E, low error, and linearity of the Cq–titer relationship, provides a good basis for the use of qPCR in viral quantification, making it suitable for both diagnostic and research purposes.
The capability of detecting minimal viral amounts is of great relevance from an epidemiologic perspective, because it allows accurate monitoring of viral circulation in subclinical scenarios. Similar considerations apply to several research fields, such as pathogenesis or control measure efficacy evaluation research, 25 in which precise quantification of small viral titers can be fundamental. Moreover, qPCR can provide useful additional information compared to non-quantitative PCR techniques. Pathogen titer quantification is fundamental for the study of disease pathogenesis, virulence, tropism, epidemiology, and for the evaluation of control strategy efficacy (e.g., vaccination). As demonstrated for PCV-2,1,17 the potential relationship between viral titer and clinical signs cannot be underestimated and is of extraordinary importance in multifactorial diseases to differentiate clinical and subclinical infections. If this scenario was also confirmed for PCV-3, 26 the presence of a validated method, shared among laboratories, would be the best approach to provide consistent and reliable quantitative results and, thus, define common guidelines. 13
Fully comparable results were obtained during the analytic validation process for all evaluated matrices, supporting the broad applicability of the validated methods to various matrices. Moreover, all matrices tested in the diagnostic validation step gave at least one PCV-3–positive sample, confirming the applicability of both methods over a broad substrate range. Five of the 9 oral fluids considered herein were positive for PCV-3 DNA, thus suggesting the efficient shedding of this virus through oral secretions and the potential application of ropes as a sensitive tool for the monitoring of PCV-3 circulation at the herd level. Finally, the PCV-3 genome was also detected in environmental samples collected to check the efficacy of routine sanitation procedures in removing pathogens (i.e., porcine reproductive and respiratory virus) from trucks after animal transportation (data not shown).
Considering that PCV-3 is a single-stranded DNA virus, a group typically featuring a high substitution rate,7,10 both assays were designed to specifically target the rep gene. This region, encoding for protein(s) fundamental for viral replication, is in all likelihood subjected to strong purifying pressure, which should, as already reported for PCV-2,11,12 limit its diversity and heterogeneity. Accordingly, the comparison of primers and probes in both assays with the PCV-3 genome demonstrated only one mismatch with the available sequences (data not shown). Although mismatches can potentially affect assay sensitivity and quantification accuracy, previous studies have demonstrated the robustness of qPCR when a low number of mismatches is present, particularly if the primer region rather than the probe region is affected. 6 Even if available data are still scarce, the sequences used originated from different regions of the world (i.e. United States, China, Korea, and Europe) and, similarly to the situation with PCV-2,8,11 it is highly likely that PCV-3 has been circulating undetected for a long time in the swine population. Based on this information, PCV-3 genomes considered herein are likely representative of global PCV-3 genetic heterogeneity, thus supporting worldwide applicability of the 2 developed methods. Moreover, the targeted genome region was proven to be variable enough to prevent nonspecific interaction with other swine pathogens (particularly other circoviruses and single-stranded DNA viruses) and to provide, if sequenced, useful information for the genetic characterization of the detected strains.
A limited number of qPCR assays have been published for the detection of PCV-3.18,25 However, the first reported assay 18 lacks relevant measurement of analytic and diagnostic performance, given that the purpose of that study was to report a new infectious agent rather than the validation of a test method. Besides a 10-fold higher sensitivity compared to others, 25 our method differs because of the incorporation of an IC system. Target loss during extraction or the presence of PCR reaction inhibitors during amplification often causes low test sensitivity. Validation of an endogenous IC has some disadvantages, particularly because of the difficulty in selecting a gene constantly expressed in different tissues and clinical conditions. To overcome this problem, we included an exogenous IC directly in the qPCR master mix. The integration of a full-process IC (e.g., by spiking the IC plasmid in the template before extraction) would require only minimal efforts to determine the proper IC amount. At the established reaction conditions, the IC was consistently detected in all matrices, particularly at low viral concentrations, which are the samples most affected by inhibition or poor extraction efficiency. The successful implementation of a reliable IC represents an additional guarantee against false-negative results caused by PCR inhibitors or DNA loss during the extraction phase, increasing assay reliability.
All previously described assays18,25 require DNA extraction. In contrast, the direct PCR described herein provides a rapid, highly automatable, and very economical approach to PCV-3 detection. This technique could have wide application in high-throughput laboratories, in which time efficiency and cost reduction are of primary relevance.
Footnotes
Declaration of conflicting interests
The authors declared no potential conflicts of interest with respect to the research, authorship, and/or publication of this article.
Funding
This study was supported by University of Padua Grant (ex 60%, 2016, DOR1672439; Molecular epidemiology of economically relevant avian and swine respiratory viruses).