
Abstract
Accurate measurement of equine adrenocorticotropin (ACTH) is important for the diagnosis of equine pituitary pars intermedia dysfunction (PPID). Several radioimmunoassays (RIAs) and chemiluminescent immunoassays (CIAs) are used for measurement of ACTH concentration in horses; whether these methods yield similar results across a range of concentrations is not determined. We evaluated agreement between a commercial RIA and CIA. Archived plasma samples (n = 633) were measured with both assays. Correlation between the 2 methods was moderate (r = 0.49, p < 0.001). Bland–Altman analysis revealed poor agreement, with a proportional bias and widening limits of agreement with increasing values. Poor agreement between assays was also observed when evaluating plasma samples with concentrations at or below the recommended diagnostic cutoff value for PPID testing. The lack of agreement suggests that measurements obtained should not be considered interchangeable between methods.
Introduction
Equine pituitary pars intermedia dysfunction (PPID) is a common disorder of aged equids, affecting ~15–20% of horses >15-y-old. 13 Affected horses have functional hyperplasia or adenomas of the pars intermedia that are associated with increased secretion of pro-opiomelanocortin (POMC)–derived peptides. POMC is secreted by the corticotrophs of the pars distalis and the melanotrophs of the pars intermedia, and is cleaved by pro-hormone convertases into adrenocorticotropic hormone (ACTH, adrenocorticotropin) and other peptides. 12 In healthy horses, the majority of circulating ACTH is secreted by the pars distalis; the pars intermedia secretes primarily α-melanocyte–stimulating hormone, corticotropin-like intermediate peptide, and ß-endorphin. 18 However, in horses with PPID, there is increased secretion of ACTH by the pars intermedia. 18 When used in conjunction with clinical signs, measurements of either ACTH or ACTH following administration of thyrotropin-releasing hormone have been demonstrated to be useful tests for the diagnosis of PPID.2,6,7
Several commercial assays for measurement of human ACTH are used to measure ACTH in equine plasma, including several radioimmunoassays (RIAs) and a chemiluminescent assay (CIA). RIA requires use of a radioisotope and overnight incubation. CIA is automated, has shorter assay times, and does not require use of a radioisotope, potentially making it a more convenient method for measurement of ACTH. Both an RIA and the CIA have been validated previously in equine plasma.6,16 Recommended cutoff values in the non-fall seasons for the CIA 4 and an RIA (https://goo.gl/kor1RK) are similar; however, fall season cutoff values are markedly different, suggesting that the assays may not be in good agreement. We evaluated method agreement between 2 commonly used commercial ACTH assays, an RIA and a CIA.
Materials and methods
EDTA plasma harvested from 633 horses in another study had been stored and was used for measurement of plasma ACTH. Blood was collected from horses into plastic EDTA tubes and placed on ice. Following 3–12 h of refrigeration, blood was centrifuged for 10 min at room temperature at 1,534 × g. Plasma was stored at −80°C until analysis, and analysis was undertaken within 2.5 y of sample collection.
Comparison of methods
Analysis of ACTH was performed at Oklahoma State University (Stillwater, OK). Two commercial assays for measuring ACTH were used, an RIA and a CIA. Both assays measure human ACTH1-39 and have been validated previously in the horse.6,16 In human plasma, the lower limit of detection for the RIA is 1.3 pmol/L (hACTH double antibody RIA kit, MP Biomedicals, Orangeburg, NY), and lower and upper limits of detection for the CIA are 2 and 275 pmol/L, respectively (Immulite 1000 ACTH, Siemens, Los Angeles, CA).
Samples from horses aged 2–33 y (mean ± SD, 12.9 ± 6.3 y) were measured with both assays. Breeds included 286 Morgans, 95 Welsh ponies, 61 Arabians, 47 mixed-breed horses, 40 Tennessee Walking horses, 37 Quarter Horses, 10 Paints, 9 Thoroughbreds, 7 Paso Finos, 7 Rocky Mountain horses, 6 Appaloosas, 6 Peruvian Pasos, 4 Saddlebreds, 3 Mustangs, 2 Kentucky Mountain Saddle horses, 2 Hackney ponies, 2 National Show horses, 2 Shetland ponies, 2 Spotted Saddle horses, 1 each of Haflinger, Mountain Pleasure horse, Missouri Fox Trotter, Percheron, and Warmblood. There were 383 mares, 217 geldings, and 33 stallions. All included horses appeared healthy on the basis of physical examination, with no clinical signs of PPID. All samples were collected in Canada and the United States. Samples (n = 366) were collected in the non-fall seasons (November–June), and 267 samples were collected in the fall (July–October). Samples were divided by season (fall vs. non-fall) given that equine ACTH secretion is recognized to have a circannual rhythm, with higher concentrations in the fall. 4 Samples measured by RIA were evaluated in duplicate.
Samples were measured over a 2-y period. Measurement with RIA preceded measurement by CIA in all cases. Following measurement with RIA, samples were refrozen and thawed for measurement with CIA. Samples were measured in 4 batches over an 18-mo period by RIA, and over 3 wk by CIA. The same equipment was used for each assay throughout ACTH measurement. For the CIA using human-based serum controls, linearity was excellent (r2 = 1, p < 0.001); precision was 3.06% for the low control sample and 2.51% for the high control sample (10 replicates each). Expected concentration was 100–102% of observed concentration (at 4 concentrations). For the RIA, interassay CV for the 50 pg/mL standard was 5% (n = 3) and intra-assay variation CV was 7.2% (n = 8). Unfortunately, lot numbers were not recorded for the CIA or the RIA but they were done in batches (estimated 1–3 lots/batch).
Statistical analysis
Data were analyzed for normality using a Pearson–D’Agostino test. Data were not normally distributed. A Spearman correlation coefficient was calculated for the 633 samples analyzed by both methods, using the mean of the RIA to compare to the CIA. A Wilcoxon matched pairs signed-ranks test was used to compare sample concentrations between methods. Bland–Altman analysis for non-uniform data was performed using a regression approach, as described previously. 3
Discordance rate was calculated by taking the number of samples that fell within the reference interval (RI) when measured by one method but outside the RI for the other method divided by total number of samples.
To determine if the relationship between the 2 assays differed when evaluating samples within the RI used for diagnostic testing of PPID, comparison of methods was also undertaken in a subset of samples (n = 611) with concentrations <25 pmol/L using the statistical methods described above.
To determine if there was an effect of sample storage time on method comparison, duration of storage was divided into 4 periods defined by duration of time between measurement by each assay (period 1: 173–180 d, n = 180; period 2: 322–324 d, n = 148; period 3: 562–567 d, n = 151; period 4: 709–717 d, n = 179), and a Spearman correlation coefficient was calculated for each storage period and the difference between the 2 methods. Statistical analysis was performed using Prism 7 (GraphPad Software, La Jolla, CA), with the exception of the Bland–Altman analysis, which was performed with R (www.r-project.org).
Results
Median ACTH concentration for the RIA was 8.5 pmol/L (interquartile range [IQR]: 5.5–12.3), whereas median ACTH concentration for the CIA was 5.9 pmol/L (IQR: 4.4–8.6). For the RIA (measured in duplicate), the intra-assay CV was 6.3% and the interassay CV was 7.3%. The concentrations measured by each method were significantly different (p < 0.001).
There was moderate correlation between the 2 methods (r = 0.49, p < 0.001; Fig. 1). There was no improvement in correlation between the 2 methods when only those samples with concentrations at or below the recommended diagnostic cutoff value for PPID testing (i.e., samples with concentrations <25 pmol/L using the CIA; n = 611) were included (r = 0.44, p < 0.001; Fig. 2). Bland–Altman analysis revealed poor agreement, characterized by negative proportional bias and widening limits of agreement as measured concentration increased (Fig. 3). In contrast, when only the samples at or below the diagnostic cutoff value were included, there was a positive proportional bias and widening limits of agreement as measured values increased (Fig. 4).
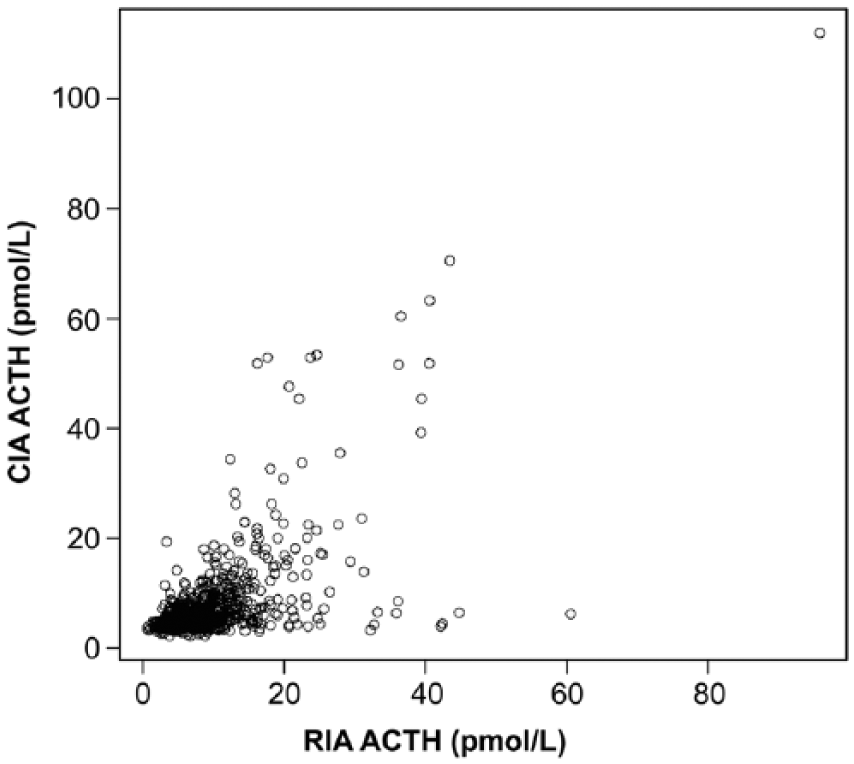
Correlation between adrenocorticotropin (ACTH) measurements obtained by the chemiluminescent immunoassay (CIA) and radioimmunoassay (RIA; r = 0.49, p < 0.0001).
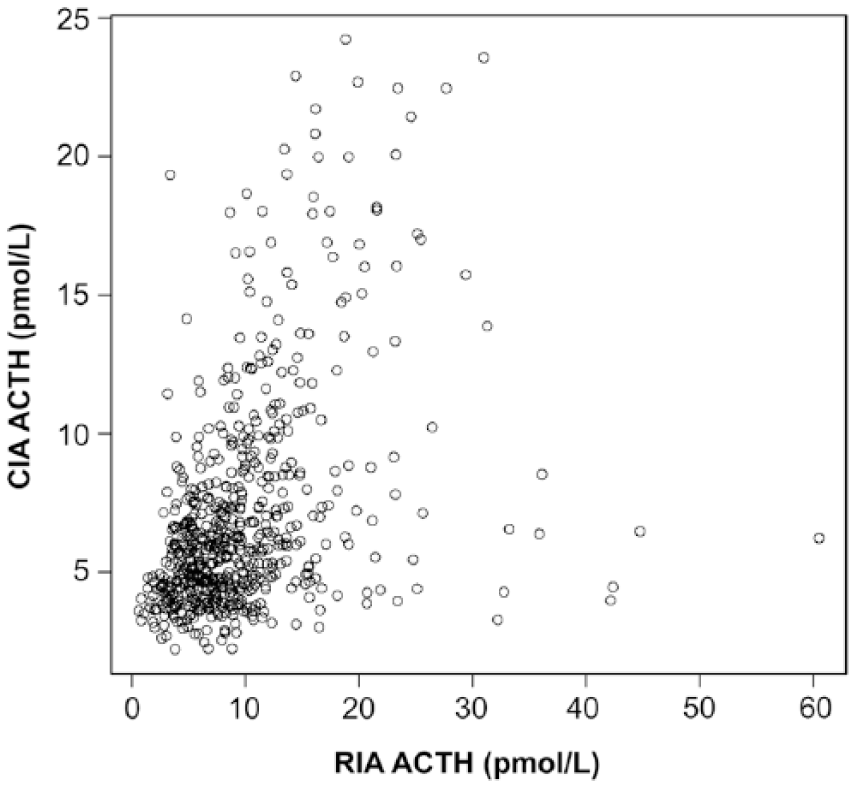
Correlation between adrenocorticotropin (ACTH) measurements obtained by the chemiluminescent immunoassay (CIA) and radioimmunoassay (RIA) with a measured CIA concentration <25 pmol/L (r = 0.44, p < 0.0001).
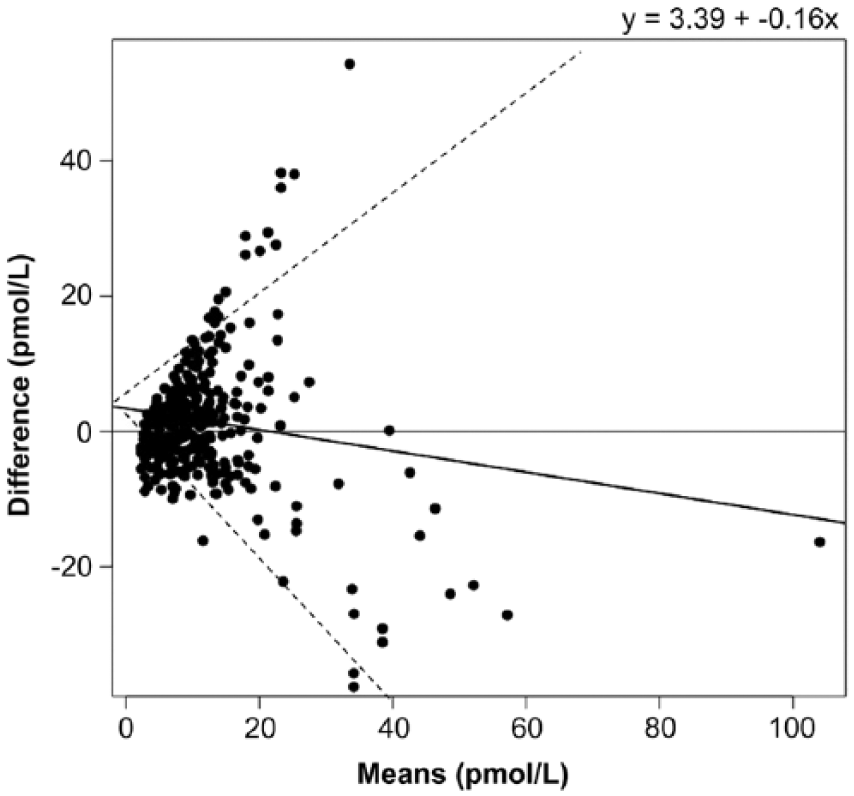
Bland–Altman plot demonstrating the agreement between the chemiluminescent immunoassay (CIA) and radioimmunoassay (RIA) for measurement of adrenocorticotropin (ACTH). X-axis is the average of CIA and RIA for each plasma sample; y-axis is the difference of CIA minus RIA ACTH. Solid line indicates bias (y = 3.39 − 0.16x); dashed lines indicate 95% limits of agreement.
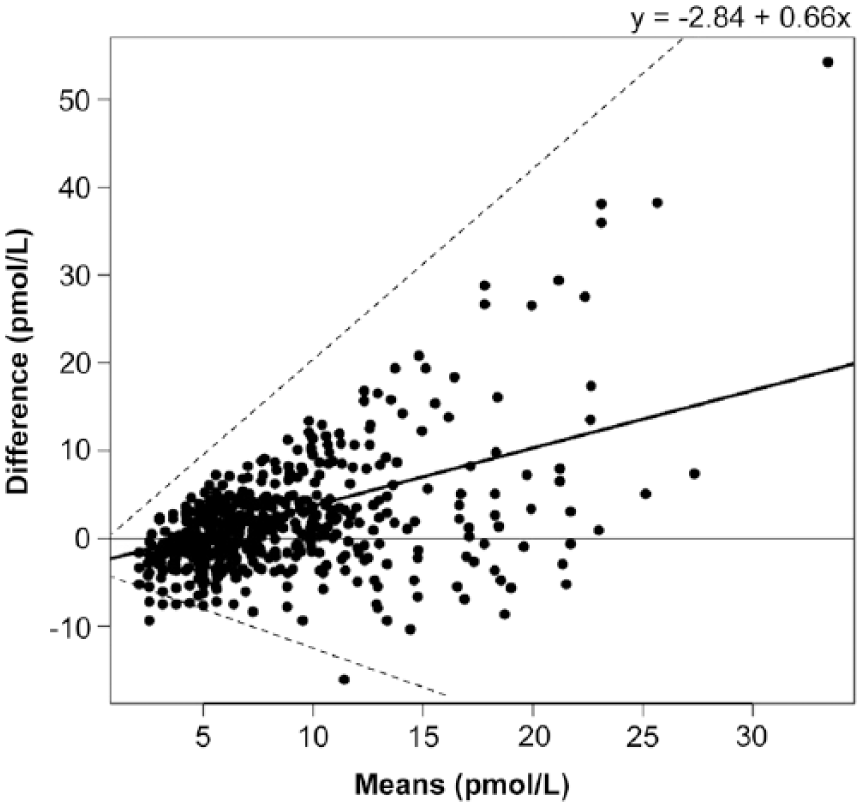
Bland–Altman plot showing the agreement between the chemiluminescent immunoassay (CIA) and radioimmunoassay (RIA) for measurement of adrenocorticotropin (ACTH) in samples with a measured CIA concentration <25 pmol/L. X-axis is the average of CIA and RIA for each plasma sample; y-axis is the difference of CIA minus RIA ACTH. Solid line indicates bias (y = −2.84 + 0.66x); dashed lines indicate 95% limits of agreement.
Using a cutoff value of 6.4 pmol/L (non-fall, November–June) and 10.4 pmol/L (fall, July–October) for the CIA, 352 horses had ACTH concentrations above the RI. Thirty-eight percent (95% confidence interval [CI]: 34–42%) of 366 horses had discordant samples (above or below the RI in only one assay) in the non-fall; 26% (95% CI: 21–31%) of 267 horses had discordant measurements in the fall, with an overall discordance rate of 33% (95% CI: 30–36%).
Median storage time from completion of the RIA to completion of the CIA was 562 d (range: 173–717 d). The relationship between storage time and difference between assays was not consistent across different time periods (period 1: 173–180 d, n = 180, r = 0.001, p = 0.99; period 2: 322–324 d, n = 148, r = 0.007, p = 0.93; period 3: 562–567 d, n = 151, r = −0.35, p < 0.001; period 4: 709–717 d, n = 179, r = 0.02, p = 0.80; Fig. 5). When all samples were analyzed together, there was a weak correlation (r = −0.17, p < 0.001).
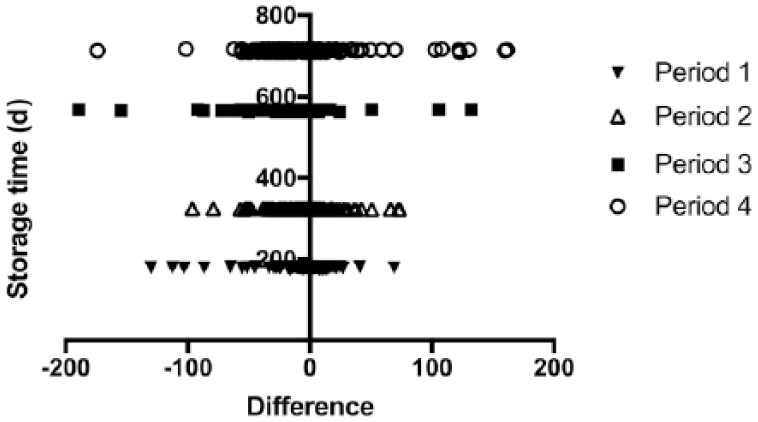
Sample storage duration compared to difference in adrenocorticotropin (ACTH) concentration between methods. X-axis is CIA minus RIA ACTH concentration; y-axis is sample storage duration.
Discussion
In our study, CIA and RIA showed a moderate correlation and poor agreement for measuring equine ACTH, both when evaluating samples across the measured range of concentrations and when evaluating samples that fell within the cutoff for diagnosis of PPID. Similarly, a prior study in a small number of horses (n = 39) suggested that different assays for measuring equine ACTH had wide limits of agreement (Schott HC, et al. Comparison of assay kits for measurement of plasma adrenocorticotropin concentration. 2nd Equine Endocrinology Summit; 2012; Boston, MA). Another study evaluating samples from 52 horses with CIA and an immunoenzymometric assay demonstrated that only 29% of samples fell within the limits of acceptability. 11 In people, there is also wide variability in different assays for measurement of ACTH. 9 These findings suggest that different assays may not always consistently measure the same structure.
Although human and equine ACTH are structurally homologous, 14 post-translational processing of POMC has been shown to vary in horses with PPID, which may result in increased production of peptides that are immunoreactive. 18 Previous studies indicated that not all immunoreactive pars intermedia or plasma ACTH from horses with PPID is bioactive.5,15 Thus, it appears likely that not all measured circulating ACTH is the ACTH1-39 fragment, at least in horses with PPID. Although horses in our study did not have clinical signs of PPID, some of the included horses were aged and had ACTH concentrations outside the RI for normal horses, suggestive of subclinical PPID.
In our study, the poor agreement between assays was characterized by proportional bias and increasing limits of agreement with increasing concentrations. This finding is consistent with the possibility that horses with higher measured ACTH may have a greater multiplicity of POMC post-translational modifications resulting in an expanded diversity of circulating immunoreactive ACTH peptides. Post-translational POMC processing is exquisitely regulated and can be affected by disease (such as PPID), season, 10 energy balance, 17 tissue type, 1 and neurotransmitter concentrations. 8 Differences in antibody specificity in the 2 assays, and thus cross-reactivity, would therefore contribute to the differences observed between assays in our study. For example, the RIA is known to cross-react strongly with ACTH1-24, whereas the CIA cross-reacts modestly with ACTH18-39 (corticotropin-like intermediate peptide; Table 1). As a result, individual horses, with individualized POMC peptide profiles, would respond differently in these assays with disparate reactivity to POMC peptides other than ACTH1-39. Although this variability presents an obstacle to using the existing immunoassays to diagnose PPID, it may be that alternative methods of testing could capitalize on the multitude of POMC peptides generated by different environmental and genetic backgrounds in the horse. Further characterization of POMC peptide profiles is necessary to determine the utility of these signatures in the diagnosis of PPID.
Reported cross-reactivity of the radioimmunoassay (RIA; hACTH double antibody RIA kit, MP Biomedicals) and chemiluminescent immunoassay (CIA; Immulite-1000 ACTH, Siemens) in human plasma.
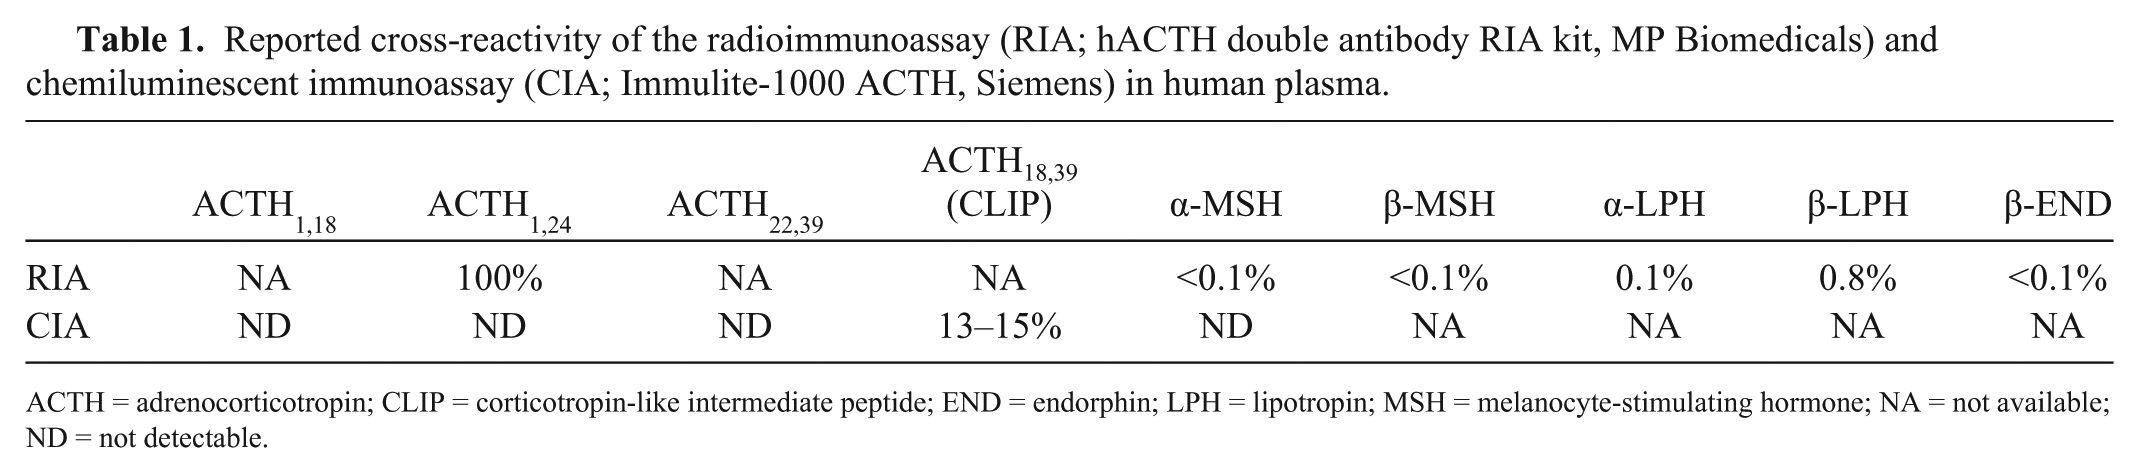
ACTH = adrenocorticotropin; CLIP = corticotropin-like intermediate peptide; END = endorphin; LPH = lipotropin; MSH = melanocyte-stimulating hormone; NA = not available; ND = not detectable.
Method comparison studies typically include measurement of interassay CVs in order to calculate total error between assays. However, because initial analysis demonstrated that bias was not consistent across sample concentrations, total error could not be calculated, and additional measurements for assay comparison were not undertaken.
Limitations of our study include the variation in sample storage duration, which may have contributed to differences observed among assays. Ideally, samples would have been measured by each assay on the same day. Each sample underwent measurement by RIA first, followed by measurement by CIA 173–717 d later. However, there was no consistent relationship between sample storage period and difference between the assays, with the greatest differences observed in the sample set assayed with an intermediate, not longest storage time. Therefore, it appears that long-term storage of plasma samples at −80°C may be acceptable for future ACTH measurement.
The poor agreement between assays combined with the large proportion (38%) of discordant results suggests that the CIA and RIA should not be used interchangeably for measurement of equine ACTH. Measurement of specific circulating POMC peptides in normal and PPID-affected horses may help to determine the reason for differences between assays. Additional study is required to determine if one assay yields more consistent results for diagnosis of PPID.
Footnotes
Acknowledgements
We thank Grace Kwong for assistance with statistical analysis.
Declaration of conflicting interests
The authors declared no potential conflicts of interest with respect to the research, authorship, and/or publication of this article.
Funding
The authors received no financial support for the research, authorship, and/or publication of this article.