
Abstract
Diagnosis of equine hyperinsulinemia requires an accurate method for quantification of equine insulin concentrations. The objectives of the current study were to compare 2 commercially available techniques for measurement of equine insulin, the radioimmunoassay (RIA) and chemiluminescent immunoassay (CIA). Recovery was poor for both assays, but worse for the CIA. Serial dilution of a high endogenous insulin sample yielded better linearity for the RIA (r2 = 0.99, P < 0.001) than the CIA (r2 = 0.92, P = 0.009). Bland–Altman analysis indicated that the CIA was, on average, 91 pmol/l higher than the RIA, with wide limits of agreement (95% limits of agreement: –508 to 691 pmol/l). These findings suggest that results between the assays should not be considered interchangeable.
Introduction
With increasing recognition of equine insulin resistance and its complications, 6 there is a demand for convenient, accurate tests for measurement of equine insulin. The gold standard for measuring insulin is liquid chromatography–mass spectrometry (LC-MS), 12 but this method can be impractical in clinical veterinary medicine and most research settings. Several additional methods of measurement have been evaluated for equine use, including 2 radioimmunoassays (RIAs) and 4 enzyme-linked immunosorbent assays (ELISAs). 12 An equine-specific ELISA is available and has been validated in the horse, 10 but the ELISA has poor concordance with the previously validated RIA. 12 The other assays (1 RIA and 3 ELISAs) did not validate based on assessment of linearity, dilutional parallelism, intra-assay coefficient of variation (CV), and recovery on addition. 12 Furthermore, the equine-specific ELISA demonstrated poor concordance while the RIA had moderate concordance with LC-MS. 12 Both the ELISA and the RIA consistently underestimated plasma insulin concentrations, compared with the LC-MS. 12 These findings suggest that accurate measurement of equine insulin is not currently achieved using commercially available assays.
The chemiluminescent immunoassay a (CIA) is a convenient method of equine insulin measurement that has been used to assess the response of insulin-resistant horses to therapy. 2 However, to the authors’ knowledge, this method has not yet been validated in the horse. Furthermore, although both the RIA b and CIA have been previously used for measurement of insulin concentration in horses, neither assay is specific for equine insulin (Siemens Healthcare: 2003, Immulite insulin, pp. 1–8. Siemens Healthcare, Malvern, PA).2,3 The purpose of the current study was to validate the CIA and then cross-reference the CIA with the previously validated RIA.
Materials and methods
Archived serum from 40 horses was used for measurement of serum insulin. Samples were collected from horses representing a range of body condition scores (lean to obese adult horses) and included some horses with pituitary pars intermedia dysfunction. A wide range of insulin concentrations was expected from the included samples. Serum had been stored at –80°C until analysis, and all analysis was undertaken within 6 months of sample collection.
Linearity
Linearity of the CIA was determined using equine serum–based control solution, which consisted of human insulin in an equine serum matrix at 4 insulin concentrations of 0–2296 pmol/l. Dilutional parallelism was evaluated in a high endogenous insulin equine serum (measured concentration using CIA was 796 pmol/l) using both the RIA and CIA.
Recovery
A commercially available equine insulin standard c was used to determine recovery. Two different equine serum samples with low (<50 pmol/l) serum insulin were spiked with the commercially available equine standard (12 ng/ml) and serially diluted with the low endogenous insulin serum to achieve expected concentrations of 538, 269, 135, and 67 pmol/l. Percentage recovery was calculated as the observed (measured) concentration divided by the expected concentration.
Intra-assay coefficient of variation
Intra-assay coefficient of variation was determined on the CIA with 10 replicates of 2 equine serum–based control solutions, 1 at low and 1 at medium concentration.
Interassay coefficient of variation
Interassay CV of the CIA was determined in 3 pooled samples, high (mean: 963 pmol/l), medium (mean: 155 pmol/l), and low (mean: 53 pmol/l). The medium (mean: 83 pmol/l) and high (mean: 404 pmol/l) provided equine serum–based control solutions. Six replicates of controls, 4 replicates of medium pooled serum, and 5 replicates of high and low serum were evaluated. Insulin concentration for each solution or pooled sample was considered to be the mean of the replicate value.
Comparison of methods
Two commercially available assays for measuring insulin were used, the RIA and CIA. The RIA has been previously validated 3 for use in horses. Forty serum samples with insulin concentrations that were expected to vary over a wide range were measured with RIA and CIA. Samples evaluated by RIA were evaluated in duplicate.
Statistical analysis
Linearity and dilutional parallelism were assessed by linear regression and determination of a best-fit line. A Pearson correlation coefficient was calculated for the 40 samples analyzed by both methods. Deming regression was performed to evaluate the relationship between the RIA and CIA. Bland–Altman analysis was used to calculate bias.
Results
Linearity using equine serum–based control solutions was excellent (r2 = 0.99, P < 0.001; Fig. 1). Dilution of a high endogenous insulin (689 pmol/l) sample indicated a strong relationship between expected concentrations of the diluted sample and measured concentrations from both assays (RIA, r2 = 0.99, P < 0.001; CIA, r2 = 0.92, P = 0.009; Fig. 2).
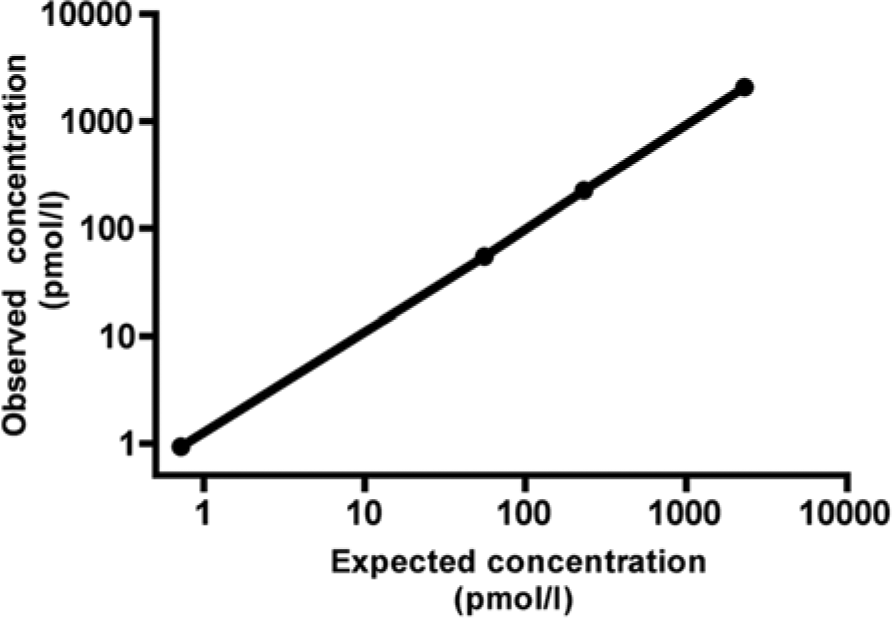
Linearity of the equine serum–based control solutions measured by chemiluminescent immunoassay with best-fit line y = 0.90x + 7.2 (r2 = 0.99, P < 0.001).
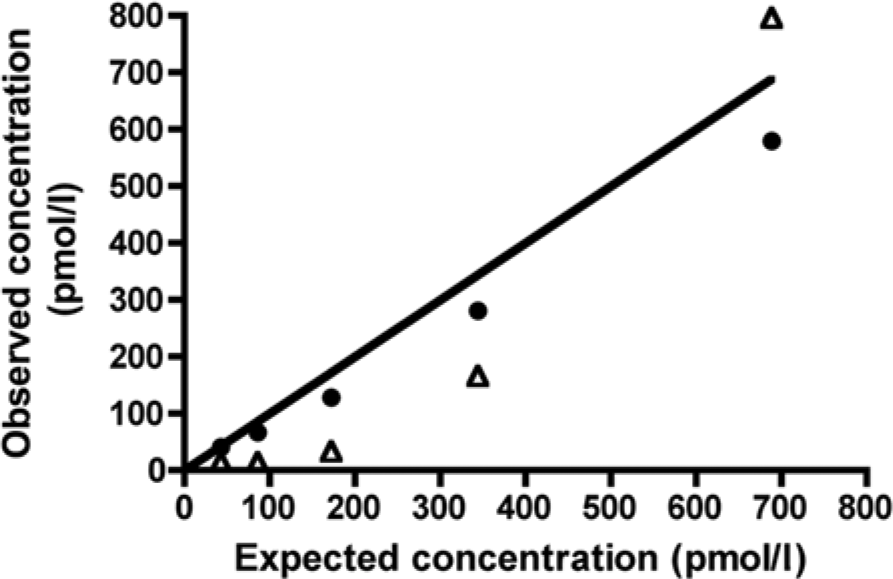
Dilution of a high endogenous insulin serum sample using a pooled low insulin serum sample measured by radioimmunoassay (RIA; filled circles) and chemiluminescent immunoassay (CIA; open triangles). Line indicates expected dilution. Best-fit line for the RIA: y = 0.84x – 6.26 (r2 = 0.99, P < 0.001). Best-fit line for the CIA: y = 1.23x – 124 (r2 = 0.92, P = 0.009).
Recovery of the equine insulin standard c using both the RIA (53.8 ± 3.9%) and the CIA (8.4 ± 2.1%) was poor (Fig. 3). When evaluating precision of the CIA, intra-assay CV of the low (75 pmol/l; acceptable range 65–86 pmol/l) and high (397 pmol/l; acceptable range 330–459 pmol/l) equine serum–based control solutions was 2.5% and 3.1%, respectively, while interassay CV was 13.7% and 5.5%, respectively. The pooled equine serum samples had interassay CV of 4.1% (high), 6.9% (medium), and 10.8% (low).
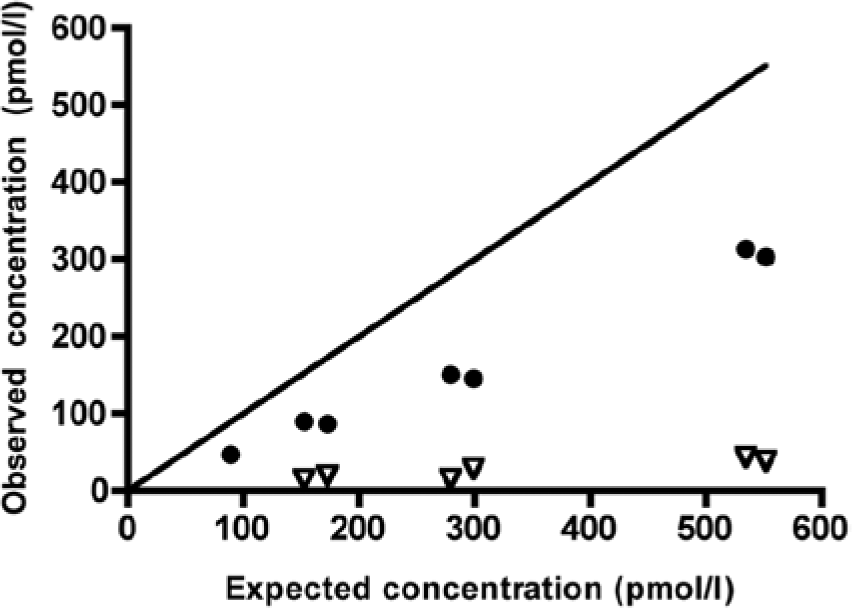
Recovery of equine insulin standard with the radioimmunoassay (filled circles) and chemiluminescent immunoassay (open triangles). Line indicates perfect recovery.
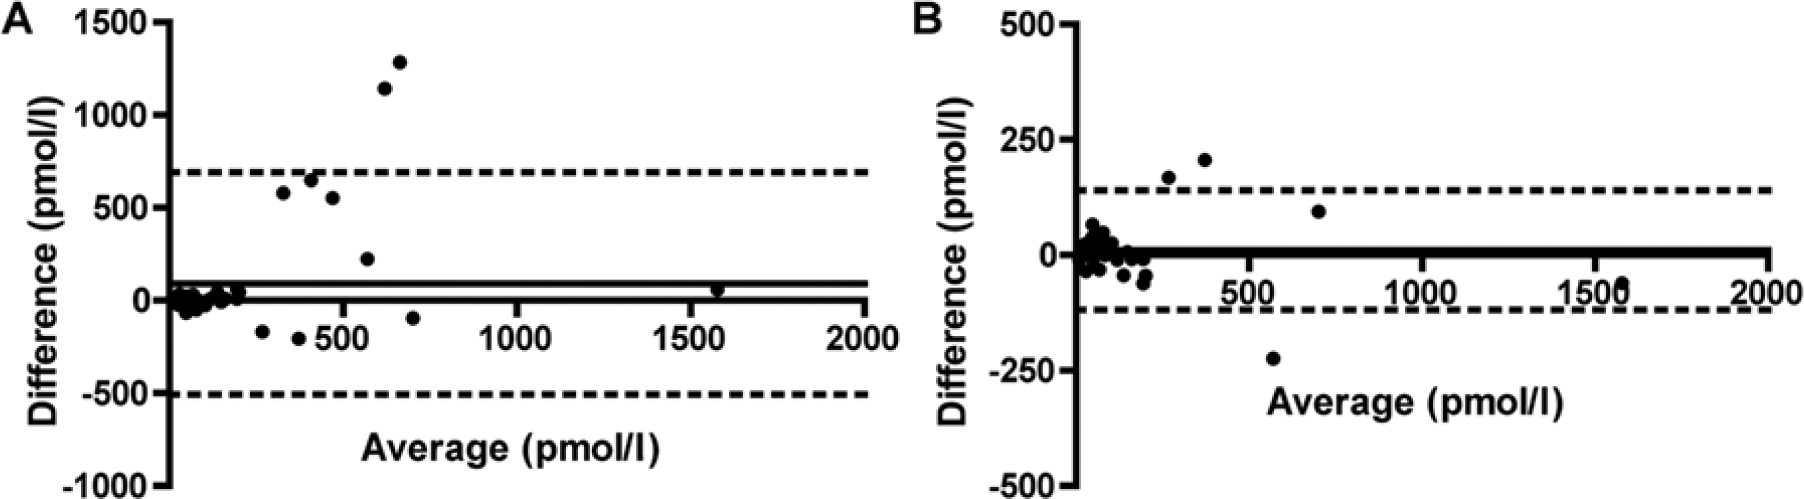
Additional determination of the validity of the CIA was performed by cross-referencing measurements to the commonly used RIA. Insulin concentrations of the 40 samples ranged from <25 to 1547 pmol/l (median: 83 pmol/l) using the RIA and from <14 to 1607 pmol/l (median: 85 pmol/l) using the CIA. Intra-assay CV for the 40 samples using the RIA was 7.4 ± 7.3% (mean ± standard deviation). Correlation analysis yielded r = 0.64 (P < 0.001). Deming regression analysis yielded a best-fit line of y = 1.81x – 36 (Fig. 4). There was no significant difference between the CIA and RIA measurements (P = 0.38). However, a bias did exist, with the CIA an average of 91 pmol/l higher than the RIA (95% limits of agreement: –508 to 691; Fig. 5). Total error was 34.6%. The bias was primarily associated with 5 discordant samples; removal of these samples from analysis yielded a bias of 10 pmol/l (95% limits of agreement: –119 to 140). With exclusion of these 5 samples, assay performance exhibited a total error of 23.4%.
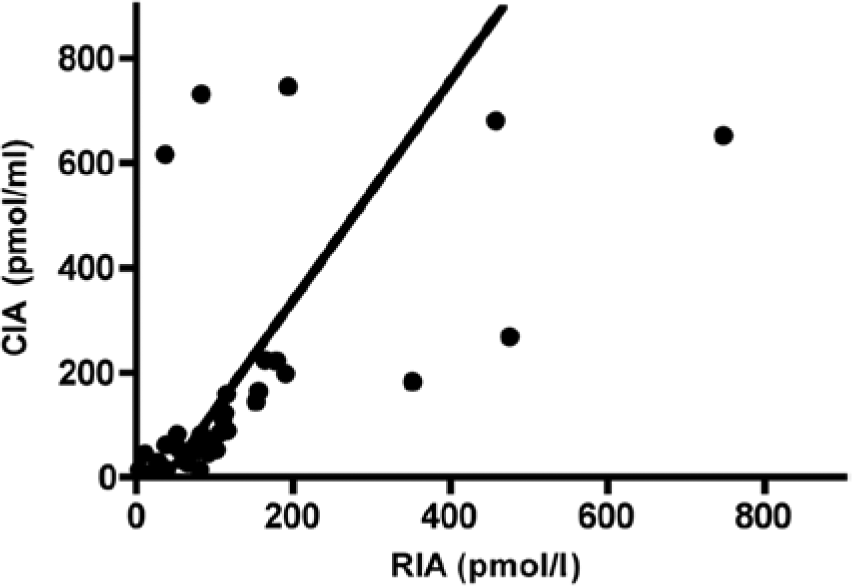
Scatterplot of radioimmunoassay (RIA) compared with chemiluminescent immunoassay (CIA) results. Deming regression analysis indicates a best-fit line of y = 1.81x – 36.
Discussion
Equine insulin is commonly evaluated by RIA in research studies. However, this assay consistently underestimates equine insulin concentrations when compared with LC-MS. 12 Although mammalian insulins demonstrate substantial homology, equine insulin does differ from porcine, human, and bovine insulin by 1–3 amino acids. 5 These substitutions may affect insulin binding due to different secondary, tertiary, or quaternary protein structure.1,4 Depending on the amino acid sequence recognized by antibodies in different immunoassays, available assays may vary in detection of equine insulin. This was recently confirmed in an evaluation of 6 different commercially available insulin assays in comparison to LC-MS. 12 An accurate, quick method for measuring serum insulin in the horse remains to be identified. The CIA performs well in people, with 95% of samples falling within the 32% total error 9 allowed for insulin assays. 8 However, despite being in use in clinical equine practice, 2 the CIA has not yet been validated for use in horses.
Recovery was poor in both assays, but substantially worse (average: <10%) when using the CIA. Poor recovery of equine insulin using commercially available assays has been previously reported 12 and may be a product of decreased binding of antibodies to equine insulin compared to human insulin. The observation that the linearity of the CIA was excellent when using provided equine serum–based control solutions containing human insulin, but deteriorated when using a high endogenous insulin equine serum, would support this explanation. It is also possible that the equine insulin standard had an actual concentration that was lower than the labeled concentration, leading to a lower than expected recovery. A role of the equine insulin standard in poor recovery is supported by the observation of lower than expected concentrations of standard in both the RIA and CIA. Ideally, LC-MS quantification of the equine insulin standard would have been performed to determine the role of inaccurate insulin standard concentration in the recoveries found herein. However, depletion of the equine insulin standard in the recovery assays precluded evaluation via LC-MS.
Additional evaluation of the CIA included comparison to the commonly used RIA. Poor agreement was found between the CIA and RIA for measuring equine insulin. For assays measuring human insulin, it is recommended that total error not cause more than 12% error in appropriate categorization (i.e., within reference range or outside of reference range) for a given sample. 8 Acceptable measurement bias and total acceptable error are in part determined by biological variation of the analyte. For insulin assays, within-individual variation has been reported to be 25%, and within-group variation for healthy individuals has been reported to be 56%. 7 Recommendations for measurement of insulin concentrations include a bias <15.5%, imprecision <10.6%, and total analytical error <32% for a single result at concentrations within the reference interval. 8 With all samples included, the total analytical error (34.6%) of the CIA exceeded the current recommendations for human insulin measurements.
Much of the bias and wide limit of agreement observed between assays was attributable to 5 samples. When these 5 samples were removed from analysis, average bias improved to 11 pmol/l, and total error to 23.4%, which is within allowable disagreement for human insulin assays. Because of the dramatic improvement of agreement with removal of samples from these horses, additional analysis of the possible reasons for discordance is warranted. As common interfering substances (lipids, hemolysis, bilirubin) have been previously documented to falsely lower CIA results in people (Siemens Healthcare: 2003, Immulite insulin), and visual inspection of the samples did not indicate lipemia, hyperbilirubinemia, or hemolysis as a likely source of interference, other alternatives should be explored, such as the presence of heterophilic or anti-animal antibodies or other matrix components. 11
The CIA and RIA do not consistently yield similar results when used to analyze equine insulin. The presence of discordant samples indicates that misclassification of horses (as hyperinsulinemic or normoinsulinemic) may occur with one of the assays, although which assay yields the most accurate results remains to be determined. Additional analysis of samples via LC-MS would allow for determination of the most accurate method for measurement of equine insulin; however, due to the limited availability and expense of this technique, LC-MS was not performed in the present study. Identification of the reason for the discordance between assays may allow for methods to be developed that would eliminate the interfering substance and allow harmonization of the CIA and RIA for measurement of equine insulin. Harmonization of the methods for measurement of equine insulin would allow for comparison between assays and across studies.
Footnotes
a.
Siemens, Tarrytown, NY.
b.
Coat-A-Count, Siemens, Tarrytown, NY.
c.
Shibayagi Co., Ishihara, Japan.
d.
Novolin R, Novo Nordisk Pharmaceuticals, Princeton, NJ.
Declaration of conflicting interests
The author(s) declared no potential conflicts of interest with respect to the research, authorship, and/or publication of this article.
Funding
The author(s) declared that they received no financial support for their research and/or authorship of this article.