
Abstract
To enable future comparison of the antimicrobial susceptibility data between bacteria obtained from animals and humans, it is necessary to compare the relationships between minimum inhibitory concentrations (MICs) of veterinary and human medicine. We evaluated the relationship between the MIC of ceftiofur (CTF) and the MICs of other third-generation cephalosporins (TGCs): cefotaxime (CTX), cefpodoxime (CPDX), and ceftazidime (CAZ), determined by the broth microdilution method using 118 cefazolin-resistant Escherichia coli isolates from food-producing animals. Using the Clinical and Laboratory Standards Institute criteria, very major classification errors were observed only in CAZ (17.8%, 21 of 118); major and minor errors were observed in all TGCs (CTX: 0.8% [1 of 118] and 9.3% [11 of 118]; CPDX: 9.3% [11 of 118] and 6.8% [8 of 118]; CAZ: 2.5% [3 of 118] and 9.3% [11 of 118], respectively). The Spearman correlation coefficients between the MICs of CTF and CTX, CPDX, and CAZ were 0.765, 0.731, and 0.306, respectively. The sensitivity and specificity values were 100.0% and 81.8% for CTX, 99.0% and 27.3% for CPDX, and 76.0% and 86.4% for CAZ compared with CTF. The C-statistic was 0.978 for CTF and CTX, 0.953 for CPDX, and 0.798 for CAZ. For the TGCs evaluated in our study, testing for CTX susceptibility results showed the highest correlation with the results given when testing for CTF susceptibility.
In 2015, the World Health Organization (WHO) announced that antimicrobial resistance threatens the very core of modern medicine and the sustainability of an effective, global public health response to the enduring threat from infectious diseases (https://goo.gl/i6YzrC). In order to assess the public health impact of antimicrobial resistance associated with the use of antimicrobials in food animals, it is crucial to conduct integrated surveillance of antimicrobial resistance in animals and humans. The WHO also recommended that countries develop antimicrobial surveillance programs that integrate the data on isolates from humans, food-producing animals, and retail meats (https://goo.gl/POF20G).
Third-generation cephalosporins (TGCs) are globally important antimicrobial agents in human and veterinary medicine. Two TGCs, ceftiofur (CTF) and cefpodoxime (CPDX), are approved for the treatment of cattle, swine, dogs, or cats in Japan (http://www.maff.go.jp/nval/), and CTF is the representative TGC for antimicrobial resistance surveillance in veterinary medicine (Japanese Veterinary Antimicrobial Resistance Monitoring, 2013, https://goo.gl/wB583u; Swedish Veterinary Antimicrobial Resistance Monitoring, 2014, https://goo.gl/UME1xG). For human treatment, cefotaxime (CTX), ceftazidime (CAZ), and CPDX have been approved in Japan (https://www.pmda.go.jp/), and have been part of antimicrobial resistance monitoring programs (Japan Nosocomial Infectious Surveillance, 2006, https://goo.gl/FgXqUN; Danish Integrated Antimicrobial Resistance Monitoring and Research Programme, 2015, https://goo.gl/EbJKat). To enable future comparisons of the surveillance results of TGC resistance between veterinary and human monitoring, it is necessary to compare the relationships between the MIC of CTF and those of CTX, CPDX, and CAZ.
We determined the MIC of cefazolin (CFZ) for 2,356 Escherichia coli isolates from fecal samples of healthy food-producing animals—cattle, pigs, and layer chickens—and subsequently determined the MIC of CTF, CTX, CPDX, and CAZ for CFZ-resistant E. coli. Moreover, we determined the MIC of CTF, CPDX, and CAZ for 93 CFZ-resistant E. coli isolates from fecal samples of healthy broiler chickens as described in a previous report. 9 The MIC of CTX for the 93 isolates had already been determined in the earlier report. 9 We also evaluated the frequency of very major, major, and minor errors, correlation coefficients, sensitivity, specificity, receiver operating characteristic (ROC) curve, and the area under the ROC curve (C-statistics).
The MICs for CFZ, CTF, CTX, CPDX, and CAZ were determined by the broth microdilution method using a commercial broth microdilution test kit (Eiken, Tokyo, Japan), following the guidelines of the Committee for Clinical and Laboratory Standards Institute (CLSI). 3 Based on the CLSI criteria,4,5 the MIC results were classified as susceptible, intermediate, or resistant (CFZ: susceptible, ≤8 mg/L; intermediate, 16 mg/L; resistant, ≥32 mg/L; CTF and CPDX: susceptible, ≤2 mg/L; intermediate, 4 mg/L; resistant, ≥8 mg/L; CTX: susceptible, ≤1 mg/L; intermediate, 2 mg/L; resistant, ≥4 mg/L; and CAZ: susceptible, ≤4 mg/L; intermediate, 8 mg/L; resistant, ≥16 mg/L).4,5
Error classification was assessed using the interpretive criteria for susceptibility. 2 In this system, a very major error occurs when the MIC results of an E. coli isolate indicate resistance to CTF and susceptibility to other TGCs. A major error occurs when the E. coli MIC indicates susceptibility to CTF and resistance to other TGCs, and minor errors occur when the E. coli MIC indicates intermediate sensitivity to CTF and susceptibility or resistance to other TGCs.
Correlation coefficients were defined in terms of the Pearson product moment and Spearman rank order. For the Pearson correlation coefficient, the MICs were first converted to a log scale. Off-scale MICs were treated in 2 ways. First, the low off-scale MICs (CTF: ≤0.06 mg/L; CTX: ≤1 mg/L; CPDX: ≤1 mg/L; CAZ: ≤1 mg/L) were recorded as follows: CTF: 0.06 mg/L; CTX: 1 mg/L; CPDX: 1 mg/L; CAZ: 1 mg/L. The high off-scale MICs (CTF: >8 mg/L; CTX: >128 mg/L; CPDX: >128 mg/L; CAZ: >128 mg/L) were converted to the next highest concentration (CTF: 16 mg/L; CTX: 256 mg/L; CPDX: 256 mg/L; CAZ: 256 mg/L). 6 Second, the off-scale MICs were excluded. 8 For the Spearman rank order correlation coefficient calculation, the off-scale MICs were only treated by the first method.
To correctly identify the resistance or susceptibility (including the intermediate susceptibility) to CTF, we calculated the sensitivity and specificity of each TGC. Isolates showing resistance or susceptibility to CTF and each TGC were considered as true positives and true negatives, respectively. By plotting the sensitivity versus (1 − specificity), we obtained the ROC curve, varying the cutoff value for each TGC while fixing the cutoff of CTF. Each point on the ROC plot represents a sensitivity/specificity pair corresponding to a particular decision threshold. 16 The discriminatory ability of each TGC to distinguish susceptibility or resistance to CTF was indicated by the C-statistics, calculated from the areas under the ROC curves. All data were analyzed using EZR on R commander (v.1.03, provided on-site by the Division of Hematology, Saitama Medical Center, Jichi Medical University, Saitama, Japan). 12
A total of 25 CFZ-resistant E. coli isolates from cattle (6 isolates), pigs (10 isolates), and layer chickens (9 isolates) were detected in the 2,356 E. coli isolates examined. The relationship between the MICs of CTF and the MICs of each TGC in the total of 118 CFZ-resistant strains (includes the 93 CFZ-resistant E. coli isolates from broiler chickens) is shown in Figure 1. Table 1 lists the error rates between the results classified with CTF and various TGCs. Only CAZ yielded very major errors (17.8%, 21 of 118). Both major and minor errors were observed for all TGCs. The finding that CAZ yielded a high number of very major errors suggests that the resistance and susceptibility results of CAZ and CTF may be contradictory.
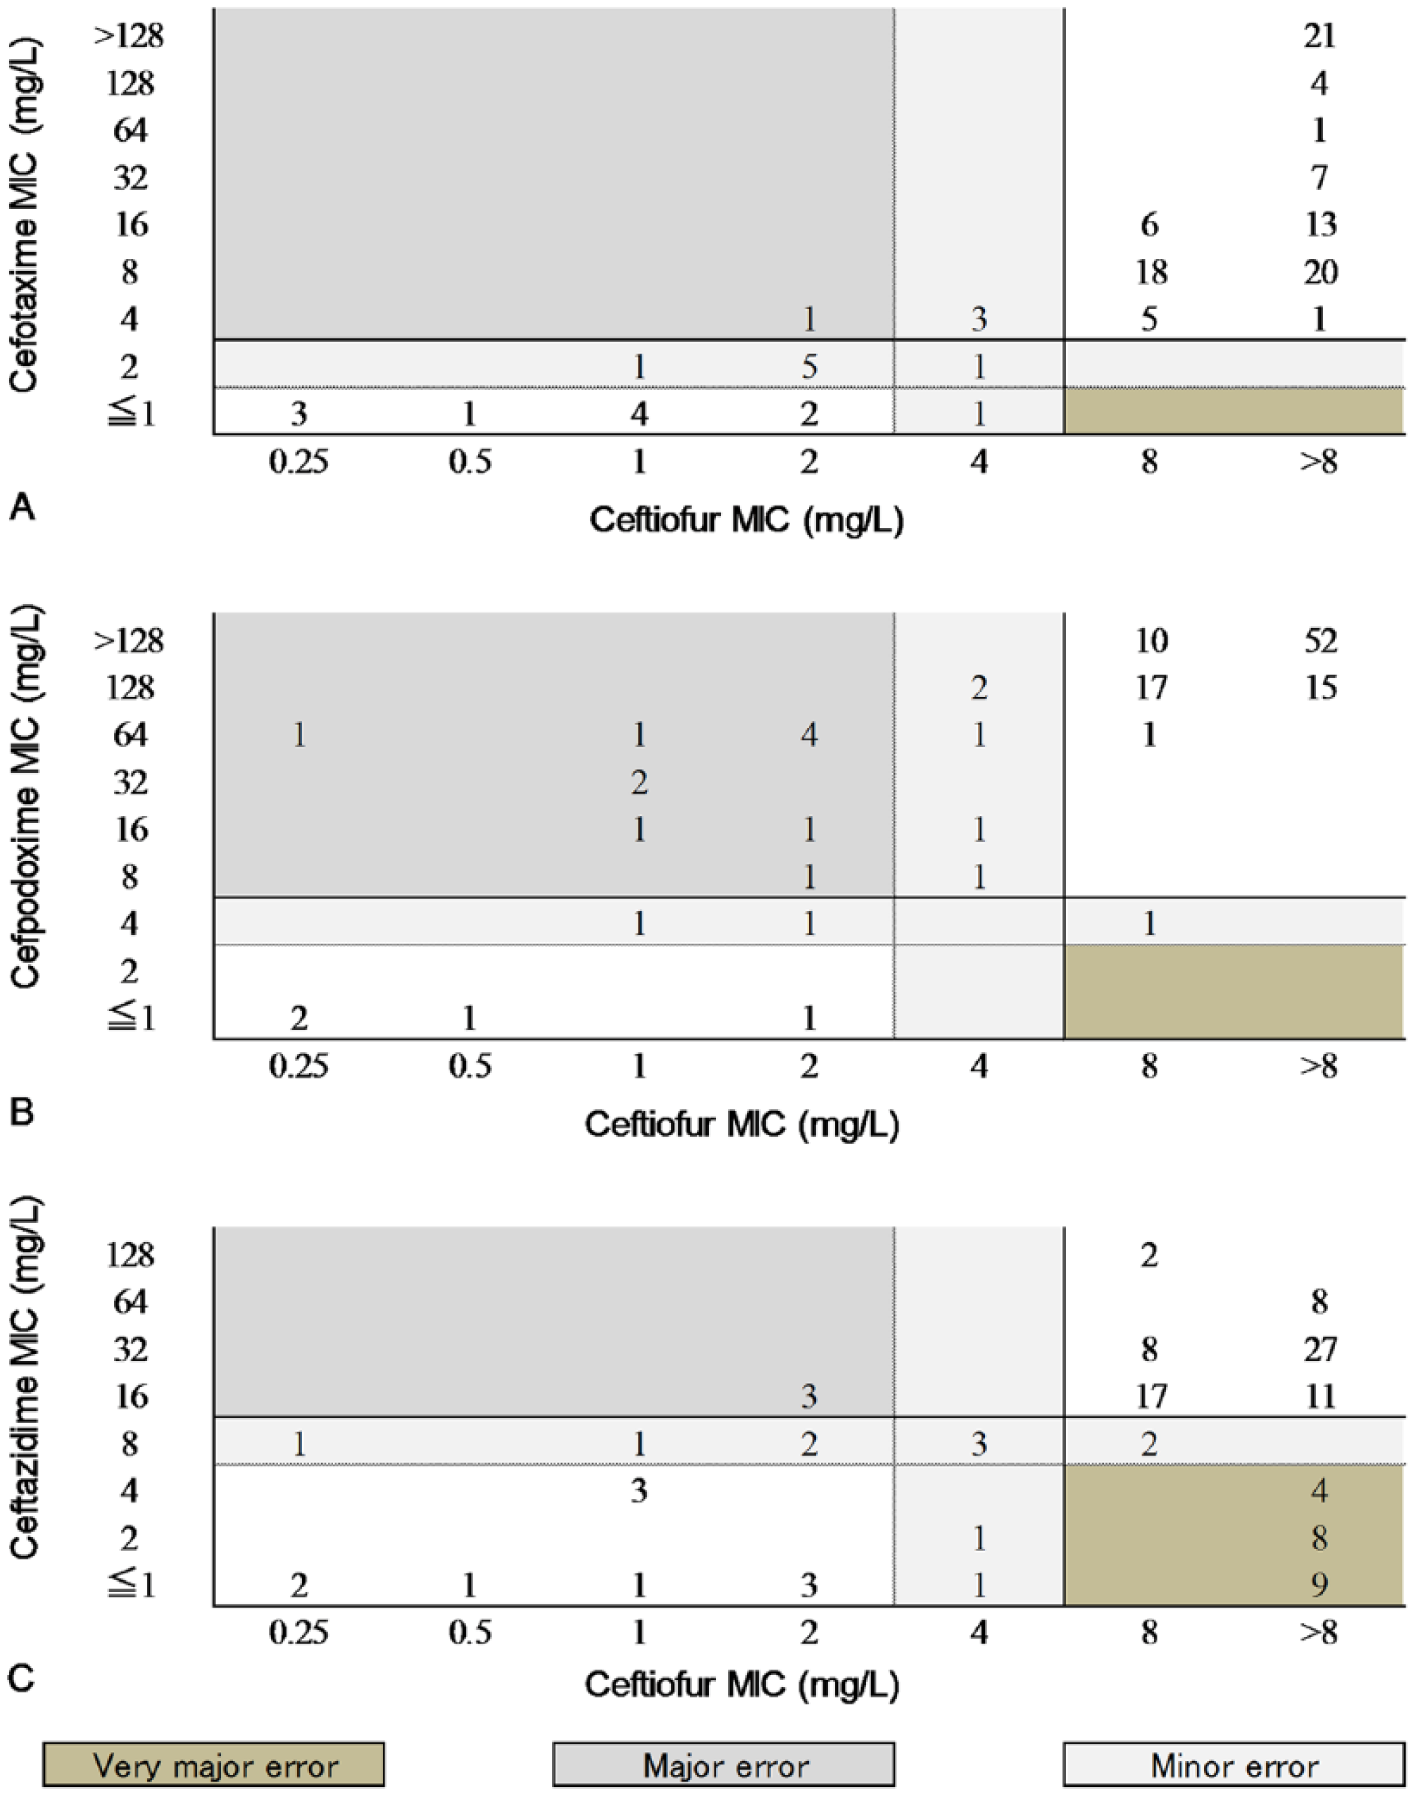
The relationship between the minimal inhibitory concentrations (MICs) of ceftiofur and each third-generation cephalosporin. A dotted line indicates the Clinical and Laboratory Standards Institute (CLSI) breakpoint for susceptibility, and a solid line indicates the CLSI breakpoint for resistance.
Comparison of the minimal inhibitory concentrations (MICs) of each third-generation cephalosporin against the MICs of ceftiofur using several statistical methods.*
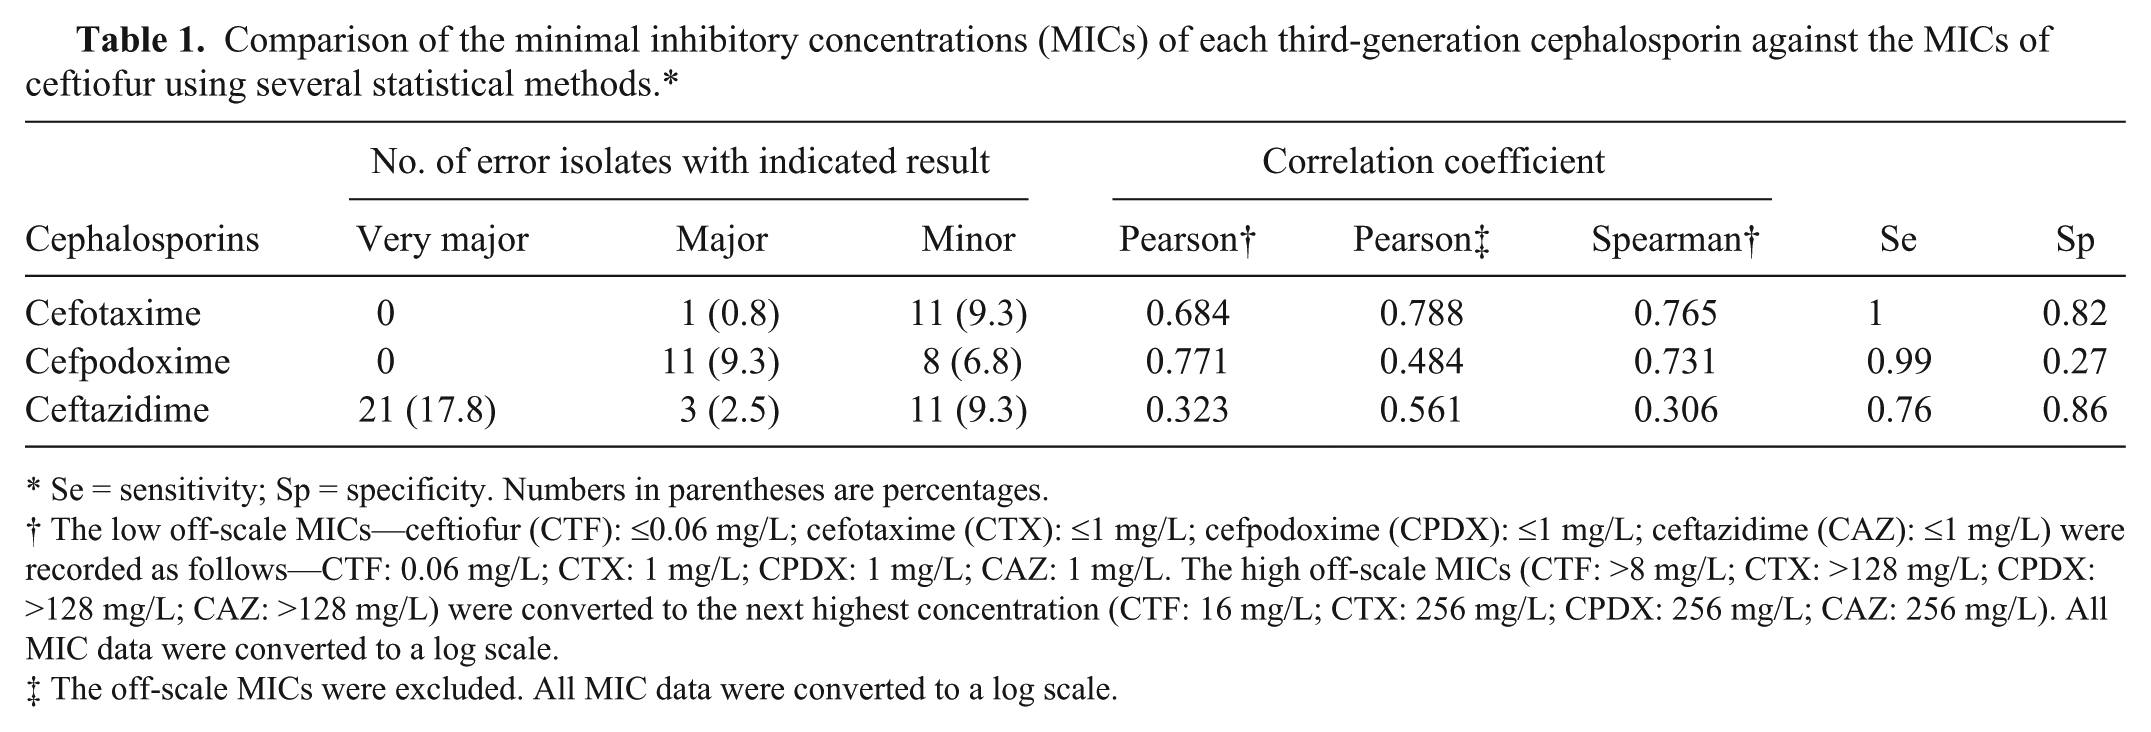
Se = sensitivity; Sp = specificity. Numbers in parentheses are percentages.
The low off-scale MICs—ceftiofur (CTF): ≤0.06 mg/L; cefotaxime (CTX): ≤1 mg/L; cefpodoxime (CPDX): ≤1 mg/L; ceftazidime (CAZ): ≤1 mg/L) were recorded as follows—CTF: 0.06 mg/L; CTX: 1 mg/L; CPDX: 1 mg/L; CAZ: 1 mg/L. The high off-scale MICs (CTF: >8 mg/L; CTX: >128 mg/L; CPDX: >128 mg/L; CAZ: >128 mg/L) were converted to the next highest concentration (CTF: 16 mg/L; CTX: 256 mg/L; CPDX: 256 mg/L; CAZ: 256 mg/L). All MIC data were converted to a log scale.
The off-scale MICs were excluded. All MIC data were converted to a log scale.
Pearson and Spearman correlation coefficients have been used in previous comparisons of antimicrobial susceptibility test results.1,7,11,13 Pearson correlation coefficients between the MICs of CTF and the TGCs of CTX, CPDX, and CAZ were 0.684, 0.771, and 0.323, respectively (Table 1), when the low off-scale MICs were left unchanged and the high off-scale MICs were converted to the next highest concentration. However, when the off-scale MICs were excluded, the Pearson correlation coefficients between the MICs of CTF and CTX, CPDX, and CAZ were 0.788, 0.484, and 0.561, respectively. The Spearman correlation coefficients between the MICs of CTF and CTX, CPDX, and CAZ, were 0.765, 0.731, and 0.306, respectively (Table 1). Thus, the correlation coefficients depended on both the statistical analysis method and the treatment method for off-scale MICs. However, the correlations of CTX versus CTF were consistently higher than other TGC correlations.
We confirmed the relationship among the MICs by several statistical methods. The results of a sensitivity analysis, evaluated by the sensitivity, specificity, ROC curve, and C-statistics, are presented in Table 1 and Figure 2. The sensitivity and specificity agreements between CTF and CTX were 100.0% (96 of 96) and 81.8% (18 of 22), respectively. The respective CTF–CPDX agreements were 99.0% (95 of 96) and 27.3% (6 of 22), and the CTF–CAZ agreements were 76.0% (73 of 96) and 86.4% (19 of 22). The perfect sensitivity agreement between CTF and CTX indicates that CTF-resistant E. coli can be correctly identified when tested with CTX. In the ROC curve analysis, if the plot locates near the upper left corner, the overall accuracy of the test is high. 16 In our study, the plot of 4 mg/L for CTX and 16 mg/L for CAZ, in which the concentrations are the breakpoint concentrations specified in the CLSI guidelines, 5 were concentrated in the upper left corner. However, the plot of 8 mg/L for CPDX (the breakpoint concentration specified by CLSI 5 ) was located outside of this corner, and 128 mg/L was the value closest to the upper left corner. Therefore, for comparison with CTF, 128 mg/L for CPDX was more appropriate than 8 mg/L. In C-statistics, the values fluctuate between 1.0 (i.e., completely distinguishable) and 0.5 (i.e., indistinguishable). The C-statistics of CTX, CPDX, and CAZ were 0.978, 0.953, and 0.798, respectively.
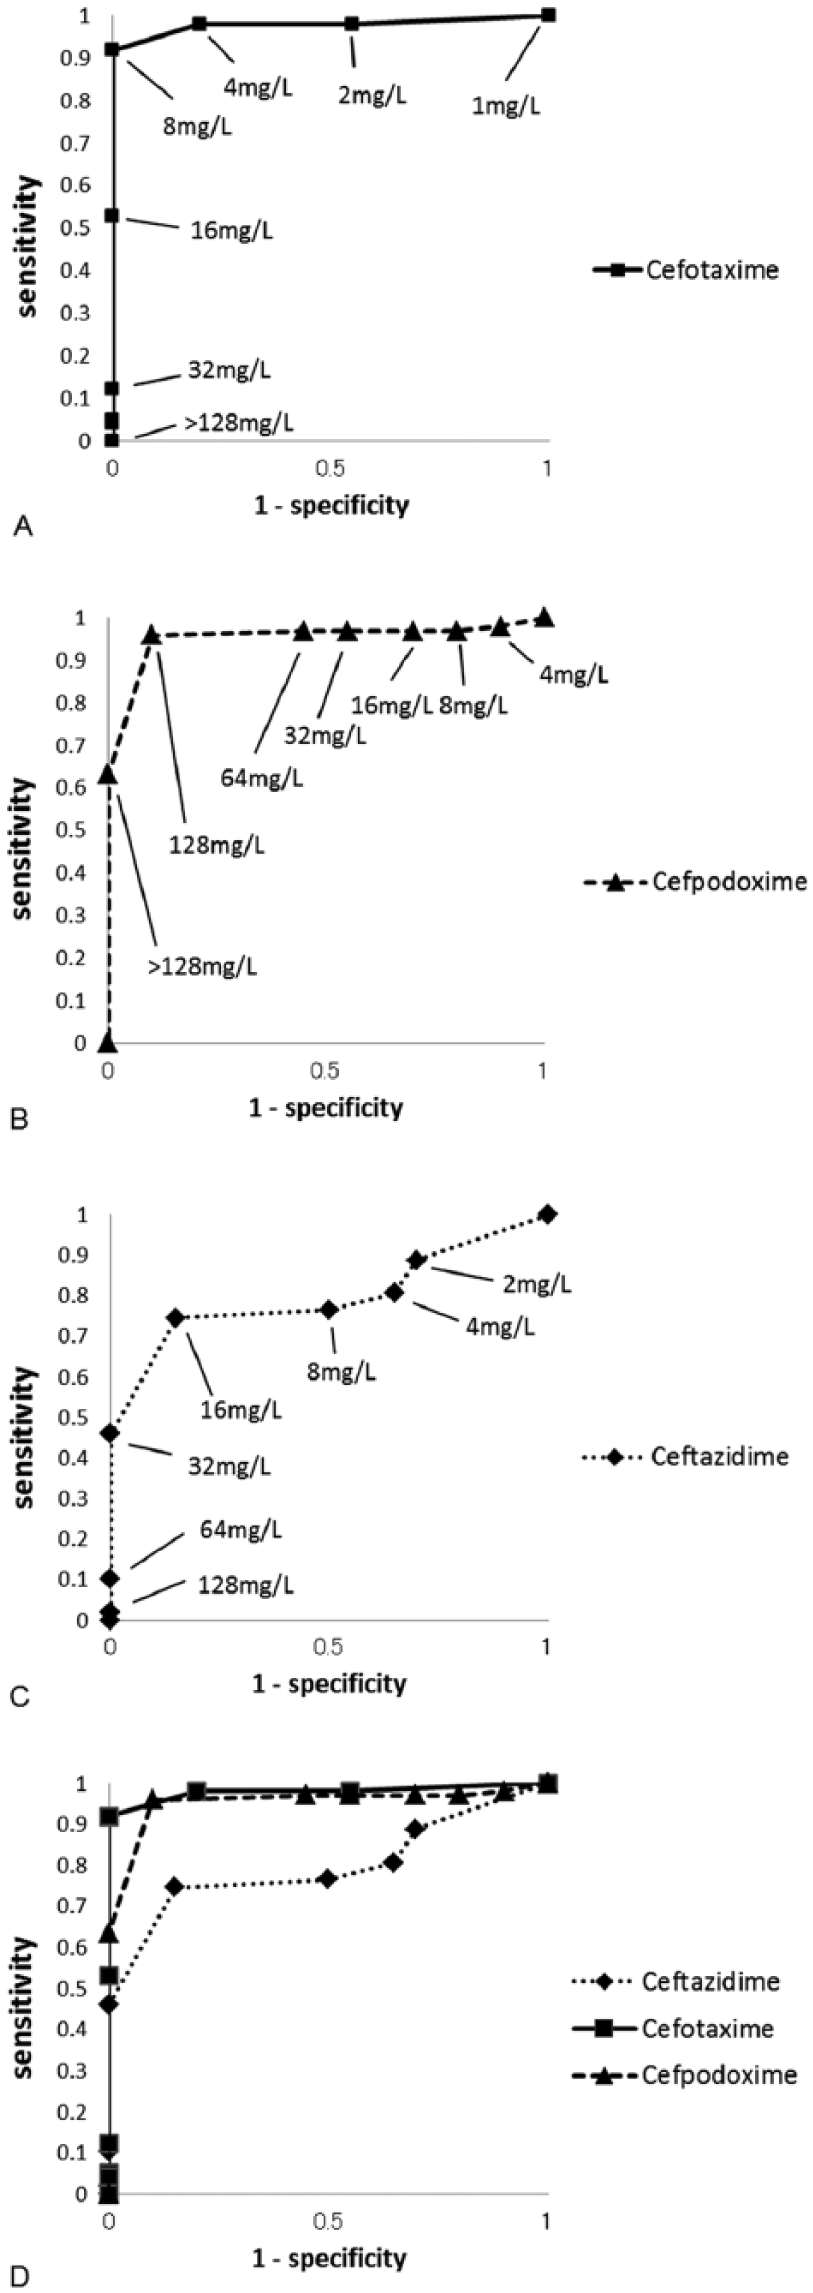
The receiver operating characteristic (ROC) curve plotted from minimal inhibitory concentrations (MICs) of each third-generation cephalosporin against MICs of ceftiofur. Although the cutoff value for ceftiofur was fixed at 8 mg/L and defined as the breakpoint according to Clinical and Laboratory Standards Institute (CLSI) guidelines, the values of 1 minus specificity obtained from the cutoff values for each third-generation cephalosporin fluctuated and were plotted to produce a ROC curve. The breakpoints defined according to CLSI guidelines were 8 mg/L for ceftiofur, 4 mg/L for cefotaxime, 8 mg/L for cefpodoxime, and 16 mg/L for ceftazidime.
In Japan, CTF-resistant E. coli strains in food-producing animals have mainly been isolated from broilers. 10 An AmpC β-lactamase gene, blaCMY-2, and an expended-spectrum β-lactamase gene, blaCTX-M, have been predominantly detected in these strains.9,10,14 E. coli INVαF′ containing the blaCMY-2 or blaCTX-M gene has been shown to be resistant to CTF, CTX, and CPDX, but susceptible to CAZ. 14 Moreover, CTX-M β-lactamase can hydrolyze CTX and CPDX at similar rates, but cannot hydrolyze CAZ efficiently. 15 Therefore, we suggest that the high number of very major errors and the low correlation of CAZ compared with those of CTX and CPDX reflect the different hydrolytic activities of β-lactamases.
Footnotes
Acknowledgements
We thank the staff of the Livestock Hygiene Service Centers located throughout Japan for collecting samples and isolating Escherichia coli.
Declaration of conflicting interests
The authors declare no potential conflicts of interest with respect to the research, authorship, and/or publication of this article.
Funding
This work was supported in part by a grant-in-aid from the Japanese Ministry of Health, Labour and Welfare (H27-Shokuhin-Ippan-008).