
Abstract
Mycoplasma bovis is an important pathogen of cattle, causing mastitis, pneumonia, conjunctivitis, otitis, and arthritis. Currently there are only a few reports of sensitivity levels for M. bovis isolates from the United States. Mycoplasma bovis isolates submitted to the Pennsylvania Animal Diagnostic Laboratory between December 2007 and December 2008 (n = 192) were tested for antimicrobial susceptibility to enrofloxacin, erythromycin, florfenicol, spectinomycin, ceftiofur, tetracycline, and oxytetracycline using a broth microdilution method. The most effective antimicrobials against M. bovis determined by using the broth microdilution method were florfenicol, enrofloxacin, and tetracycline with minimum inhibitory concentration (MIC) ranges of 2–32 µg/ml, 0.1–3.2 µg/ml, and 0.05 to >12.8 µg/ml, respectively. Spectinomycin, oxytetracycline, and tetracycline showed a wide-ranging level of efficacy in isolate inhibition with broth microdilution with MIC ranges of 4 to >256 µg/ml, 0.05 to >12.8 µg/ml, and 0.05 to >12.8 µg/ml, respectively. A significant difference in the susceptibility levels between quarter milk and lung isolates was found for spectinomycin. When MIC values of a subset of the M. bovis isolates (n = 12) were tested using a flow cytometric technique, the MIC ranges of enrofloxacin, spectinomycin, ceftiofur, erythromycin, tetracycline, oxytetracycline, and florfenicol ranges were 0.1–0.4 µg/ml, 4 to >256 µg/ml, >125 µg/ml, >3.2 µg/ml, <0.025 to >6.4 µg/ml, 0.8 to >12.8 µg/ml, and <2–4 µg/ml, respectively. Flow cytometry offers potential in clinical applications due to high-throughput capability, quick turnaround time, and the objective nature of interpreting results.
Mycoplasma bovis, a pathogenic mollicute first reported in 1961, is associated with pneumonia, mastitis, conjunctivitis, otitis, and arthritis in cattle. 8 Reports from Europe suggest that M. bovis is found in 13–50% of animals with disease. 13 It is unclear what percentage of disease in the United States may be attributed to M. bovis since large-scale epidemiological studies have not been performed. Poor efficacy of M. bovis vaccines produces few clinical options. Mycoplasma bovis infections are either treated with antimicrobials, which frequently do not clear the infection, or infected animals are culled. There is concern over the increasing resistance to frequently administered antimicrobials, including spectinomycin, tetracycline, and tilmicosin. 14
The unique characteristics of M. bovis, such as the lack of a cell wall, cause concern regarding treatment options due to the ineffectiveness of cell wall–targeting antimicrobial therapies. Clinical Laboratory Standards Institute (CLSI)-approved and standardized levels of minimum inhibitory concentrations (MIC) for antimicrobials have not been established regarding Mycoplasma species. 9,11,12 Multiple methods have been employed in order to determine MICs in many species of Mycoplasma. These methods have included broth dilutions, solid agar testing, E-strip testing, and most recently, flow cytometry. 2,6,9,10,15,16,18 The MIC values have been determined for Mycoplasma agalactiae, Mycoplasma hyopneumoniae, Mycoplasma putrefaciens, Mycoplasma capricolum, and Mycoplasma mycoides using a selection of antimicrobials with flow cytometry for one isolate of each. 1–3 The objectives of the current study were to employ a microdilution method to determine the MIC of 7 antimicrobials on M. bovis isolates (n = 192) submitted to the Pennsylvania Animal Diagnostic Laboratory (PA-ADL; University Park, PA) between December 2007 and 2008 and to explore the use of a flow cytometry method for determination of antimicrobial sensitivity for M. bovis isolates that can be easily adopted in a diagnostic setting.
All Mycoplasma bovis–positive samples sent to the PA-ADL were collected from December 2007 to December 2008 (n = 192). Each sample was grown on a pleuropneumonia-like organism (PPLO) agar plate a at 37°C and 5% CO2 until growth was noted. Under a light microscope, a small section of the agar was identified that contained less than 5 Mycoplasma colonies and no gross contamination from other bacteria. The section was excised from the agar and placed in PPLO broth a for 48 hr at 37°C and 5% CO2. The resulting broth suspension was plated again and the process repeated. The final broth suspension was stored in with 10% glycerol at –80°C until ready to use in testing. All isolates submitted to the PA-ADL were confirmed to be M. bovis (n = 192) using polymerase chain reaction with specific primers for the uvrC gene of M. bovis before they were tested for antimicrobial activity using 96-well round-bottom plates. 17
Antimicrobial susceptibility testing was performed using the redox reagent resazurin b following a previously described broth microdilution procedure. 15 Early log phase suspensions of M. bovis (3 × 10³−3 × 10⁵ cfu/ml) were exposed to doubling concentrations of enrofloxacin c starting at 0.0125 µg/ml, spectinomycin c at 1 µg/ml, erythromycin c at 0.0125 µg/ml, tetracycline c at 0.025 µg/ml, oxytetracycline c at 0.05 µg/ml, ceftiofur d at 0.49 µg/ml, and florfenicol e at 2 µg/ml in the presence of 5% resazurin. These levels were selected as starting concentrations based upon previous research. 2,4,6,9,10,15,16,18 All plates were sealed to prevent gas exchange between wells. Each isolate was run in duplicate on a sterile 96-well round-bottom plate composed of 9 dilutions of the 7 antimicrobials, 1 negative control (no antimicrobial and no culture), and 2 positive controls (no antimicrobial present with culture). Additional plates containing each concentration of the 7 antimicrobials in the presence of 5% resazurin without culture were sealed and incubated for 10 days. The MIC level was determined as the lowest concentration of antimicrobial suppressing growth, as expressed by a blue to red shift. In testing plates, MIC was identified at 24 hr as the lowest concentration of antimicrobial agent with color shift from blue to red. The MIC90 for each isolate and antimicrobial was recorded. The highest MIC of the duplicate runs was used for further analysis. All sample duplicates were within at least 2 dilution levels of each other.
Only the antibiotics that demonstrated activity against at least 1 sample were considered for statistical analysis. The MIC90 values were analyzed separately using G-test of independence f (r × c contingency tables), testing the independence of the active antimicrobials, and grouping of isolates by geographic region and sample origin. Only variables with greater than 5 samples were tested, therefore only quarter milk and lung were used. Results were considered significant at a p-value of less than 0.05, confidence interval 95%.
Isolates selected for the proof of concept for flow cytometry included M. bovis isolates from milk sources (n = 6) and lung (n = 6) from the collection of 192 M. bovis isolates received at the PA-ADL between December 2007 and December 2008. Two of the isolates selected were obtained from the same farm location; the other samples were unrelated by farm location. Mycoplasma enrichment broth without supplements was filtered using a 0.2-µm pore size. g Mycoplasma absolute cell counts were gathered using 6 µM of fluorescent polystyrene latex microspheres, h and regions of analysis were determined using heat-injured M. bovis cells according to the procedures previously described. 4 Early log phase suspensions of M. bovis (~4.5 × 10⁵cfu/ml) grown at 37°C and 5% CO2 were exposed to doubling concentrations of enrofloxacin c starting at 0.0125 µg/ml, spectinomycin c at 1 µg/ml, erythromycin c at 0.0125 µg/ml, tetracycline c at 0.025 µg/ml, oxytetracycline c at 0.05 µg/ml, ceftiofur d at 0.49 µg/ml, and florfenicol e at 2 µg/ml. Each antimicrobial stock solution was prepared on the day of analysis. Cell populations were examined for living and injured or dead M. bovis at 0, 3, 6, 12, and 24 hr. A final MIC90 value was assigned at the 24-hr reading. Propidium iodide i at a concentration of 4 mg/ml was added to each sample to determine the amount of cell membrane damage. SYBR Green I i at a 1:10,000 vol/vol concentration was used to identify nucleic acids corresponding to a viable cell population in samples. A red fluorescent nucleic acid stain (SYTO i ) was tested, but SYBR Green I was shown to give a stronger signal. Each sample was incubated for 15 min in the dark before the analysis on the flow cytometer. Analyses were performed on a flow cytometer j with System II Software Version 3.0 using forward scatter (FS) and side scatter (SSC) dot plots to count 20,000 cells at low flow rate providing the cellular physical properties of size and granularity. After 488-nm laser excitation, a 550-nm dichroic long pass filter split the emission, sending the green light to PMT1, which has an additional 525 nm band-pass filter and the red light to PMT3, which has an additional 610-nm band-pass filter. Propidium iodide–positive cells were eliminated from the green distribution. Data, collected in a 4-decade logarithmic scale, were analyzed using WinMDI (v. 2.8) k and FCS Express Research Edition (v. 3) l software packages. All data for the present study were found in the F2 quadrant. Additional quadrants were created, and color schemes were assigned for cells positive for each fluorochrome. All experiments were duplicated on a separate day.
The M. bovis isolates sent to PA-ADL from Vermont, Maryland, and Pennsylvania represented 27 U.S. zip codes from 34 individual farms. A total of 18 counties were represented in Pennsylvania (n = 186), 1 in Maryland (n = 1), and 1 in Vermont (n = 5). Multiple sites of infection including quarter milk (n = 151), lung (n = 33), tympanic cavity (n = 2), carpus joint (n = 1), nasal swab (n = 1), and bulk tank milk (n = 4) were represented by the samples. Samples grouped by sample source showed similar antimicrobial activity profiles between farm location and antimicrobial susceptibility level (no significant interactions between location and antimicrobial action was found at p < 0.05). However, 67.5% of quarter milk samples versus 24.2% of lung samples had a MIC level greater than or equal to 128 µg/ml, indicating resistance if using CLSI interpretative criteria for bovine respiratory disease pathogens (Mannheimia haemolytica, Pasteurella multocida, and Histophilus somni). 11,12 The difference between the spectinomycin resistance lung and quarter milk samples is significant (p < 0.001) using a G-test of independence. There was no significant difference between tetracycline, oxytetracycline, enrofloxacin, or florfenicol activity and sample origin. Erythromycin and ceftiofur did not demonstrate growth inhibition of M. bovis at the concentrations tested and were therefore not included in any statistical comparisons. The broth microdilution antimicrobial susceptibility ranges for enrofloxacin, spectinomycin, ceftiofur, erythromycin, tetracycline, oxytetracycline, and florfenicol were 0.025–3.2 µg/ml, 2 to >256 µg/ml, >125 µg/ml, >3.2 µg/ml, 0.05 to >12.8 µg/ml, 0.05 to >12.8 µg/ml, and <1 to 32 µg/ml, respectively (Table 1). Using flow cytometry, antimicrobial susceptibility ranges for enrofloxacin, spectinomycin, ceftiofur, erythromycin, tetracycline, oxytetracycline, and florfenicol were 0.1–0.4 µg/ml, 4 to >256 µg/ml, >125 µg/ml, >3.2 µg/ml, <0.025 to >6.4 µg/ml, 0.05 to >12.8 µg/ml, and <2 to 4 µg/ml, respectively (Table 2). Using CLSI-approved breakpoints for other bovine respiratory disease pathogens, it was determined that enrofloxacin, spectinomycin, ceftiofur, erythromycin, tetracycline, oxytetracycline, and florfenicol demonstrated resistance in 2.1%, 58.3%, 100%, 100%, 12.5%, 22.4%, and 11.4% of isolates tested by broth microdilution, respectively.
Minimum inhibitory concentration values (24 hr) of Mycoplasma bovis isolates (n = 192) using a broth microdilution assay with 5% resazurin reagent.*
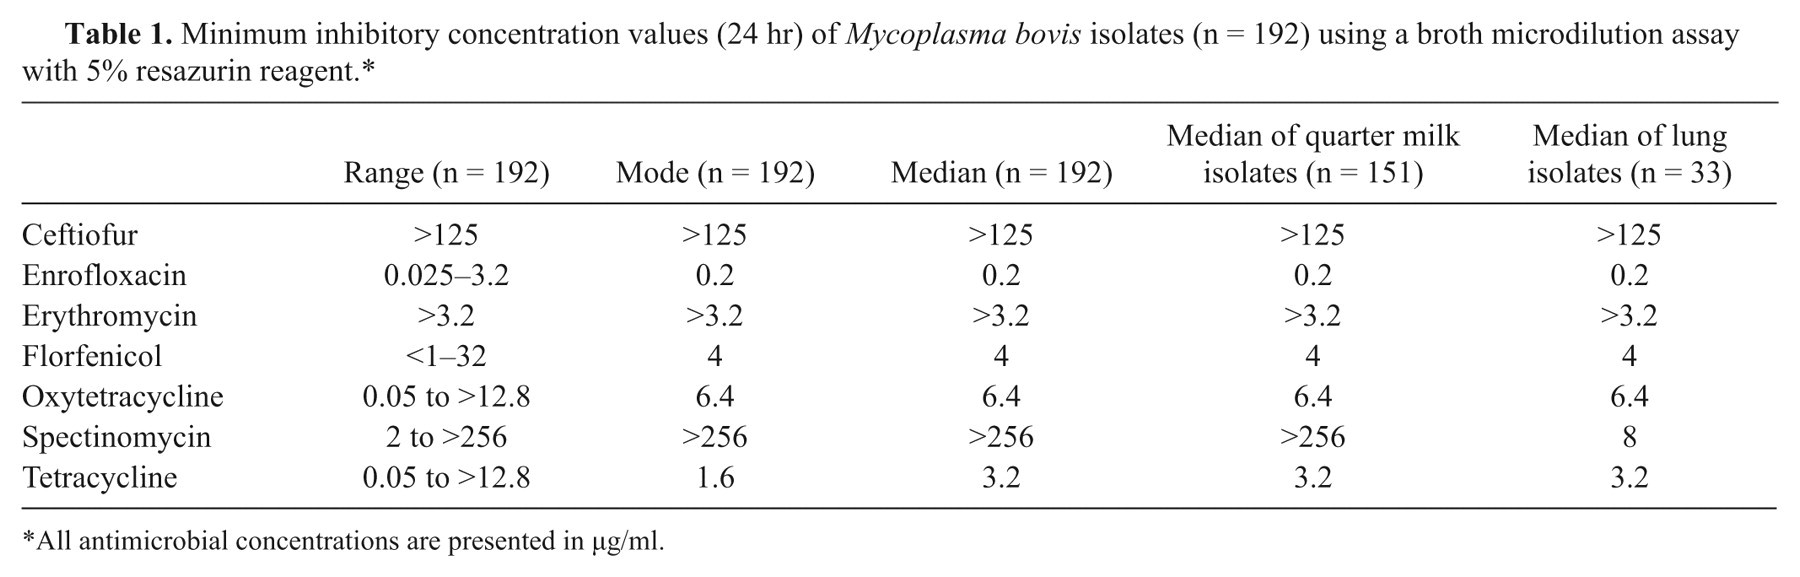
All antimicrobial concentrations are presented in µg/ml.
Minimum inhibitory concentration values (24 hr) for quarter milk (n = 6) and lung (n = 6) Mycoplasma bovis isolates from Pennsylvania as determined by flow cytometry stained with SYBR Green I and propidium iodide.*
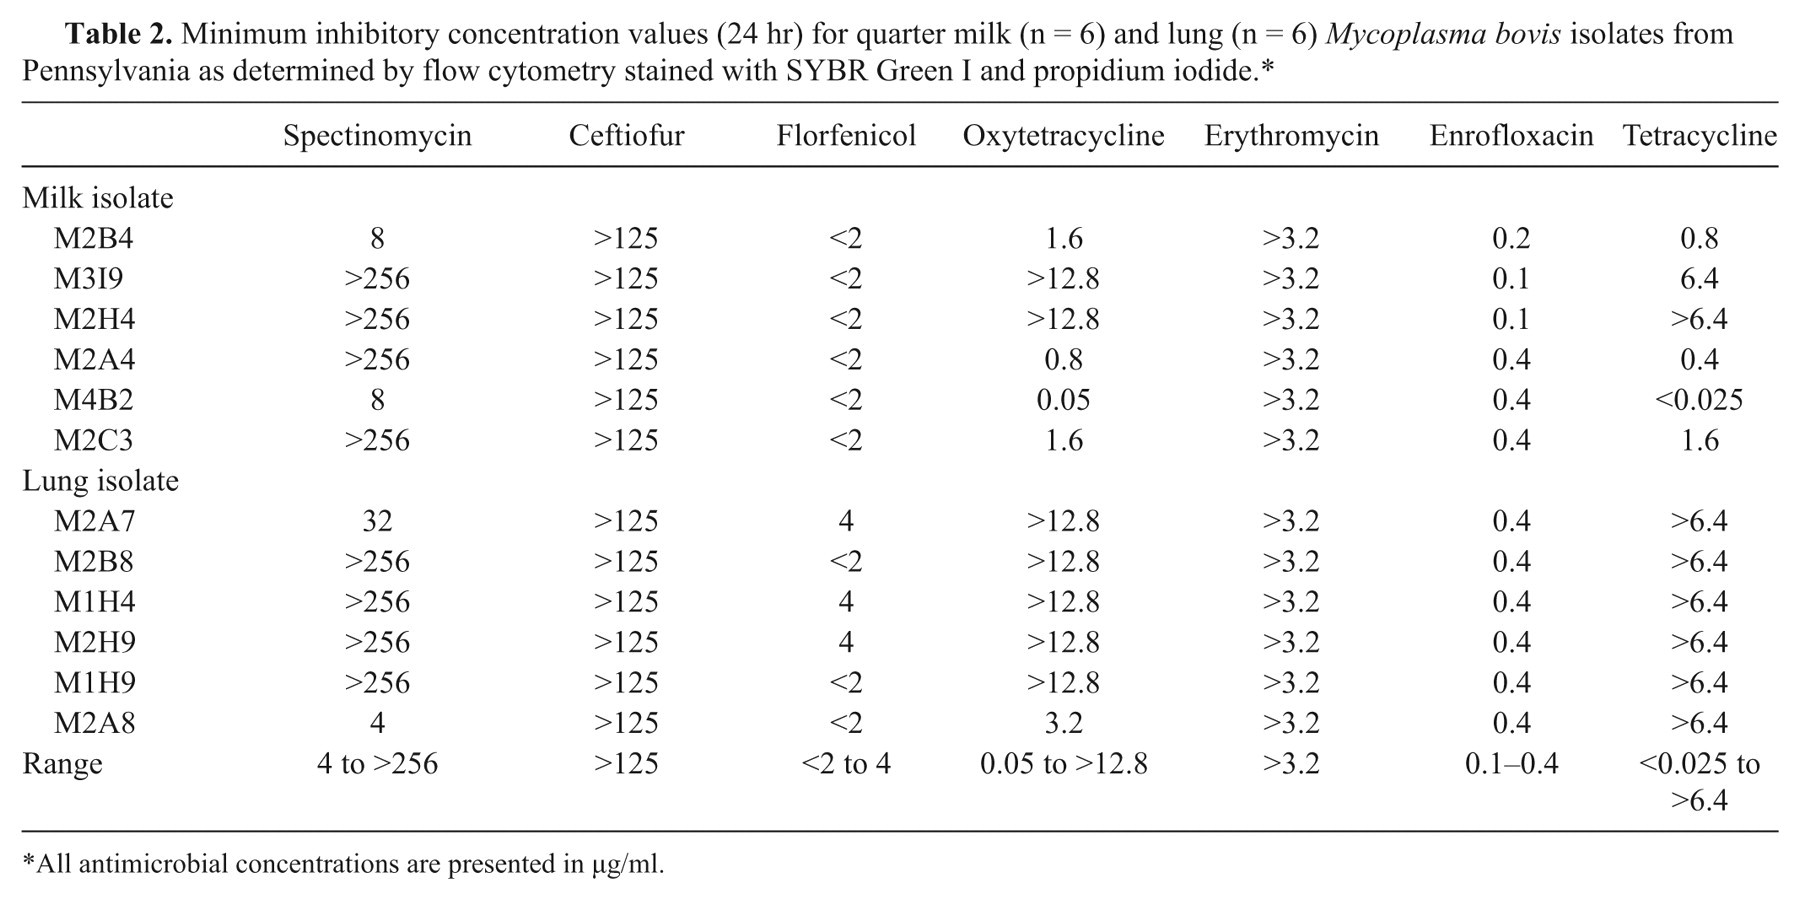
All antimicrobial concentrations are presented in µg/ml.
On the flow cytometer, enrofloxacin, spectinomycin, florfenicol, tetracycline, and oxytetracycline began to show low-level changes in living and dead or injured cell population proportions between the 6-hr and 12-hr time points. At 24 hr, M2B4, M2H4, M2A4, M2C3, M2B8, and M1H4 were shown to have MIC90 values equivalent to the broth microdilution test. The 24-hr flow cytometry results of M3I9, M4B2, M1H9, M2A8, M2A7, and M2H9 matched the MIC values of the broth microdilution method at 48 hr.
The current lack of CLSI-approved MIC breakpoints or standardized methods for testing of Mycoplasma species of veterinary importance leads to difficulty with interpreting the impact of antimicrobial activity in vitro. The use of CLSI-approved interpretative criteria for other bovine pathogens is frequently used to understand the implication of in vitro Mycoplasma sensitivity testing. 5–7,9,15 It has been suggested that if the actual MIC values are significantly higher than those established by CLSI for other important pathogens of veterinary medicine, it is unlikely that the antimicrobial will be capable of being efficacious. 5–7,9,10,15 This indicates that M. bovis may be categorized as susceptible to an antimicrobial if it falls in the susceptible category of the CLSI-approved criteria for the other veterinary pathogens. Therefore, enrofloxacin, florfenicol, spectinomycin, tetracycline, oxytetracycline, ceftiofur, and erythromycin meet the criteria for the susceptible category for respiratory pathogens at less than or equal to 0.25 µg/ml, 2 µg/ml, 32 µg/ml, 4 µg/ml, 4 µg/ml, 0.5 µg/ml, and 2 µg/ml, respectively. 11,12 Similar to previous work, ceftiofur and erythromycin were unable to show an effect upon M. bovis. 13,16
Based upon the CLSI-approved criteria for other veterinary pathogens, the percentage of samples indicating resistance to the selected antimicrobial suggest that enrofloxacin, florfenicol, and tetracycline are the most effective antimicrobials in vitro. Although the in vitro susceptibility testing is not intended to be a definitive statement on the impact that an antimicrobial may have in vivo, it may provide guidance for a veterinarian seeking an appropriate antimicrobial selection. It is also important to note that there was no treatment data available for the samples in the present study. It is unknown whether acute, chronic, treated, and untreated samples may have significantly different antimicrobial sensitivity profiles. For this reason, the higher of the 2 repeated broth microdilution runs was selected for the current study.
It has been reported that antimicrobial susceptibility profiles are influenced by geographical differences leading to a need for regional testing of isolates. 7 Varying levels of susceptibility and increased resistance to spectinomycin by M. bovis has been previously observed. 5–7,15 The results of the current study also suggest this phenomenon, as 58% of the isolates had MICs at or above 128 µg/ml, which is considered resistant using the CLSI standards for other veterinary pathogens. Tetracycline and oxytetracycline have a wide distribution of antimicrobial activity with many of the duplicate samples being ±2 dilutions from the first run. This suggests a wider range of antimicrobial MIC values for these antimicrobials, which may lead to difficulty in accurately interpreting the in vitro susceptibility testing results.
During the development of the flow cytometry assay, it was determined that SYTO stain did not result in a fluorescent output high enough for clear identification of M. bovis populations. The strength of the SYBR fluorescence leads to mild levels of bleed-through into the same range as propidium iodide, and it is necessary to adjust the distribution on the flow cytometer. Dying cells may release nucleic acids that can bind SYBR leading to overlap. The findings of the present study suggest that flow cytometry may be employed successfully in the real-time collection of MIC values for M. bovis field isolates. Comparable MIC levels for each antimicrobial were noted for the broth microdilution and flow cytometry methods. Results suggest that the most appropriate time point for collecting data with flow cytometry is between 12 and 24 hr. This indicates that flow cytometry may be capable of producing results in less time than the broth microdilution method
In conclusion, both methods demonstrated that florfenicol, enrofloxacin, and tetracycline are most efficacious in inhibiting M. bovis isolates of bovine origin from Pennsylvania in this study. In vitro susceptibility breakpoints do not necessarily correspond to in vivo results, but they provide a method of determining the agents that are most likely to be effective treatment options. The wide range of sensitivity to tetracycline, spectinomycin, and oxytetracycline suggest that in order to optimize use in vivo it may be necessary to run susceptibility testing prior to application. The use of flow cytometry offers better turnaround time, high-throughput testing capabilities, interlaboratory comparisons capability, and the objective collection of results for sensitivity data. There is potential for real-time diagnostic data to be available within 24 hr. This indicates that flow cytometry offers the potential to become a valuable tool for diagnostic laboratories across the country.
Footnotes
Acknowledgements
All flow cytometry was performed at the Cytometry Facility at the Huck Institutes of Life Sciences, Penn State University. All M. bovis samples were collected at the Pennsylvania Animal Diagnostics Laboratory, University Park, PA. The authors would like to thank Traci Pierre and Valerie Lintner (Pennsylvania Animal Diagnostics Laboratory), Susan Magargee and Nicole Zembower (Penn State University Flow Cytometry Facility), and Ginger Fenton, Beth Houser, and Hannah Lysczek (Department of Veterinary and Biomedical Sciences) for their technical assistance in this work.
a.
University of California Davis Biological Media Services, Davis, CA.
b.
Alamar Blue, AbD Serotec, Raleigh, NC.
c.
MP Biomedicals Inc., Solon, OH.
d.
SmithKline Beecham Corp., Philadelphia, PA.
e.
Sigma-Aldrich, St. Louis, MO
f.
GraphPad Software Inc., La Jolla, CA.
g.
VWR, West Chester, PA
h.
Fluoresbrite™ Polychromatic Red Microspheres, PolySciences Inc., Warrington, PA.
i.
SYTO®, Molecular Probes Inc, Eugene, OR.
j.
XL-MCL, Beckman Coulter Inc., Fullerton, CA.
k.
Joseph Trotter, Scripps Research Institute, La Jolla, CA.
l.
De Novo, Los Angeles, CA.
The authors declared that they had no conflicts of interest with respect to their authorship or the publication of this article.
This research was funded by the Pennsylvania Department of Agriculture Bureau of Animal Health and Diagnostic Services Grant ME-447632 (PI: Wolfgang).