
Abstract
CTAD (citrate–theophylline–adenosine–dipyridamole) has been shown to be an almost universal anticoagulant in human and feline medicine, allowing most hematology, coagulation, and biochemical analyses. Forty canine blood specimens were collected in CTAD, EDTA, heparin, and citrate for hematology, biochemistry, and coagulation analyses. CTAD partially limited platelet aggregation observed in EDTA blood smears. CTAD specimens gave similar and well-correlated results for most variables of a complete blood cell count, except for mean corpuscular volume, which was moderately higher, and mean corpuscular hemoglobin concentration, which was moderately lower in CTAD than in EDTA; reticulocyte and platelet indexes were poorly correlated. CTAD plasma gave similar results to citrate for fibrinogen, antithrombin, and D-dimers, and relatively similar results for prothrombin time, but activated partial thromboplastin time was poorly correlated. Triglycerides, cholesterol, glucose, total proteins, phosphate, iron, alanine aminotransferase, γ-glutamyl transferase, and lipase were similar and well correlated in CTAD and heparin plasmas. Urea, creatinine, albumin, alkaline phosphatase, amylase, and aspartate aminotransferase showed moderate-to-marked bias, but these variables could be measured in CTAD plasma if new reference intervals were determined. Creatine kinase activity, potassium, chloride, and total carbon dioxide measurements are not recommended in CTAD plasma. CTAD is a prospective candidate as an almost universal anticoagulant for routine hematology, some plasma coagulation, and many biochemistry variables in dogs. Definitive recommendations will require study of abnormal canine blood specimens.
Medical diagnosis frequently requires multiple routine laboratory analyses including hematology, biochemistry, and coagulation. This currently necessitates the collection of 3 different blood tubes, usually EDTA, citrate, and heparin tubes, or EDTA, citrate, and serum tubes. Most biochemistry analyses can be performed on serum or heparinized plasma.16,18 The sampling procedure may be long, necessitate firm handling of the animal, and thus induce stress. It also requires the collection of a relatively large volume of blood, even when small tubes are used. This blood wastage is well tolerated in healthy adult dogs but may cause a health risk in diseased animals, especially smaller ones, or in puppies.
A preliminary study in humans 19 showed that CTAD (citrate–theophylline–adenosine–dipyridamole) specimens gave similar results to EDTA specimens for the complete blood cell count (CBC), close to citrate specimens for secondary hemostasis variables (i.e., prothrombin time [PT], activated partial thromboplastin time [APTT], and fibrinogen), and close to plasma specimens for many biochemistry variables (i.e., total proteins, albumin, total bilirubin, urea, creatinine, aspartate aminotransferase [AST], alanine aminotransferase [ALT], creatine kinase [CK], glucose, and potassium), whereas the values for Na and Cl differed notably; both showed unacceptable biases because of the presence of sodium in CTAD and because testing for divalent cations was prevented by the formation of citrate salts. Moreover, CTAD has been shown to be a good substitute for EDTA in feline hematology as it limits platelet clumping and thus provides a more accurate platelet count. It also gives similar results for other CBC measurements, and allows more prolonged storage.7,9,15 Although platelet clumping is often observed in cats, it is not rare in dogs and may lead to an erroneous platelet count.1,15 In cats, CTAD can also be used for coagulation and for many biochemistry measurements (except sodium, divalent ions, potassium, and AST activity) as a substitute for citrate and heparin, respectively. 10
To our knowledge, the use of a single anticoagulant has not been reported for canine specimens. A comparative study of the effects of anticoagulants on 25 biochemical analyses showed that the results in serum and heparin plasma were very similar; a few differences were observed in EDTA and even more in citrate or fluoride specimens. 3 In another study, it was shown that EDTA blood could be used for coagulation testing within 1 h of sampling. 2 We compared results of a large panel of hematology, biochemistry, and coagulation analyses in specimens collected in CTAD, tri-potassium (K3)-EDTA, lithium (Li)–heparin, or tri-sodium (Na)–citrate.
Our prospective study was performed at the Veterinary School of Toulouse (France) between March and July 2014. Forty dogs admitted to the primary care service were included after the owners had signed a consent form. Four blood tubes were collected from the jugular vein of each dog, in a random order, using a 0.8 × 40 mm needle (21 ga; Venosafe Multisample, Terumo Europe, Leuven, Belgium) and CTAD (Vacuette 2 mL, Greiner Bio-One, Kremsmünster, Austria), Na-citrate (Venosafe 1.8 mL 9NC, Terumo Europe), Li–heparin (Venosafe 4 mL LH, Terumo Europe), and K3–EDTA (Venosafe 3 mL K3E, Terumo Europe) vacuum tubes. The tubes were gently mixed by 10 inversions immediately after collection. All tubes that were incorrectly filled or showed macroscopic clots were excluded.
A CBC was immediately performed with a Sysmex XT-2000iV hematology analyzer (Sysmex, Kobe, Japan). The daily quality control used the manufacturer’s control solution (e-CHECK L2 level, Sysmex). The EDTA and CTAD tubes were analyzed in the same batch for each animal in a random order, 15–50 min after sampling. Analyses included impedance red blood cell count (RBC-I), hemoglobin (HGB), hematocrit (HCT), mean corpuscular volume (MCV), mean corpuscular hemoglobin (MCH), mean corpuscular hemoglobin concentration (MCHC), reticulocyte percentage (RET), immature reticulocyte fraction (IRF), low, medium, and high fluorescence ratio (LFR, MFR, and HFR, respectively) as grades of reticulocyte maturation, red blood cell size distribution width (RDW-SD and RDW-CV), optical platelet count (PLT-O), platelet distribution width (PDW), mean platelet volume (MPV), platelet–large cell ratio (P-LCR), plateletcrit (PCT), and white blood cell (WBC), neutrophil, lymphocyte, monocyte, and eosinophil counts. Basophils were not reported because results in canine samples have been shown to be unreliable. 13 For each K3–EDTA and CTAD tube, a blood smear was prepared and stained with May-Grünwald/Giemsa in an automatic stainer (Aerospray Hematology Pro Series 2, ELITechGroup, Logan, UT). At the end of the study, blood smears obtained with EDTA and CTAD tubes were blinded and analyzed by the same observer to assess the degree of platelet aggregation. The grading system was based on a recently published study. 17 Briefly, a grade of platelet aggregate number and size was determined for the entire feathered edge (0 to 4+), which allowed a more meaningful assessment of the state of platelet aggregation than did the monolayer area. 17
The CTAD, citrate, and Li–heparin tubes were centrifuged for 5 min at 2,900 × g (Rotofix 32A, Hettich, Tuttlingen, Germany). Plasmas were separated and held at room temperature for up to 15 min until analyzed.
Coagulation variables were measured with a STA-Compact automated analyzer (Diagnostica Stago, Asnieres-sur-Seine, France) in CTAD and citrate plasmas, by coagulometric and colorimetric methods, after daily quality control using 2 control solutions (STA-Coag Control N+P, Diagnostica Stago). Measurements included PT, APTT, fibrinogen, D-dimers, and antithrombin (AT). The citrate and CTAD samples were analyzed in the same analytical batch and in a random order, 30–90 min after sampling.
The concentrations and activities of the following biochemical analytes were measured in CTAD and Li–heparin plasmas with a dry-slide technology analyzer (Vitros 350, Ortho-Clinical Diagnostics, Rochester, NY) and corresponding multilayer reagents: glucose, urea, creatinine, total proteins, albumin, cholesterol, triglycerides, bilirubin, potassium, chloride, total CO2, phosphate, iron, AST, ALT, alkaline phosphatase (ALP), γ-glutamyl transferase (GGT), α-amylase, lipase, and CK. The choice of biochemical analytes tested was based also on the a priori exclusion of variables such as sodium present in the CTAD solution, and divalent cations (such as Ca2+ and Mg2+) that make stable salts with citric acid and cannot be reliably measured in citrated plasmas. Quality control was performed daily with the manufacturer’s control solutions (Vitros Performance Verifier I & II, Ortho-Clinical Diagnostics). The Li–heparin and CTAD tubes were analyzed in the same batch in a random order, 60–120 min after sampling.
Coagulation results obtained in CTAD and citrate were compared without correction for dilution, as it is the same in the 2 types of tubes. All other counts, concentrations, and activities obtained in CTAD specimens were corrected to compensate for the dilution in CTAD tubes (1:9 volume of anticoagulant to blood; i.e., results were multiplied by a factor of 1.11). Comparison of paired CTAD and other anticoagulant results was based on Wilcoxon test, Spearman correlation, and Passing–Bablok agreement analysis, as recommended for the comparison of methods. 12 The numbers of cases where the differences could lead to a different “clinical” classification or misclassification of the results, according to canine reference intervals (RIs; i.e., within or outside the RIs), 1 were also evaluated. Calculations were done using commercial software (Excel, Microsoft Corp., Redmond, WA; Analyse-it Software, Leeds, UK).
Of the 40 canine blood specimens analyzed, no results were available for some variables for technical reasons. In most cases, at least 35 paired results were available (Tables 1–3). In the case of GGT and bilirubin, many results were below the lower limit of the analytical range and were not included in the comparison (which is based on the values of the lower limits; i.e., 5 U/L and 1.7 µmol/L, respectively). Calculations of total bilirubin and GGT activity could only be done for 27 and 29 paired specimens, respectively. When unexpectedly large differences were observed between the paired results, and could be considered as outliers, they were nevertheless included. RBC-I count, HGB, MCH, IRF, LFR, MFR, HFR, and eosinophil count in EDTA and CTAD were not significantly different, whereas all the other tested analytes were significantly different (i.e., HCT, MCV, MCHC, RDW-SD, RDW-CV, reticulocyte percentage, and WBC, neutrophil, lymphocyte, monocyte and PLT counts, PDW, MPV, P-LCR, and PCT). Spearman correlation coefficients between EDTA and CTAD specimens were ≥0.95 for 12 of 23 measured variables (i.e., RBC-I count, HGB, HCT, MCV, MCH, RDW-SD, reticulocyte percentage, and WBC, neutrophil, lymphocyte, eosinophil, and PLT counts), between 0.90 and 0.83 for MCHC, RDW-CV, IRF, LFR, MFR, and monocyte count, PDW, MPV, P-LCR, and PCT, and 0.70 for HFR. No statistical bias was observed for RBC-I count, HGB, HCT, MCH, MCHC, RDW-SD, RDW-CV, reticulocyte count and indexes, WBC, lymphocyte, neutrophil, eosinophil, and PLT-O counts, PDW, MPV, P-LCR, and PCT (Supplementary Fig. 1). A mild negative proportional bias was observed for PCT (slope of 0.83). A moderate positive constant bias was demonstrated for MCV (intercept of 2.1 fL), and a negative constant bias was shown for monocyte count (intercept of 0.93 × 10⁹/L). No clinical misclassification of the results according to the reference limits was noted for HGB, MCHC, reticulocyte count, IRF, LFR, and WBC, neutrophil and lymphocyte counts, and ≤10% clinical misclassifications were noted for the other analytes (viz. RBC-I count, HCT, MCV, MCH, RDW-SD, MFR, HFR, monocyte, eosinophil, and PLT-O counts, and platelet indexes). CTAD can thus provide a good substitute for RBC-I count, HGB, HCT, MCH, RDW-SD, RET, WBC, neutrophil, lymphocyte, eosinophil, and PLT-O. In our opinion, RIs can be directly transferred based on subjective validation. Nevertheless, dilution must be taken into account and the results must be corrected by a 10:9 factor. These results are relatively similar to those reported in feline blood specimens. 10 For MCV, MCHC, RDW-CV, and monocyte count, CTAD can also be used as an alternative anticoagulant, but the corresponding RIs will have to be determined according to the recommendations of the American Society for Veterinary Clinical Pathology (ASVCP).4,5 CTAD could probably be used as an alternative anticoagulant for reticulocyte indexes (IRF, LFR, and MFR) and PLT variables (PDW, MPV, P-LCR, and PCT) but further study with more abnormal results is required, and the corresponding specific RIs will need to be determined by a de novo method.4 –6 In feline specimens, similar results between EDTA and CTAD were reported for reticulocyte indexes. 10
Comparison of hematologic variable results obtained for canine plasma specimens sampled in EDTA and CTAD tubes.*
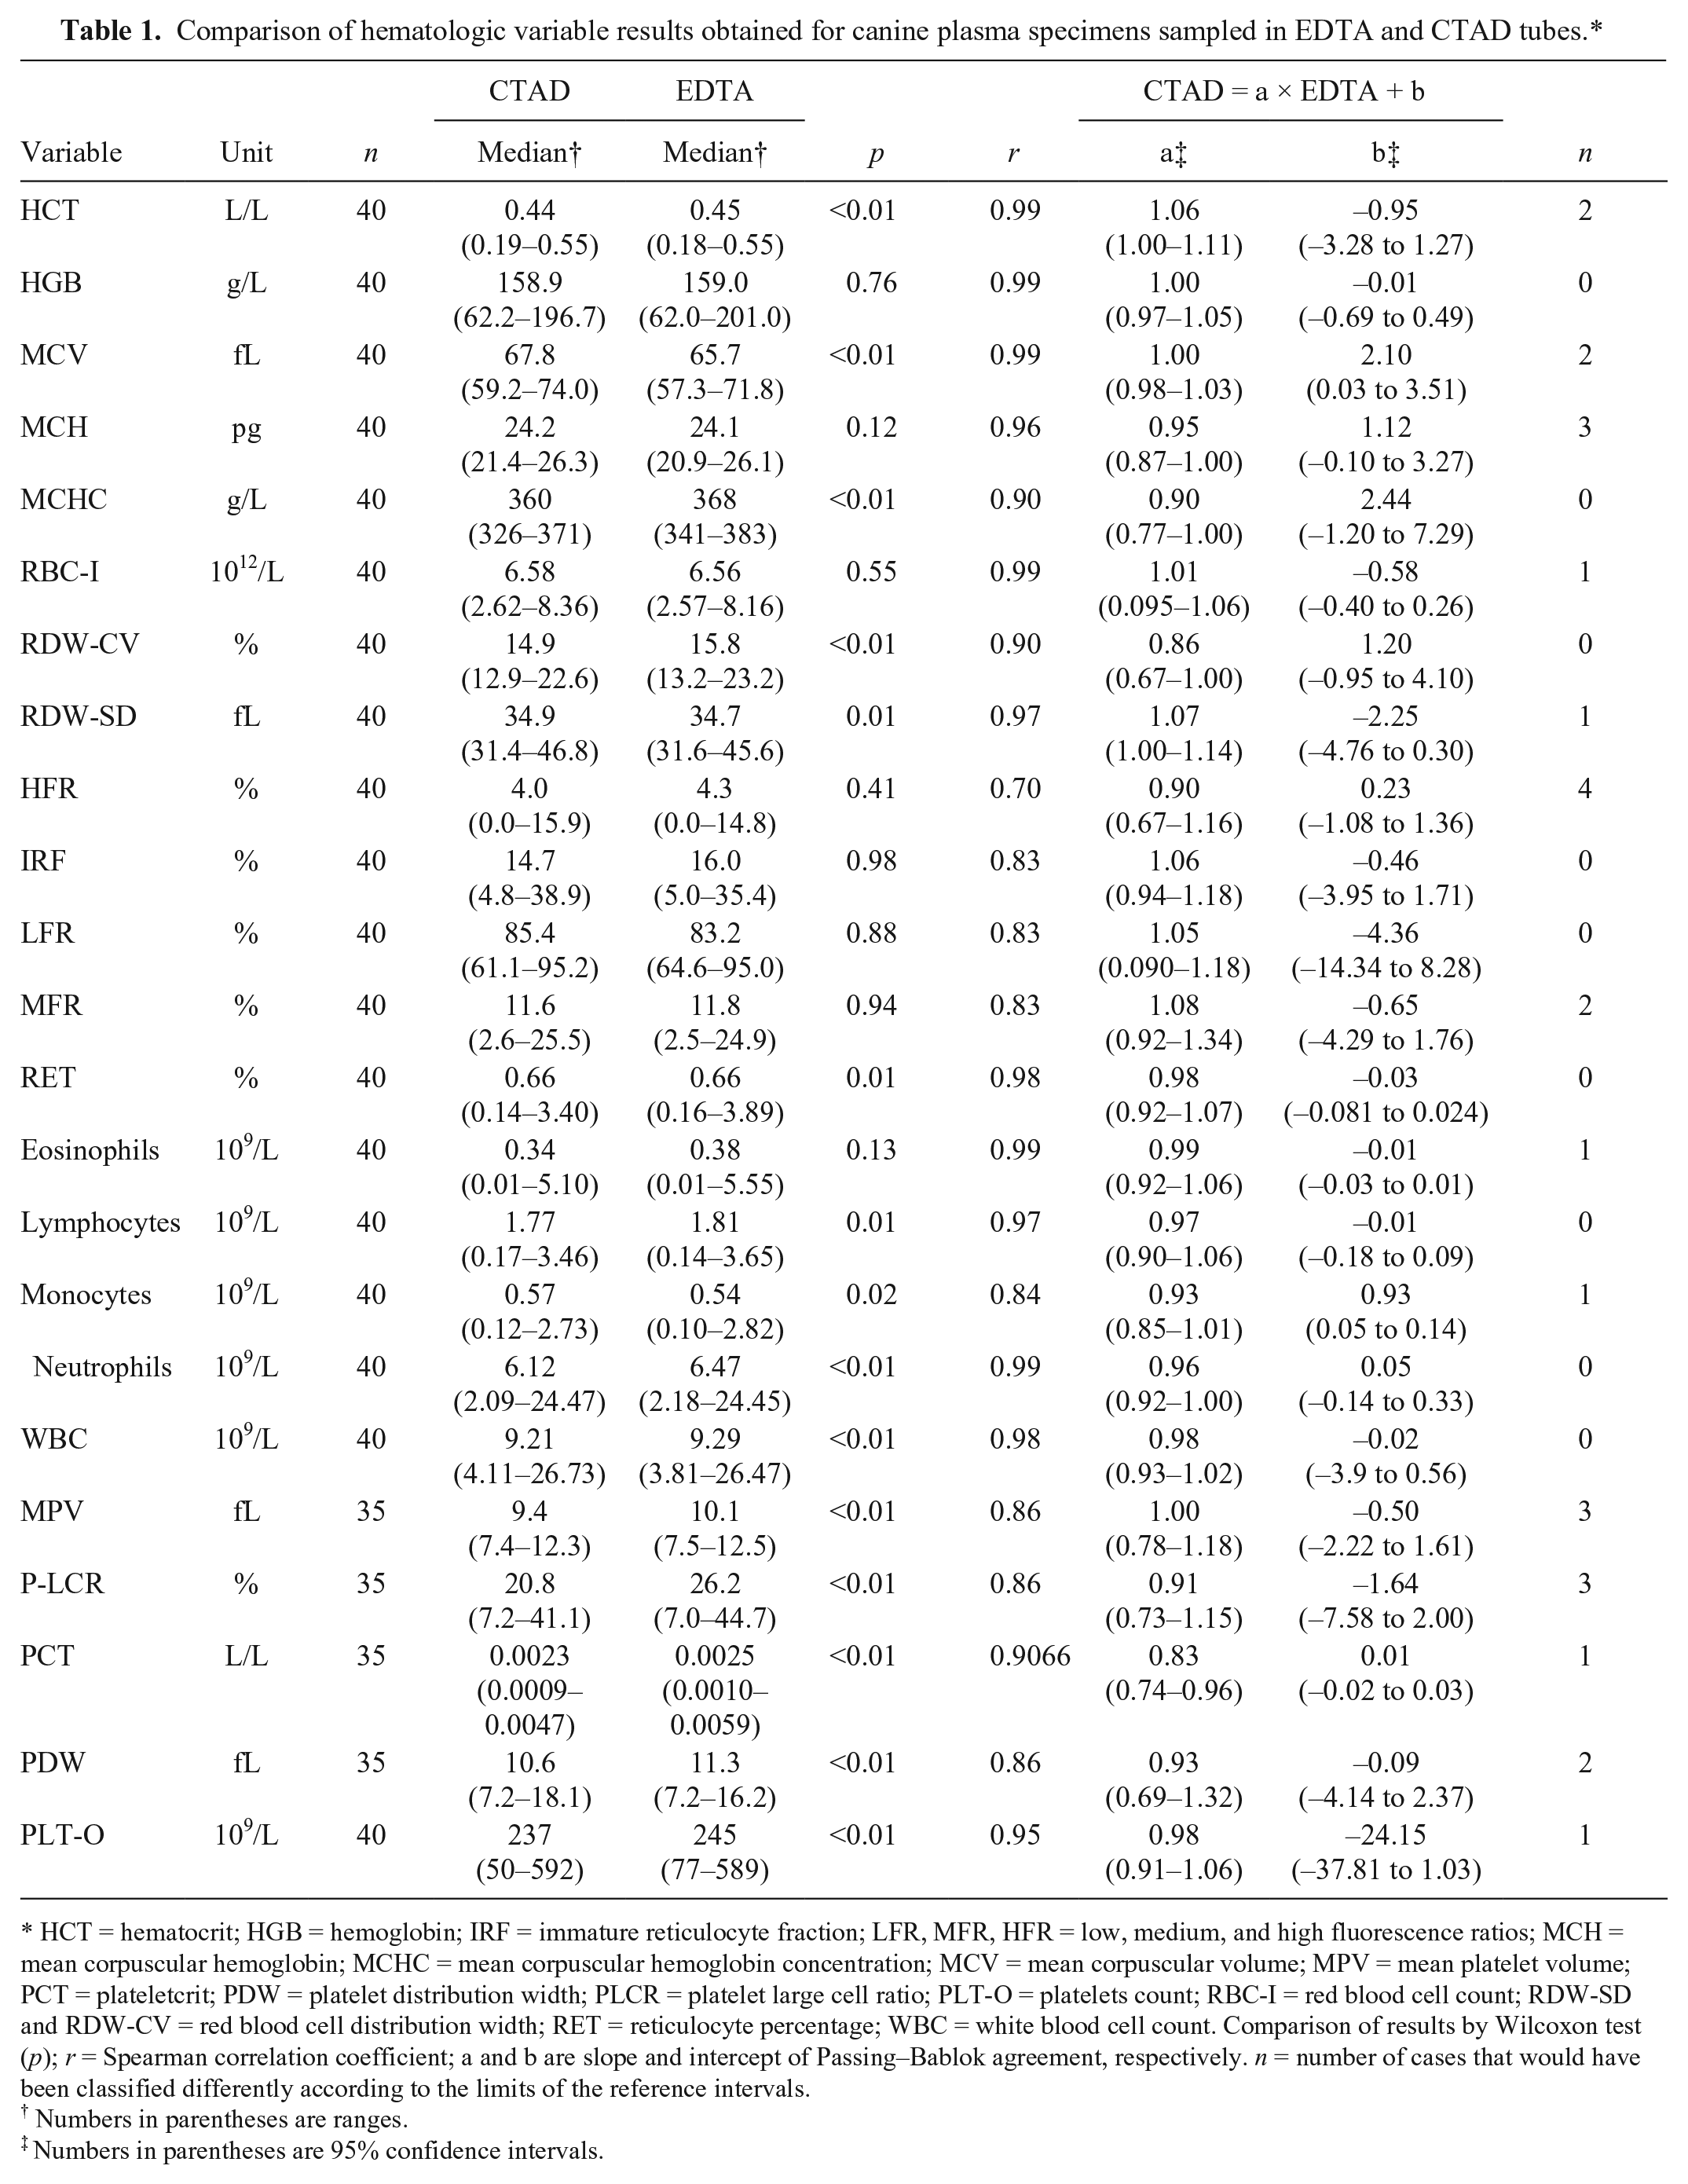
HCT = hematocrit; HGB = hemoglobin; IRF = immature reticulocyte fraction; LFR, MFR, HFR = low, medium, and high fluorescence ratios; MCH = mean corpuscular hemoglobin; MCHC = mean corpuscular hemoglobin concentration; MCV = mean corpuscular volume; MPV = mean platelet volume; PCT = plateletcrit; PDW = platelet distribution width; PLCR = platelet large cell ratio; PLT-O = platelets count; RBC-I = red blood cell count; RDW-SD and RDW-CV = red blood cell distribution width; RET = reticulocyte percentage; WBC = white blood cell count. Comparison of results by Wilcoxon test (p); r = Spearman correlation coefficient; a and b are slope and intercept of Passing–Bablok agreement, respectively. n = number of cases that would have been classified differently according to the limits of the reference intervals.
Numbers in parentheses are ranges.
Numbers in parentheses are 95% confidence intervals.
Comparison of coagulation variable results obtained for canine plasma specimens sampled in citrate and CTAD tubes.*
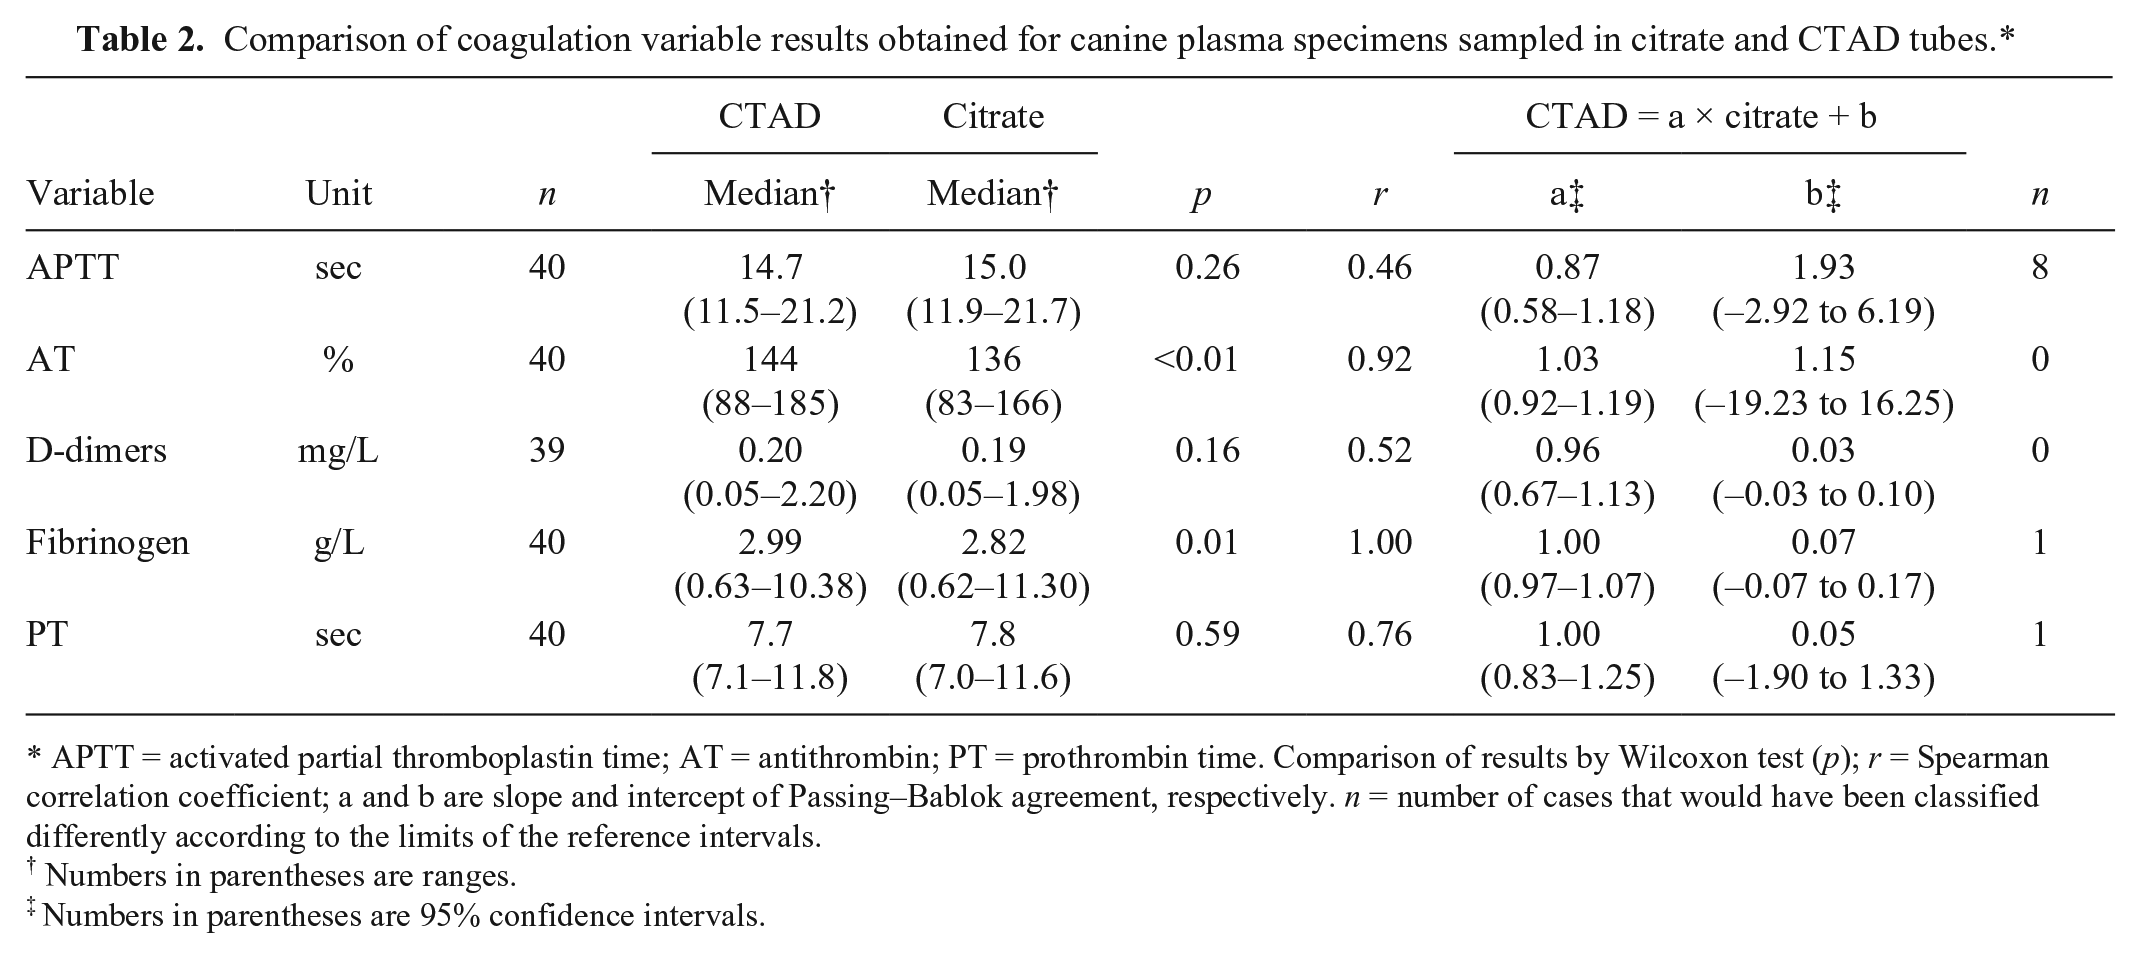
APTT = activated partial thromboplastin time; AT = antithrombin; PT = prothrombin time. Comparison of results by Wilcoxon test (p); r = Spearman correlation coefficient; a and b are slope and intercept of Passing–Bablok agreement, respectively. n = number of cases that would have been classified differently according to the limits of the reference intervals.
Numbers in parentheses are ranges.
Numbers in parentheses are 95% confidence intervals.
Comparison of results obtained for biochemical variable results in canine plasma specimens sampled in heparin and CTAD tubes.*
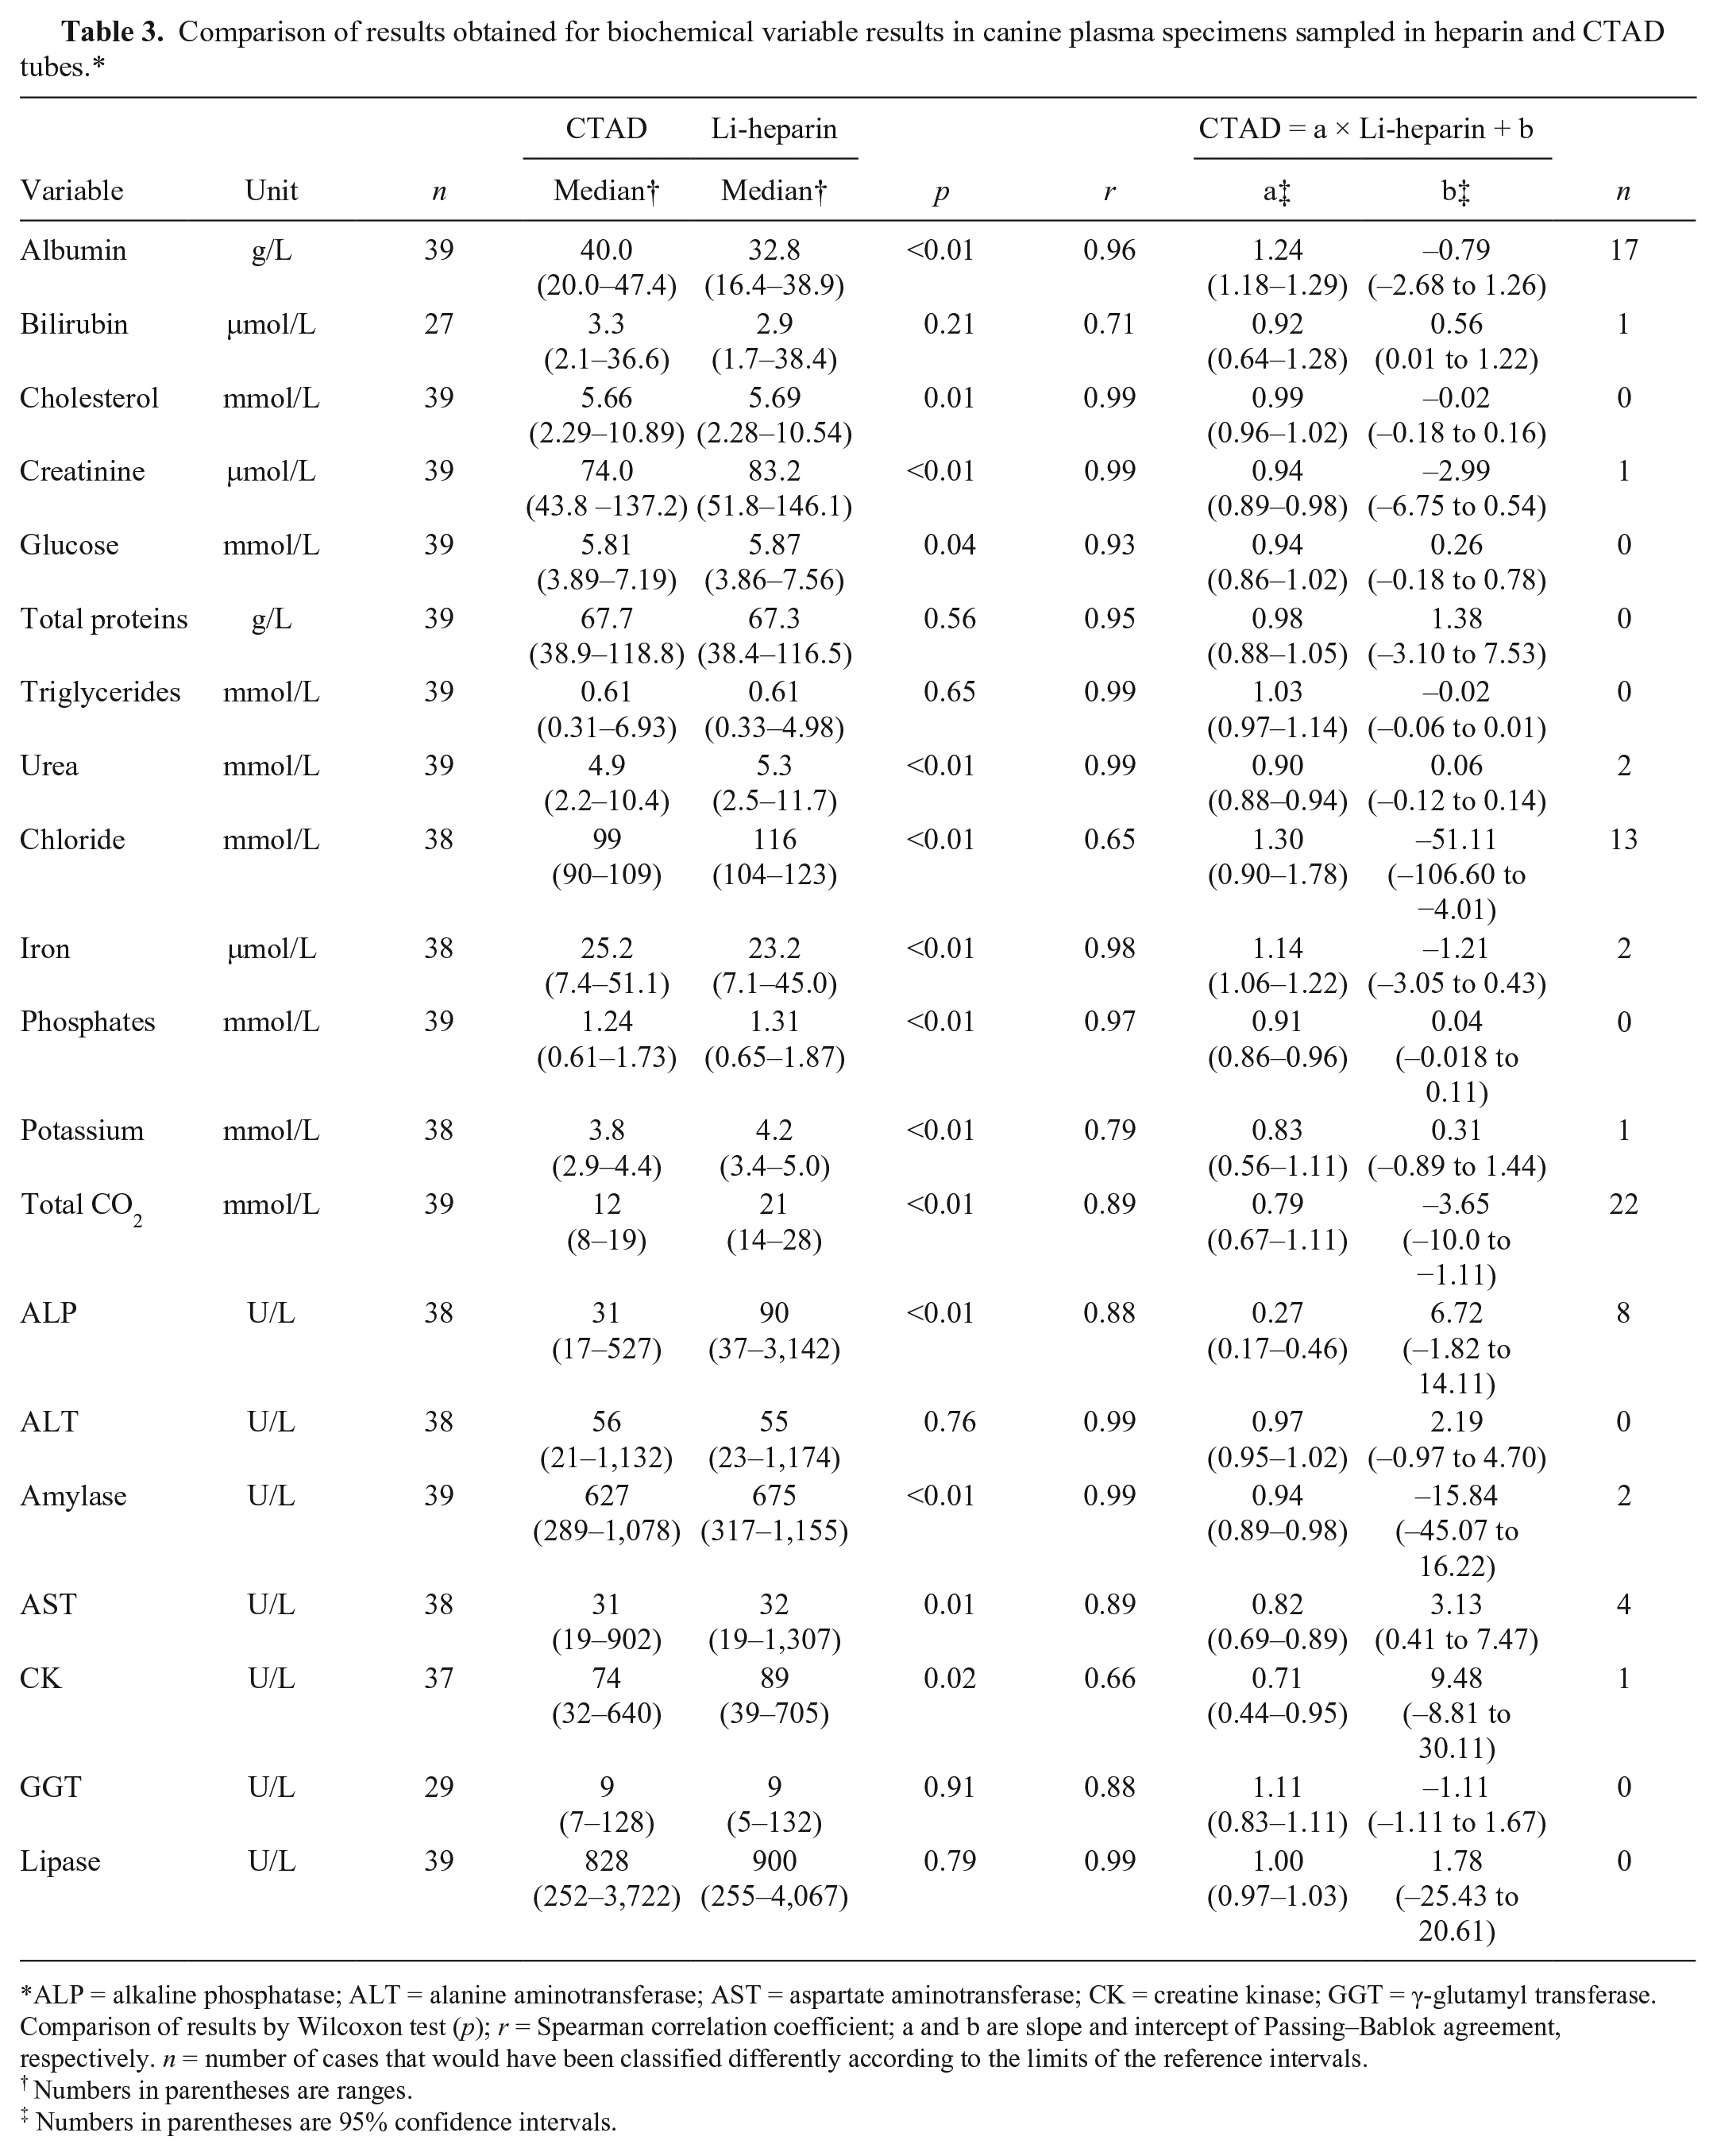
ALP = alkaline phosphatase; ALT = alanine aminotransferase; AST = aspartate aminotransferase; CK = creatine kinase; GGT = γ-glutamyl transferase. Comparison of results by Wilcoxon test (p); r = Spearman correlation coefficient; a and b are slope and intercept of Passing–Bablok agreement, respectively. n = number of cases that would have been classified differently according to the limits of the reference intervals.
Numbers in parentheses are ranges.
Numbers in parentheses are 95% confidence intervals.
The overall platelet aggregation score was higher in EDTA than in CTAD blood specimens (median equal to 1.5 and 0.5, respectively; p = 0.01): it was similar for 18 of 40 cases, higher in EDTA than in CTAD for 19 of 40 cases, and lower in EDTA than in CTAD for 3 of 40 cases. The platelet aggregation score was null in most CTAD blood specimens (24 of 40) and in 12 of 40 EDTA blood specimens. The highest score (i.e., 4) was obtained for 4 of 40 EDTA blood specimens, whereas the highest estimated platelet aggregation score in CTAD was 3 in 4 of 40 cases. Therefore, no significant improvement of platelet counting could be highlighted in our study, and the platelet count was even slightly higher in EDTA than in CTAD specimens (p < 0.01). The potential inhibitory effect of CTAD on platelet aggregation will need to be confirmed from a quantitative assessment by aggregometry to determine the relevance of CTAD for routine canine hematology analyses. Furthermore, the addition of EDTA to CTAD should also be evaluated as it has been shown to improve the resting state of platelets in humans. 14 No statistical difference was obtained for PT, APTT, and D-dimers in citrate and CTAD plasmas, whereas fibrinogen and AT were significantly higher in CTAD than in citrate plasmas. The coefficients of correlation between citrate and CTAD samples were ≥0.92 for fibrinogen and AT, and 0.76 for PT, 0.52 for D-dimers, and 0.46 for APTT. No bias was shown for the different hemostatic variables (Supplementary Fig. 2). No clinical misclassifications of results according to the reference limits was observed for AT, whereas one clinical misclassification for PT and fibrinogen, and 20% clinical misclassifications for APTT were reported. CTAD can provide a good substitute for AT and fibrinogen, but it cannot be recommended for measuring APTT in canine blood samples, contrary to feline specimens. 10 No explanation has been found for these species differences. However, a further study could be done with higher values of APTT in canine specimens to confirm these results, given that there were very few cases with abnormal values in our study. As already noticed for hematologic variables, further study with more abnormal results is required to observe if CTAD could be used as an alternative anticoagulant for PT and D-dimers. In feline specimens, similar results between EDTA and CTAD were reported for PT. 10
Total protein, triglyceride, bilirubin, ALT, GGT, and lipase measurements were not significantly different in heparin and CTAD plasmas, whereas all of the other tested analytes were significantly different (i.e., glucose, urea, creatinine, albumin, cholesterol, potassium, total CO2, phosphate, iron, AST, ALP, amylase, CK). Spearman correlation coefficients were ≥0.95 for 11 of 20 measured analytes (i.e., urea, creatinine, total protein, albumin, cholesterol, triglycerides, phosphate, iron, ALT, amylase, lipase); between 0.88 and 0.93 for glucose, total CO2, AST, ALP, and GGT; and 0.71 for bilirubin, 0.66 for CK, and 0.65 for chloride. No bias was observed for glucose, total protein, cholesterol, triglycerides, ALT, GGT, and lipase (Supplementary Fig. 3).
A mild negative proportional bias was observed for phosphate (slope of 0.91), a moderate negative proportional bias was observed for urea, creatinine, amylase, and CK (slopes of 0.90, 0.94, 0.94, and 0.71 respectively), a marked negative proportional bias for ALP (slope of 0.27), and a mild and moderate positive proportional bias was shown for iron and albumin, respectively (slopes of 1.14 and 1.24). The reason for the negative bias observed for ALP and amylase activities in CTAD versus heparin plasma may result from the formation of salts between citric acid and Mg2+ and Ca2+, which are respective cofactors of ALP and amylase. The same effect of CTAD on ALP activity was noted in the study of feline specimens; amylase activity was not examined in that study. 10 A further study with higher values of canine AST could be interesting to confirm the negative bias observed in our study. Relatively similar results for AST were obtained in the comparative study of CTAD and heparin plasmas in cats, although the correlation between CTAD and heparin results was lower than in canine specimens, and CTAD could not be recommended for AST activity measurement in feline specimens. The reason for the positive bias for albumin in CTAD versus heparin plasma already reported in feline specimens8,10 remains unknown. A moderate positive constant bias was demonstrated for bilirubin (intercept of 0.6 µmol/L), and a marked negative constant bias was shown for total CO2 (intercept of −4 mmol/L). The bias was negative and mixed for AST (slope of 0.82 and intercept of 3 U/L).
No clinical misclassification of the results, according to the reference limits, was noted for glucose, total protein, cholesterol, triglycerides, phosphates, ALT, GGT, and lipase, whereas ≤10% clinical misclassifications were noted for urea, creatinine, bilirubin, potassium, iron, AST, amylase, and CK, and ~20% clinical misclassifications for ALP, 30% clinical misclassifications for chloride, and almost 50% clinical misclassifications for total CO2 and albumin, respectively. CTAD cannot be recommended for measuring CK activity in canine specimens, whereas a good correlation has been observed in feline specimens. 10 The measurement of electrolytes such as chloride, total CO2, and potassium concentrations in CTAD canine plasma cannot be recommended either. For clinical use, these measurements must be accurate, and slight-to-mild changes may be critical (desirable total allowable errors of ~5% for potassium and chloride, and 15% for total CO2). 11 Chloride measurement was not recommended in human CTAD plasma 19 or potassium measurement in feline CTAD plasma (chloride not studied in this previous study). 10 The reason why these electrolytes cannot be measured in CTAD plasma remains unknown. One component of the CTAD solution may interfere with the analytical method. Citrate might be the component responsible for the difference in chloride measurement because a trend of marked negative bias was also reported in another comparative study of citrate and heparin plasma as in our study. 2 Thus, an adequate “traditional” specimen needs to be collected for measurements of these analytes.
CTAD can thus provide a good substitute for glucose, total proteins, cholesterol, and triglyceride concentrations, and ALT, GGT, and lipase activities with the same procedure for transference of RIs as for hematology variables. Concerning urea, creatinine, albumin, phosphates, and iron concentrations, and AST, ALP, and amylase activities, the recommended ASVCP transfer method must be used to establish RIs specific for CTAD use. The results obtained in cats for urea, creatinine, and phosphate were similar in heparin and CTAD plasmas, and the moderate and mild negative proportional bias reported in canine specimens was not observed. 10
Our study showed that CTAD could be used sparingly as an alternative anticoagulant in canine hematology, hemostasis, and biochemistry analyses with the well-known benefit on blood wasting and stress reduction. Nevertheless, this preliminary study needs to be completed with abnormal canine blood samples to confirm or invalidate the relevance of CTAD as a “universal” anticoagulant.
Footnotes
Declaration of conflicting interests
The authors declared no potential conflicts of interest with respect to research, authorship, and/or publication of this article.
Funding
The authors received no financial support for the research, authorship, and/or publication of this article.
References
Supplementary Material
Please find the following supplemental material available below.
For Open Access articles published under a Creative Commons License, all supplemental material carries the same license as the article it is associated with.
For non-Open Access articles published, all supplemental material carries a non-exclusive license, and permission requests for re-use of supplemental material or any part of supplemental material shall be sent directly to the copyright owner as specified in the copyright notice associated with the article.