
Abstract
We compared manual counting of reticulocytes in rabbits with automatic counting using an ADVIA 2120i analyzer. Reproducibility and the influence of different anticoagulants (EDTA and Li-heparin) were also examined. Blood samples of 331 rabbits (method comparison, n = 289; reproducibility, n = 33; comparison of anticoagulants, n = 9) were tested. The reticulocyte numbers of each specimen were manually determined twice for method comparison. Passing–Bablok regressions, Bland–Altman plots, and the coefficient of variation (CV) were used to evaluate statistical significance. Good correlation (rs = 0.81) was observed between manual reticulocyte counting (groups 1–4) and the ADVIA 2120i. Quantification with the ADVIA 2120i was reproducible for relative reticulocyte numbers (EDTA, CV = 4.24%; Li-heparin, CV = 3.63%) and absolute reticulocyte numbers (EDTA, CV = 5.64%; Li-heparin, CV = 3.81%). The absolute and relative reticulocyte numbers were significantly higher in Li-heparin samples than in EDTA samples (absolute, p = 0.009; relative, p = 0.016). The ADVIA 2120i is suitable for counting reticulocytes in rabbit blood samples, but reticulocyte numbers are higher by manual counting than by ADVIA 2120i counting. Therefore, microscopic confirmation of quantifications is recommended when high numbers of reticulocytes are observed. The anticoagulant of choice is EDTA.
Introduction
Reticulocyte quantification is important for the evaluation of erythrocyte regeneration. 10 Microscopic counts of stained reticulocytes became the standard quantification method in the 1940s. 22 Since then, automated hematology analyzers, which can quantify reticulocytes more accurately, faster, and at a reduced cost, have been developed. 22 These were initially developed to analyze human blood samples and have been adapted for veterinary use, 17 but have not been reported for use with rabbit blood, to our knowledge.
We compared manual counting of rabbit reticulocytes with quantification using the ADVIA 2120i analyzer (Siemens Healthcare, Erlangen, Germany). We determined the reproducibility of the results and the influence of different anticoagulants on the 2 methods.
Materials and methods
For our prospective study, 331 rabbit blood samples were collected from June 2013 to December 2014 (method comparison, n = 289; reproducibility, n = 33; comparison of anticoagulants, n = 9). The rabbits’ state of health was unknown for most samples. Specimens were sent from various veterinary practices in Germany to the laboratory (Synlab Veterinary Diagnostic Laboratory, Augsburg, Germany). Inclusion criteria were a blood sample volume of at least 0.5 mL, known sample age, and analysis within 36 h of venipuncture. The ADVIA 2120i has multispecies software (v.5.9.0 MS, Siemens Healthcare) that can analyze blood from 21 animal species. Measurements were performed using the pre-setting for rabbit blood and for absolute and relative reticulocytes.
For manual counting, reticulocytes were supravitally stained3,22; 50 µL of EDTA or lithium [Li]-heparin blood and 50 µL of brilliant cresyl blue (Merck, Germersheim, Germany) were pipetted into an Eppendorf cup, mixed, and then incubated at room temperature for 30 min, before the blood smear was made. One thousand erythrocytes were counted twice per smear using a microscope (1,000× magnification, immersion oil). 4 To guarantee the most accurate standard, mean values of the manual counted results were used in comparisons. All manual counting was performed and evaluated by the same person to avoid differences between the investigators. The counted reticulocytes were also classified into maturation stages (groups 1–4; Table 1, Fig. 1).7,9 Manual counting was the reference method for comparison to ADVIA 2120i counts. Reticulocyte maturation was assessed by classification into different stages (Fig. 1), and the stage was considered when comparing the 2 methods.
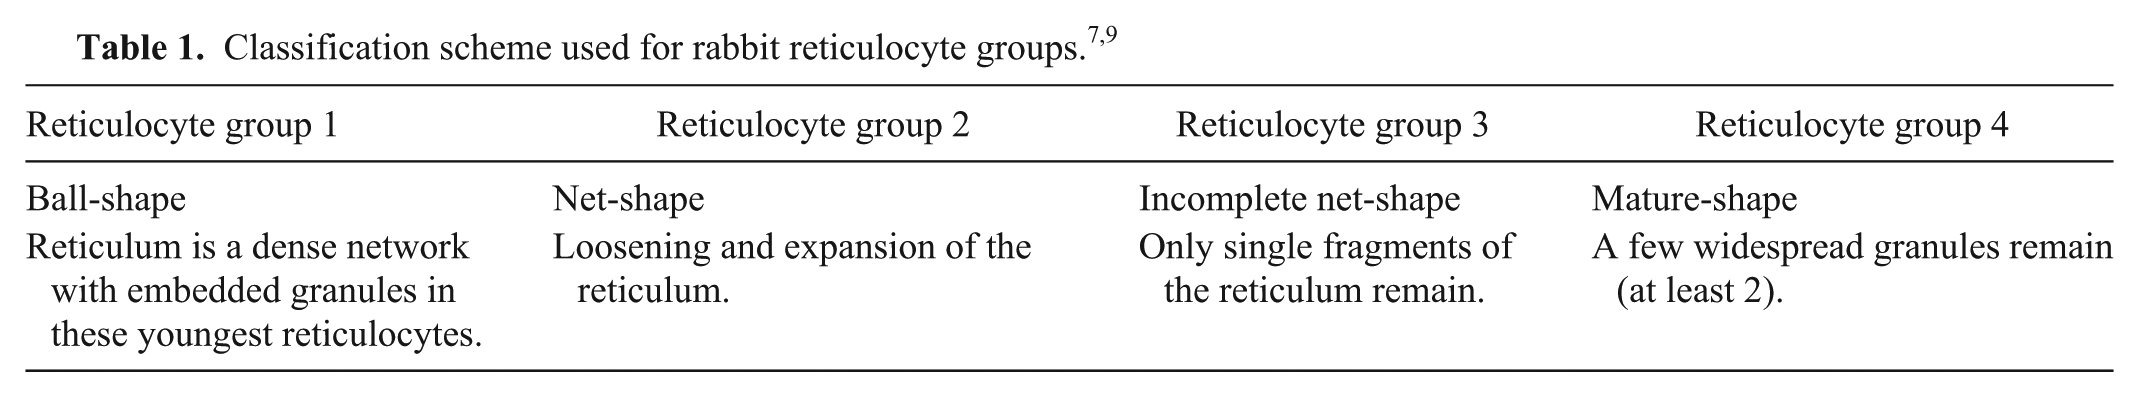
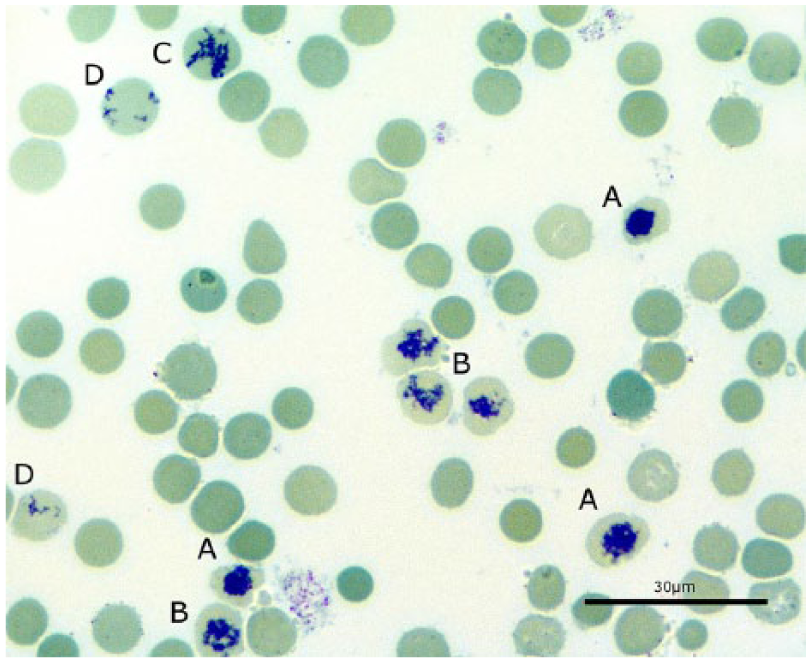
Maturation stages of rabbit reticulocytes demonstrated with brillant cresyl blue staining. 1,000× magnification. A = ball-shaped reticulum (group 1), B = net-shaped reticulum (group 2), C = incomplete net-shaped reticulum (group 3), D = mature-shaped reticulocytes (group 4). Bar = 30 μm.
Results were analyzed using various programs (SPSS Statistics for Windows v.22.0, IBM, Ehningen, Germany; MedCalc v.15.6, MedCalc Software, Ostend, Belgium; Excel 2013, Microsoft, Redmond, WA).
To compare manual counting with ADVIA 2120i counts, 289 rabbit blood samples (248 EDTA and 41 Li-heparin samples) were collected. Of the evaluated blood samples, 51.9% were from male rabbits (n = 150; 118 neutered) and 41.2% were from female rabbits (n = 119; 23 neutered). The sex was not known for 20 (7.0%) of the rabbits. The average age was 5.0 y; the youngest animal was 6 mo old, and the oldest was 9 y old.
The Spearman correlation coefficient (rs) was calculated to measure the association between the 2 methods. 11 The association was defined as follows: rs = 0.93–0.99 (excellent), rs = 0.80–0.92 (good), rs = 0.59–0.79 (fair), and rs = <0.59 (poor). 1 After rs was calculated, a Bland–Altman plot was constructed, and a Passing–Bablok regression was performed.2,12,20
To determine the reproducibility of quantification results using the ADVIA 2120i, another 33 rabbit blood samples (19 EDTA and 14 Li-heparin samples) were analyzed 5 times in a row. The coefficients of variation (CVs) for EDTA- and Li-heparin samples were then calculated from the average values of each measurement. 14 Reproducibility for manual counting results was calculated from the manual duplicate counting of the 289 rabbit blood samples from the method comparison.
Samples from 9 animals were collected in sufficient blood volume (both Li-heparin and EDTA) for comparison of the anticoagulants. Every sample was analyzed 5 times in a row with the ADVIA 2120i, with 1-min intervals between each quantification (n = 9). A Wilcoxon test was performed to compare the anticoagulants.15,19 The significance level was set at p ≤ 0.05 (significant), p ≤ 0.005, and p ≤ 0.001 (highly significant). 16
Results
A fair-to-good correlation (rs = 0.7–0.8) was determined between manual counting and the ADVIA 2120i for all comparative measurements (n = 289; Table 2). The numbers of reticulocytes quantified by the ADVIA 2120i were significantly (p = 0.001) lower than those quantified by manual reticulocyte counting. Compared with the absolute reticulocyte numbers quantified by the ADVIA 2120i, those in the manually counted groups were higher, with the following divergences (bias Bland–Altman plot): 27.9% (groups 1–4), 13.1% (groups 2 and 3), 34.0% (groups 1 and 2), and 2.6% (groups 2–4; Table 3). Passing–Bablok regression showed a negative proportional error (slope B = 0.7) when ADVIA 2120i quantification and manual counting of groups 1–4 were compared (Table 2). 13 A negative proportional error (slope B = 0.8) was observed when ADVIA 2120i counts were compared with relative manual reticulocyte counts of groups 1–3. The correlations between ADVIA 2120i and relative manual counting were good (rs = 0.8) for groups 1–4 and 1–3. A negative proportional error was observed when comparing the results of absolute reticulocyte counting by the ADVIA 2120i with manual counts of groups 1–4 and 1–3 (groups 1–4, slope B = 0.7; groups 1–3, slope B = 0.8; Table 2). The lowest proportional error appeared when relative reticulocyte numbers quantified by the ADVIA 2120i were compared with the manual counts of groups 2 and 3 (slope B = 1.0). The correlation was fair (rs = 0.7), which was also observed between absolute reticulocyte numbers of groups 2–4 (slope B = 1.0, rs = 0.7; Table 2).
Agreement between manual counting and ADVIA 2120i counting of rabbit reticulocytes (n = 289).
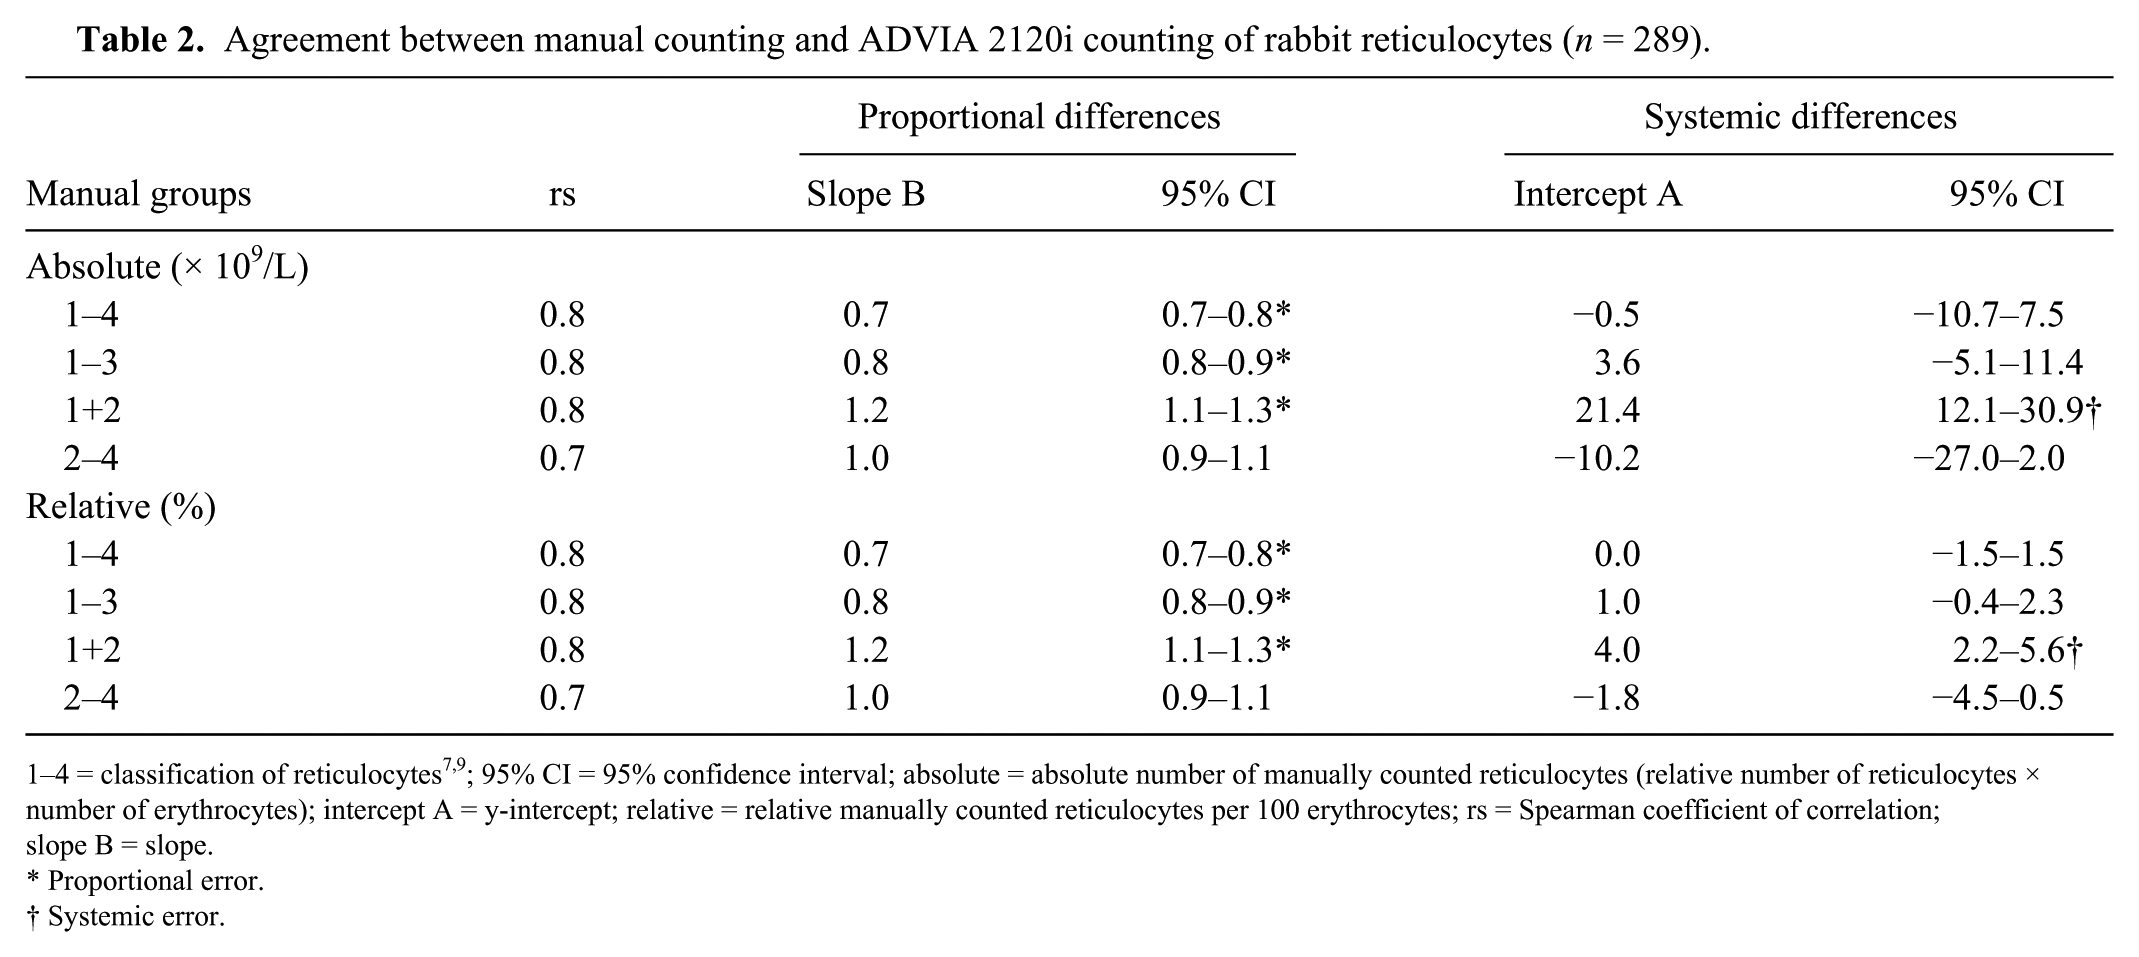
1–4 = classification of reticulocytes7,9; 95% CI = 95% confidence interval; absolute = absolute number of manually counted reticulocytes (relative number of reticulocytes × number of erythrocytes); intercept A = y-intercept; relative = relative manually counted reticulocytes per 100 erythrocytes; rs = Spearman coefficient of correlation; slope B = slope.
Proportional error.
Systemic error.
Means and absolute bias of manual counting and ADVIA 2120i counting of rabbit reticulocytes (n = 289).
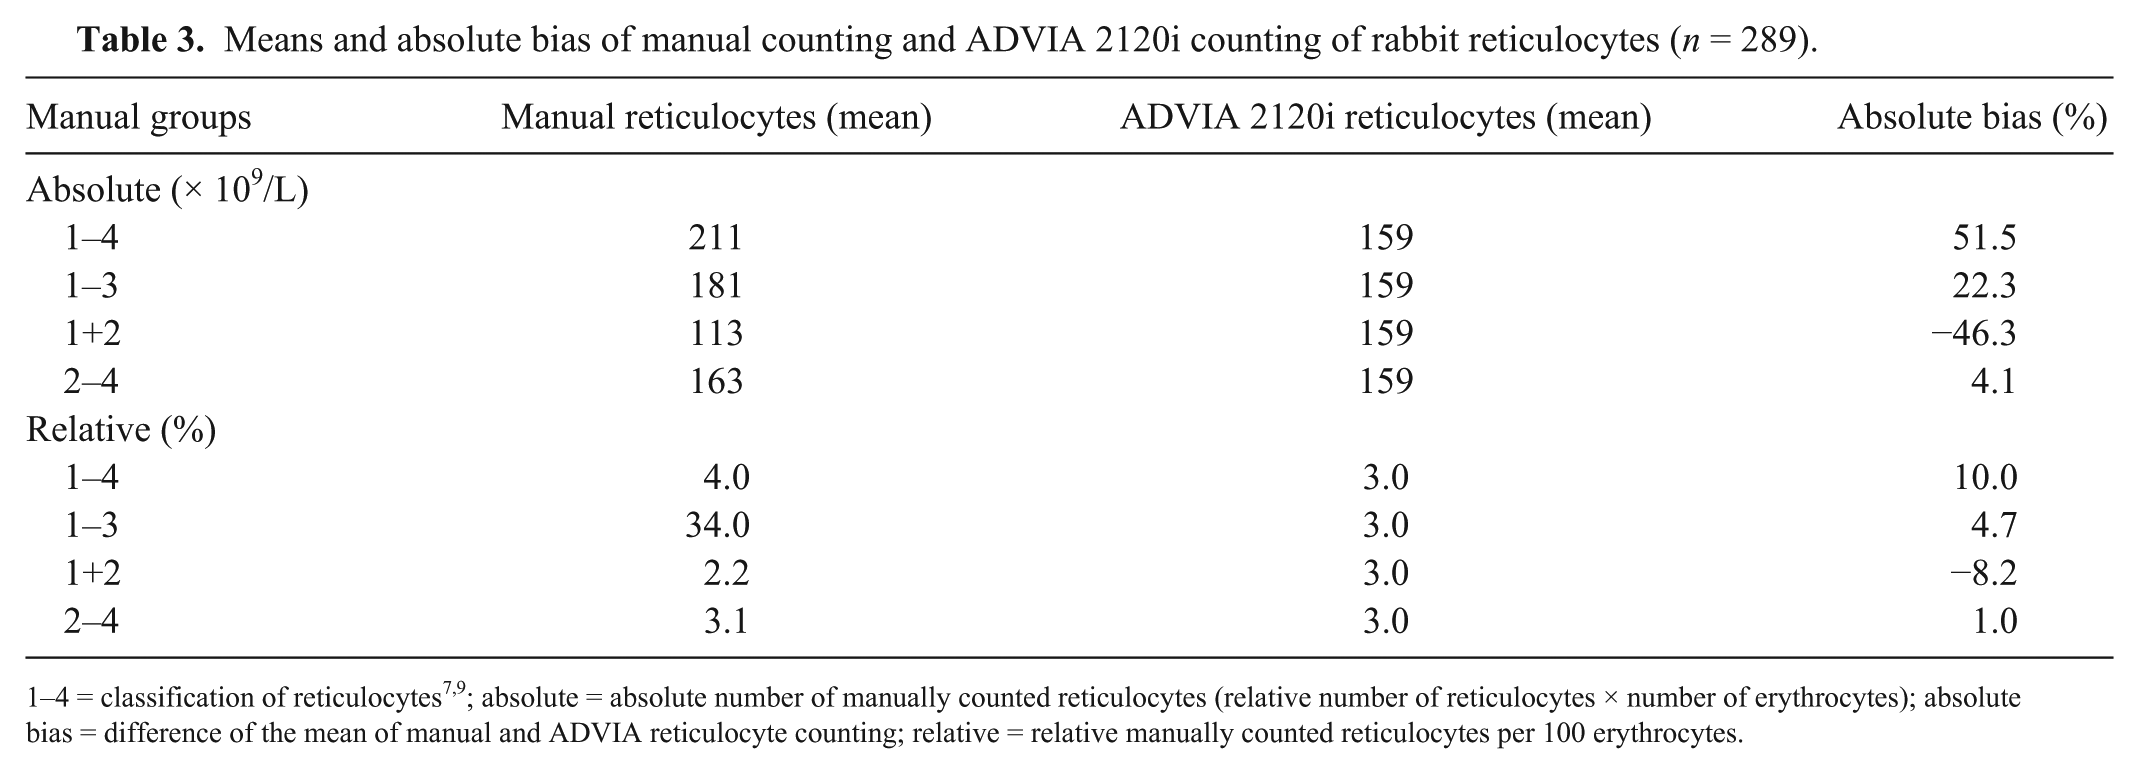
1–4 = classification of reticulocytes7,9; absolute = absolute number of manually counted reticulocytes (relative number of reticulocytes × number of erythrocytes); absolute bias = difference of the mean of manual and ADVIA reticulocyte counting; relative = relative manually counted reticulocytes per 100 erythrocytes.
An excellent reproducibility score was obtained for the relative and absolute reticulocyte numbers quantified by the ADVIA 2120i. The CVs were 4.2% and 5.6% for EDTA samples and 3.6% and 3.8% for Li-heparin samples. The CV for absolute reticulocyte numbers was 17.1% for EDTA samples and 16.7% for Li-heparin samples by manual counting. Other CV values are summarized in Table 4. The Wilcoxon test showed that Li-heparin samples had significantly higher relative reticulocyte numbers (3.8%; p = 0.044) and significantly higher absolute reticulocyte numbers (4.5%; p = 0.018) compared with EDTA blood samples.
Coefficient of variation (CV) of rabbit reticulocytes analyzed by ADVIA and manual reticulocyte counting.
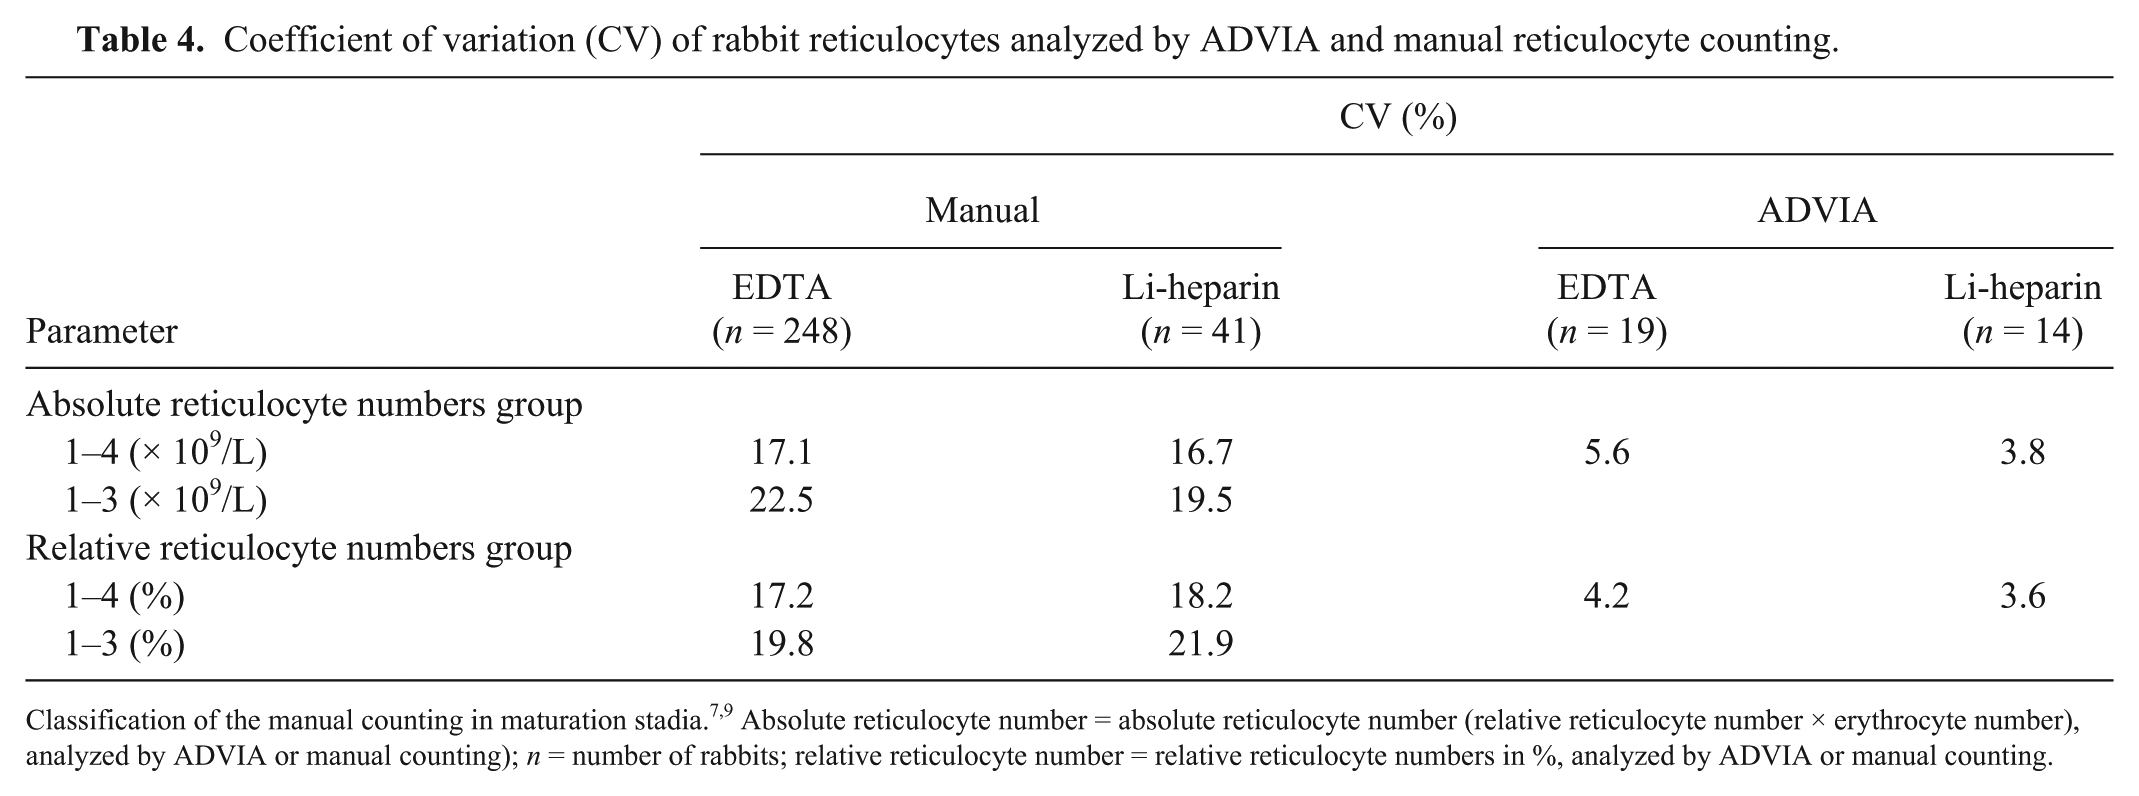
Classification of the manual counting in maturation stadia.7,9 Absolute reticulocyte number = absolute reticulocyte number (relative reticulocyte number × erythrocyte number), analyzed by ADVIA or manual counting); n = number of rabbits; relative reticulocyte number = relative reticulocyte numbers in %, analyzed by ADVIA or manual counting.
Discussion
There was good-to-fair correlation between manual reticulocyte counting and quantification by the ADVIA 2120i. Similarly, a previous study with the blood of cats and dogs reported good correlation between ADVIA 120 and manual quantification of reticulocytes (dog: rs = 0.89; cat: rs = 0.75). In cat blood, only aggregated reticulocytes were manually counted under the microscope and were compared to quantifications made by the ADVIA 120 (Weissert D. Lasergestützte Erythrozytenanalyse (ADVIA 120 und LaserCyte) bei Hund und Katze mit Auswertung der Erythrozytenmorphologie [dissertation]. Gießen, Germany: Justus Liebig-University, 2011). Another study compared the number of reticulocytes quantified by the Sysmex XT-2000iV (Sysmex, Norderstedt, Germany) and the ADVIA 120 in dog, rat, and mouse blood 15 ; excellent to fair correlations were observed (dog: r = 0.95; rat: r = 0.78; mouse: r = 0.76). 15 In our study, we found a correlation of <0.90, which indicates that one or both measuring methods had higher statistical variance. The statistical variance was larger in manual counting than in ADVIA counting (Table 2).
In our study, the results of both methods were inversely proportional. Similar findings were shown in a previous comparison of manual reticulocyte counting with the ADVIA 120 in dog blood (relative reticulocyte number: slope B = 0.91, absolute reticulocyte number: slope B = 0.94; Weissert, 2011).
In a previous study, a higher number of reticulocytes were counted by the Sysmex than by the ADVIA 120. 15 It was suggested that immature, RNA-rich, and juvenile reticulocytes may have contributed to higher reticulocyte numbers as counted by the Sysmex. 15 The Sysmex analyzer classifies reticulocytes from all animal species into 4 groups, whereas the ADVIA 120 classifies reticulocytes into 3 groups. 15 Therefore, in our study, we compared maturation stage groups 1–4 and 2–4 with the ADVIA 2120i results. The comparison of manual reticulocyte counting of groups 2–4 with ADVIA 2120i counting gave the best result (Table 2). There was a significant difference in the total number of reticulocytes in groups 1–4 and groups 2–4. In our study, group 1 reticulocytes comprised 22.3% of the total reticulocytes, group 2 comprised 31.4%, and group 3 comprised 32.3%. Group 4 reticulocytes were the least represented and comprised 13.2% of total reticulocytes. We believe that the ADVIA 2120i does not count the young group 1 reticulocytes, as suggested by the previous study. This is clinically relevant for reticulocyte counting because a divergence of only ±10% from the initial value can be tolerated.8,15
We observed good reproducibility of reticulocyte quantifications using the ADVIA 2120i analyzer. The reproducibility of reticulocyte quantifications in EDTA blood by the ADVIA 2120i analyzer has been examined previously (Dura A. Blutzellzählung und -differenzierung bei Pferd und Schwein mit dem Hämatologiesystem ADVIA 120: Gerätevalidierung und Softwareadaptation [dissertation]. Gießen, Germany: Justus Liebig-University, 2006; Holsteg M. Softwareadaptation und begleitende Evaluation des Hämatologiesystems ADVIA 120 für die Tierart Rind: Erstellung von hämatologischen Referenzbereichen für die Rinderrassen schwarzbunte Holstein und deutsches Fleckvieh [dissertation]. Gießen, Germany: Justus Liebig-University, 2002; Weissert, 2011). Fair reproducibility of absolute reticulocyte number (CV = 10.3%) and good reproducibility of the relative reticulocyte number (CV = 4.8%) was reported in canine blood (Weissert, 2011). In pig blood (Dura, 2006), fair reproducibility (CV = 9.8%) was reported, and poor reproducibility of reticulocyte numbers was observed in cattle blood (CV = 33.0%; Holsteg, 2002). In contrast to our study using rabbit blood, these investigations were performed using the earlier ADVIA 120 model. The reproducibility of manual reticulocyte counting was clearly poor compared with ADVIA 2120i counting. This is supported by a previous investigation that showed CV values of 15–40% from manual counting, depending on the investigator. 7 Fair-to-poor reproducibility of manual reticulocyte counting (CV = 20%–50%; CV = 8.3%–44.2%) was reported in previous studies.6,23 In our study, the investigators’ CV was 17% for both EDTA and Li-heparin blood (reticulocyte groups 1–4). In comparison with the mentioned studies, this was a good result (Table 4).
Although manual reticulocyte counting is not a very reliable and challenging method, it is still considered the gold standard when an automated reticulocyte analyzer is not available.4,5,18,23 Because we did not have a second hematology analyzer available in our study, manual counting was used as a standard method for comparisons, as suggested by the International Council for Standardization in Hematology. 4 The accuracy of manual counting depends on the investigator, and variations between investigators can be high.13,21 For this reason, all manual counting was performed by the same person in our study. The classification of reticulocytes is important and is one of the main sources of error. 23 Major differences between individual investigators because of solitary granules could be observed. 21 The error rate was 30% when reticulocyte morphology was not classified, and the principal source of variation was group 4 reticulocytes. 21 This was confirmed in other studies.7,10 To address this, the group 4 classification was modified.7,9 Only reticulocytes with at least 2 granules should be counted, which were visible with minimal ocular adjustment. 7 In our study, rabbit reticulocytes were classified into groups strictly according to these guidelines.7,9 Despite classification and double counting, only 1,000 erythrocytes were manually counted twice, whereas the ADVIA 2120i evaluated 50,000 erythrocytes per sample, making it potentially more accurate (Table 4). Blood samples were measured 5 times with the ADVIA 2120i and counted twice manually to test the methods for reproducibility. This improved the reproducibility of results obtained with the ADVIA 2120i analyzer. The less the reticulocyte maturation groups were combined, the higher the CV in our study (Table 4). Different compositions of reticulocyte groups 1–4 on the same blood smear in repeated counts were reported. 16 It was suggested that this was to the result of random distribution of reticulocytes among erythrocytes. 16 Thus, reproduction is better when groups 1–4 are summarized rather than compared individually (Table 4).
The number of reticulocytes was significantly higher in Li-heparin blood than in EDTA blood. This supports the findings of a previous study, 18 in which it was shown that erythrocytes and platelets aggregated in Li-heparin blood samples, leading to falsely high reticulocyte numbers. 18 Aggregation was also described in pig (Dura, 2006), cattle (Holsteg, 2002), dog, and cat blood. 1 This might be consistent with the observed increased clotting in blood samples anticoagulated with Li-heparin. Another reason for increased appearance of clotting might be improper filling of Li-heparin tubes and thus inadequate anticoagulation.
Footnotes
Declaration of conflicting interests
The authors declared no potential conflicts of interest with respect to the research, authorship, and/or publication of this article.
Funding
The authors received no financial support for the research, authorship, and/or publication of this article.