
Abstract
We performed analytical validation of an automated ferric-reducing ability of plasma (FRAP) assay in the serum of dogs. Intra- and interassay precision, accuracy, detection limit, and effects of hemolysis and lipemia were evaluated. Intra- and interassay coefficients of variation were <1% and <13%, respectively. The assay showed a high correlation with a FRAP assay described previously, and results were linear when serial sample dilutions were tested. The detection limit was lower than the values observed in sera from healthy dogs; decreased serum FRAP was found in dogs with leishmaniosis. Lipemia and hemolysis caused a significant increase in the results of the assay.
In the past 20 y, growing awareness of the importance of radical-mediated reactions in biology has become a major impetus to the study of antioxidants. 15 An antioxidant is defined as any substance that, when present at low concentration compared to those of an oxidizable substrate, significantly delays or prevents oxidation of that substrate. 6
Several methods have been developed to assess the total antioxidant capacity (TAC) of serum because of the difficulty in measuring each antioxidant separately.5,15 The ferric-reducing ability of plasma (FRAP) assay, which measures the ability of the antioxidants present in the sample to reduce ferric (Fe3+) to its ferrous (Fe2+) form, has been widely used as a test of TAC. The FRAP assay provides an integrated measurement of various antioxidants such as uric acid, ascorbic acid, and α-tocopherol. 2 Human patients with chronic pancreatitis 20 or poorly controlled diabetes 11 showed decreased FRAP concentrations. Dogs with heart disease 8 or mammary carcinoma 12 had increased serum FRAP. On the other hand, dogs with behavioral problems had decreased serum FRAP. 16 Age does not have a major influence on FRAP concentrations. 4
To our knowledge, analytical validation of the FRAP assay with canine serum samples has not been published. We therefore performed analytical validation of an automated FRAP assay for measuring TAC in dog serum by investigating assay characteristics, including precision, accuracy, detection limit, and the effects of hemolysis and lipemia. In addition, behavior of the FRAP assay was evaluated in dogs with leishmaniosis, a disease known to cause oxidative stress.7,19
The FRAP assay was used as described in a study in humans, 2 but without sample dilution and adapted to a different biochemical analyzer. a The method is based on the capacity of antioxidants to reduce the ferric-tripyridyltriazine (Fe3+-TPTZ) complex to the colored ferrous-tripyridyltriazine (Fe2+-TPTZ) at pH 3.6. The color intensity is related to the antioxidant capacity of the mainly non-enzymatic antioxidants in the plasma, which reflects their ability to reduce reactive oxygen species. 2 The working FRAP reagent was prepared daily as described previously 2 by mixing 10 volumes of 0.3 mol/L of acetate buffer (pH 3.6), 1 volume of 0.01 mol/L of TPTZ b in 40 mmol/L of hydrochloric acid, b and 1 volume of 0.02 mol/L of ferric chloride hexahydrate (FeCl3·6H2O) b solution. The working solution is stable for only 1 d; however, the solutions used to prepare the working solution are stable at 4°C for several months. A standard of ferrous sulfate heptahydrate (FeSO4·7H2O) b solution at 1.0 mmol/L was prepared and then serially diluted manually with ultrapure water c in the range of 0.1–1.0 mmol/L. The results obtained for test samples were compared with a standard curve obtained with Fe2+ and expressed in millimoles of Fe2+ equivalents per liter.
FRAP concentration was measured in canine sera on an automated biochemistry analyzer. a In brief, 10 µL of sample were added to 300 µL of freshly prepared FRAP reagent, and a first read at 600 nm was taken. The assay mixture was incubated at 37°C for 240 s. Then, a second read at 600 nm was taken, and the difference between the first and the second read were used to calculate the antioxidant capacity of the sample.
To assess the analytical performance of the method, precision, accuracy, and detection limit were determined.10,18 Intra-assay precision was determined as the coefficient of variation (CV) between 5 replicates from 3 canine serum samples in 1 assay run. The same serum samples were used to determine the interassay CV from the mean and standard deviation (SD) of 5 replicate determinations on 5 different days. Accuracy was investigated by assay comparison and the evaluation of linearity under dilution. For assay comparison, serum samples from 31 dogs were measured with the automated assay described herein and with a previously validated FRAP assay 3 using a microplate reader d that, in our laboratory conditions, showed an intra-assay CV of <13% and a linear regression equation with an r2 value of 0.991 with serial dilution of a canine serum. To study linearity under dilution, duplicate determinations of FRAP were made for a canine serum diluted at 1:2, 1:4, 1:8, 1:16, and 1:32 using ultrapure water. c The detection limit was calculated as the mean result +3 SD from 20 replicate determinations of ultrapure water. In addition, 7 sera were analyzed at the day of collection, stored frozen at −20°C for 8 mo, analyzed again, and the FRAP results were compared.
In order to study the effect of hemolysis and lipemia, serum samples from 3 dogs were mixed with various concentrations of hemoglobin and lipid solution, respectively, as described, 13 and FRAP was measured. To obtain fresh hemolysate, blood was collected from 1 dog and centrifuged, the buffy coat layer was discarded, and the erythrocytes were washed 3 times in saline (1:2, v/v). The red blood cells obtained were lysed with distilled water, and the hemoglobin concentration was adjusted to 80, 40, 20, 10, 5, and 0.0 g/L. Hemoglobin concentration in hemolysate was determined by use of a veterinary animal blood cell counter. e Ten microliters of each solution of hemoglobin were added to 90 µL samples of canine serum to produce test samples with final hemoglobin concentrations of 8, 4, 2, 1, 0.5, and 0.0 g/L, respectively. The 0.0 g/L concentration was reached by adding 10 µL of ultrapure water c to 90 µL of the serum sample. Prepared samples were used to determine the FRAP concentrations. A commercial lipid emulsion f with triglyceride concentration of 200 g/L was serially diluted with ultrapure water c to obtain 50, 25, 12.5, 6.25, 3.125, and 0.0 g/L. Ten microliters of each dilution were added to 90 µL of the serum samples and were used to determine the FRAP concentration. The final concentrations of triglycerides in the samples were 5, 2.5, 1.25, 0.625, 0.3125, and 0.0 g/L (10 µL of ultrapure water c was added to 90 µL of the serum samples).
FRAP concentrations were determined in clinically healthy dogs and dogs with leishmaniosis. The control samples were from 32 clinically adult healthy dogs that had been presented for routine check-ups, had no abnormal findings at physical examination, and routine hematologic and biochemical test results were unremarkable. Samples from 47 dogs with leishmaniosis were also included in our study. A diagnosis of leishmaniosis was established based on compatible clinical signs and by positive ELISA serology g and/or positive PCR. Blood samples of the healthy and diseased dogs were collected by jugular or cephalic venipuncture and placed into tubes without anticoagulant. The samples were centrifuged at 3,500 × g for 5 min, and collected sera were stored in plastic vials at −20°C until analyzed.
Arithmetic means, medians, intra- and interassay CVs, and detection limit were calculated using routine descriptive statistical procedures and computer software. h Linearity under dilution was evaluated through ordinary linear regression analysis, and Wald–Wolfowitz runs test was performed to determine whether data deviated significantly from linearity. Comparison between methods was assessed by Pearson correlation and Bland–Altman analyses. A paired t-test was used to compare the results obtained before and after 8 mo of storage. The influence of hemolysis or lipemia on FRAP concentration was investigated by use of 1-way analysis of variance and the Dunnett test for multiple comparisons. Interferograms were prepared to show the differences in FRAP values when hemoglobin or lipids were added. An unpaired t-test was performed to assess differences between healthy dogs and dogs with leishmaniosis. Significance was set at p < 0.05.
Intra-assay CVs were <1% and interassay CVs were <13% (Table 1). Serial dilution of a canine serum resulted in a linear regression equation with an r2 value of 0.999 (Fig. 1). A significant correlation between the automated FRAP assay described herein and the previously validated FRAP assay was found (r = 0.9, p < 0.001). In addition, the Bland–Altman plot indicated a proportional discrepancy between the assays (bias = −0.032, SD = 0.106; Fig. 2). The detection limit was 0.031 mmol/L (mean ± SD, 0.008 ± 0.008). No significant differences (p > 0.05) were seen between FRAP concentrations obtained before (0.413 ± 0.141 mmol/L) and after (0.429 ± 0.146 mmol/L) 8 mo of storage at −20°C.
Intra- and interassay coefficients of variation (CVs) obtained for 5 replicates of 3 sera with high, medium, and low concentrations of ferric-reducing ability of plasma.*
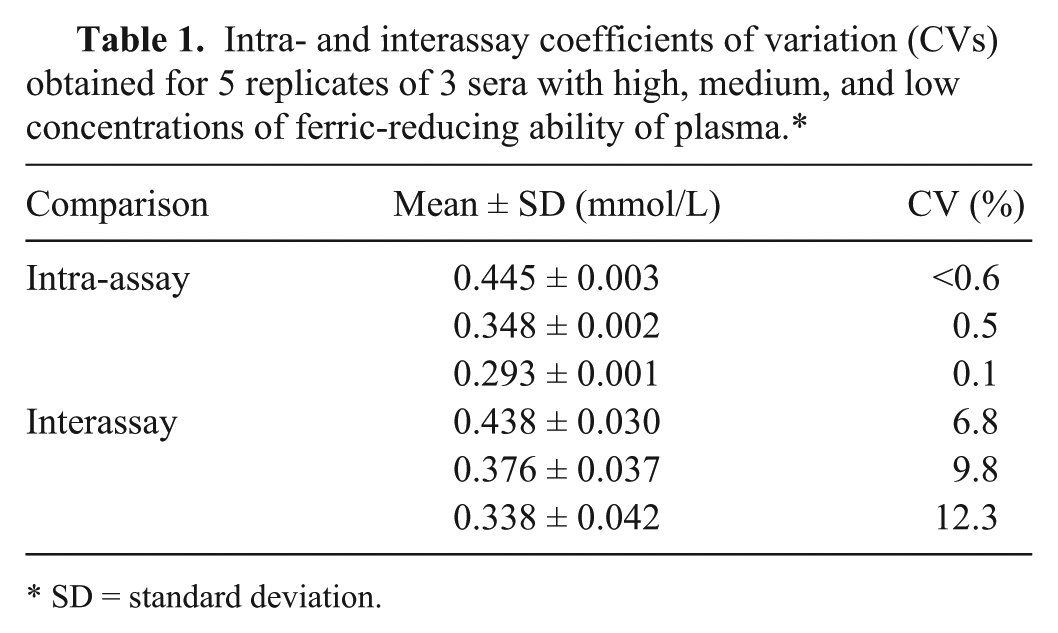
SD = standard deviation.
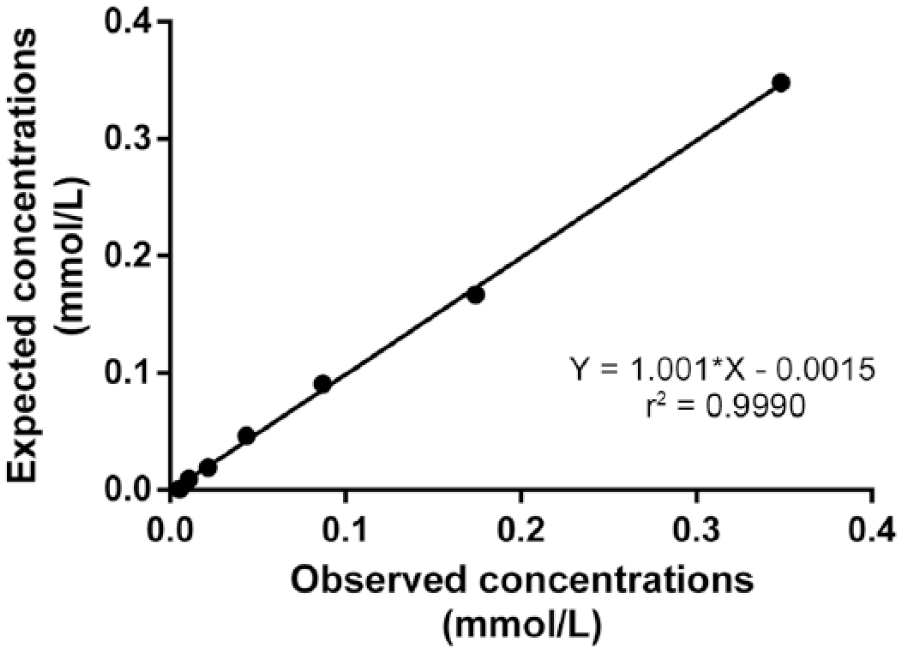
Linearity of the ferric-reducing ability of plasma assay. Regression line showing a canine serum sample at various dilutions. Regression equation and coefficient of determination (r2) are shown.
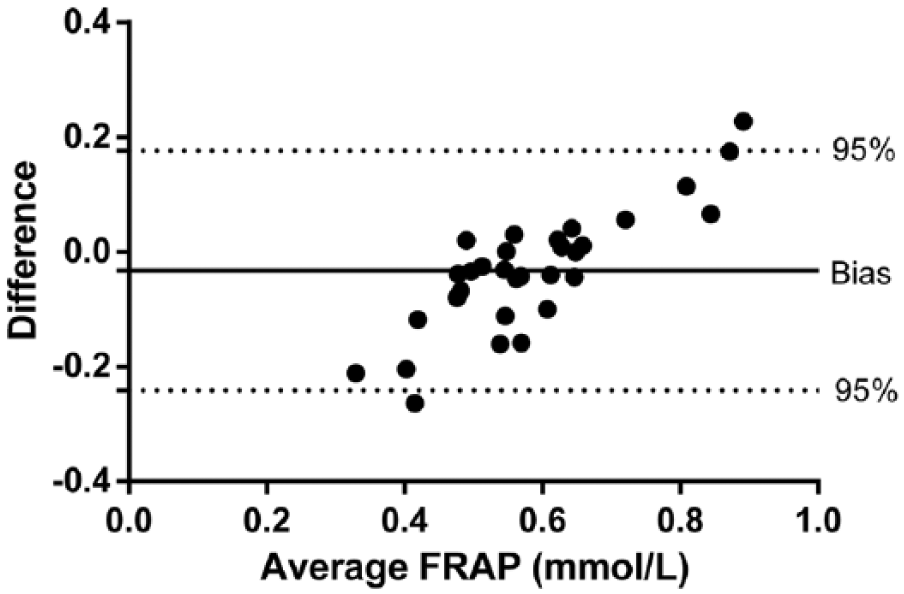
Bland–Altman difference plot for ferric-reducing ability of plasma (FRAP) concentrations in canine serum samples using an automated and a manual assay (n = 31).
The addition of hemoglobin did not interfere with FRAP concentrations up to 1 g/L; however, greater concentrations of hemoglobin caused a significant increase in the FRAP results (Fig. 3A). Lipids significantly interfered with the FRAP concentrations. The changes were directly proportional to the lipid concentration (Fig. 3B).
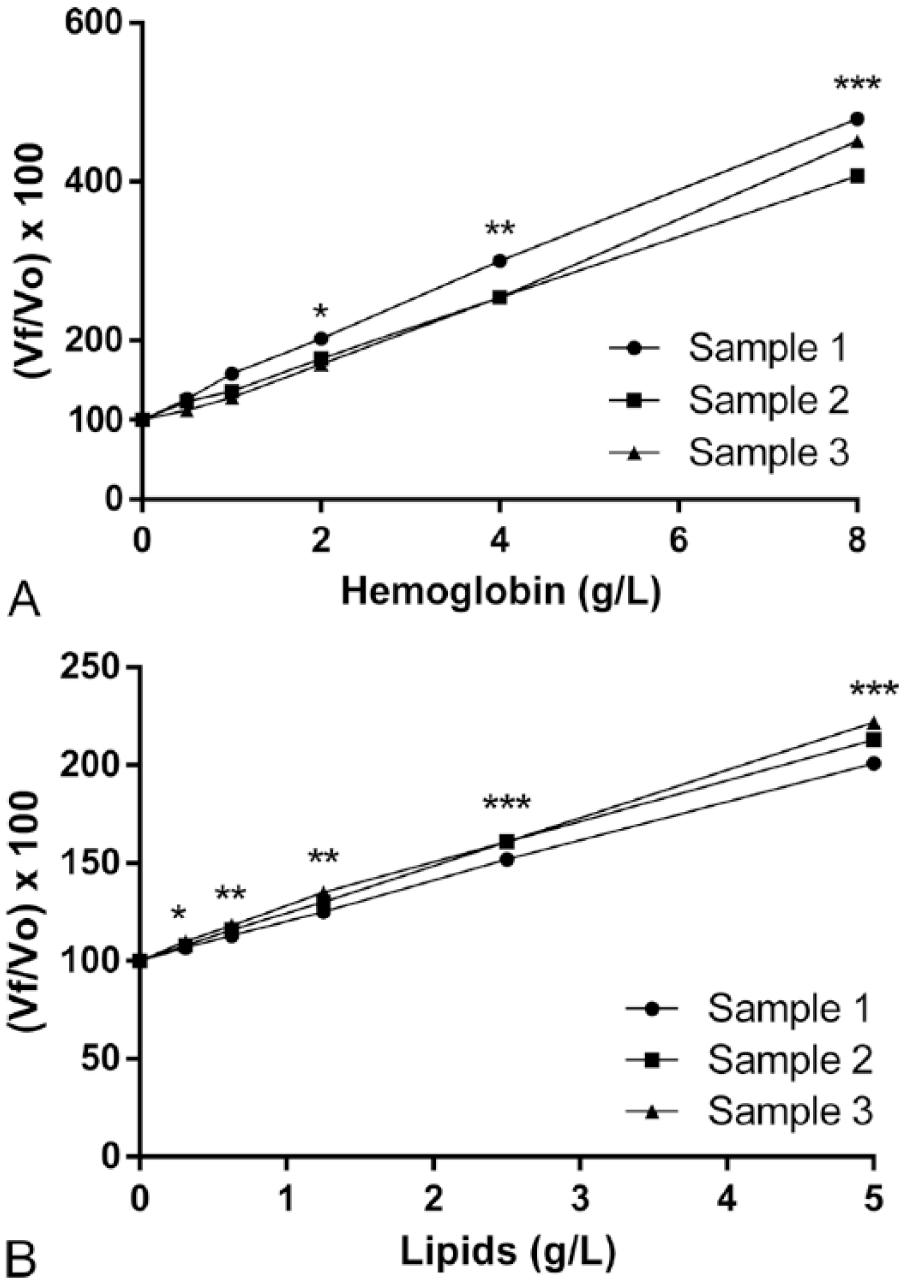
Interferograms for the effect of hemoglobin (
The dogs included in our study (healthy and with symptomatic leishmaniosis) were of several breeds and were 1–11 y old. Serum FRAP in dogs with leishmaniosis were significantly lower (p = 0.001; mean ± SD, 0.359 ± 0.064 mmol/L) than those observed in healthy dogs (0.407 ± 0.059 mmol/L; Fig. 4).
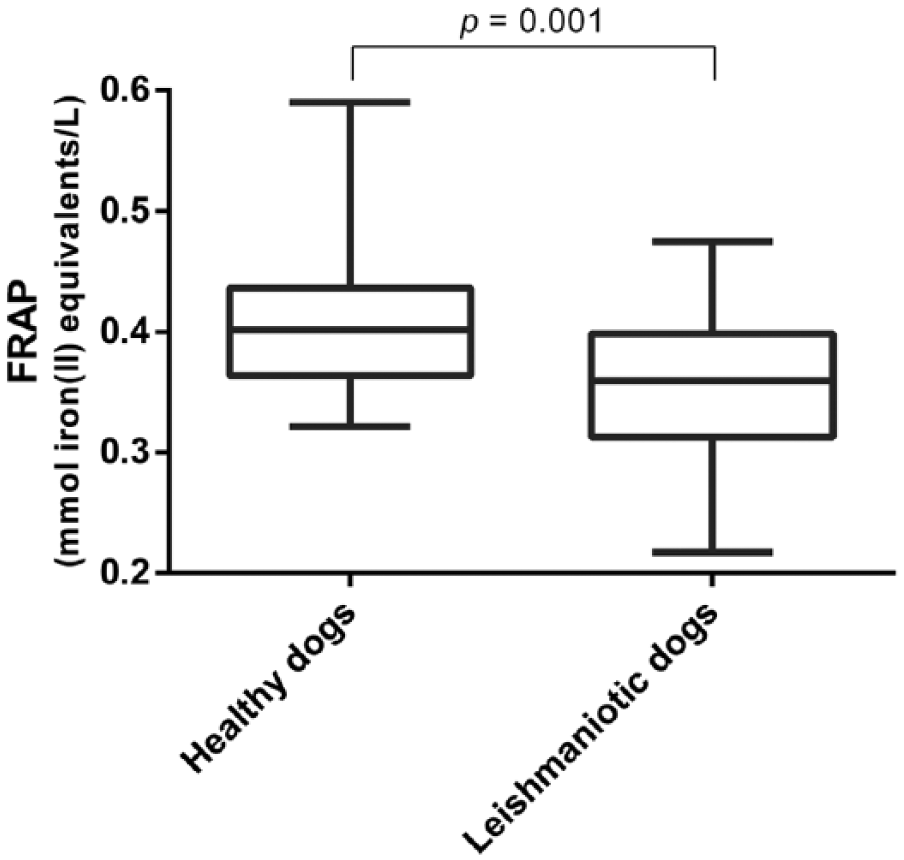
Ferric-reducing ability of plasma (FRAP) concentrations in healthy dogs and dogs with symptomatic leishmaniosis. The plots show median (line within box), 25th and 75th percentiles (box), and minimum and maximum values (whiskers).
The automated method validated in our study for FRAP measurement in canine serum samples was simple, fast, and easy to perform, uses a low sample volume (10 µL), and thus is suitable for a clinical laboratory. It has some improvements over methods described previously,2,14 given that there is no need to dilute the sample, making the assay simpler and faster.
The intra-assay CVs of <1% observed herein were comparable to those reported in human plasma and serum.2,9 The same authors 2 reported an interassay CV <3%; however, others revealed an intra-assay CV of 11.4% using a microplate format for human serum, 9 which is similar to that found in our study and is considered acceptable (<15%).10,17 The assay was linear in canine serum and showed a proportional bias with a previously validated manual assay. It was previously demonstrated that the FRAP assay was linear with single antioxidants in aqueous solutions 2 ; however, no data about serum or plasma samples were reported. The mean FRAP concentration previously found in plasma of healthy humans was 0.101 mmol/L, 2 lower than that found in serum of healthy dogs (mean: 0.407 mmol/L) in our study. The detection limit was below the range for canine serum FRAP concentrations observed in all samples used in our study. Lipemic and hemolyzed serum samples are commonly submitted for testing at diagnostic laboratories, and the test results can be altered by interference of these substances, making interpretation of results difficult. Spectrophotometric determination can be influenced by scattering of light rays by the lipid content of the sample; free hemoglobin can increase absorbance of tests run at wavelengths of 500–600 nm, which is the absorbance range of hemoglobin. 13 In the case of lipemic samples, caution is needed when interpreting results because slight lipemia (0.312 g/L) was sufficient to cause a significant increase in the FRAP concentrations. Only severe hemolysis resulted in substantial interferences in the FRAP assay.
In humans, serum FRAP is mainly influenced by uric acid (60%), ascorbic acid (15%), protein (10%), bilirubin (5%), α-tocopherol (5%), and other substances (5%). 2 Although there are no similar studies published in dogs, given the different uric acid metabolism in dogs, the distribution of the components that influence FRAP could be different. Further studies would be desirable to evaluate the serum components that could influence FRAP concentrations in dogs. Our FRAP concentrations in healthy dogs would be in the lower range of values described in dogs in literature (0.20 mmol/L 16 to 0.80 mmol/L 12 ). It could be postulated that the different assays and sources of standard used for calibration could cause these different FRAP concentrations. We used Fe2+ as our standard; however, ascorbic acid, for example, has also been used for method calibration in other assays. 4
Dogs with symptomatic leishmaniosis had lower serum FRAP than healthy dogs. Infection by Leishmania induces oxidative burst generation and production of reactive oxygen species as part of the host response to the parasite. 19 Therefore, a decrease in antioxidant capacity in response to oxidative stress may be expected in dogs with leishmaniosis.1,7 Further studies should be developed to evaluate the behavior of the FRAP assay in dogs with other diseases as well as in dogs with leishmaniosis at different clinical stages.
Footnotes
a.
Olympus AU600 automatic chemistry analyser, Olympus Europe, Hamburg, Germany.
b.
Sigma-Aldrich Quimica, Madrid, Spain.
c.
Synergy water purification system, EMD Millipore, Darmstadt, Germany.
d.
Powerwave XS, Biotek Instruments, Carson City, NV.
e.
ADVIA 120, Siemens Healthcare Diagnostics, Marburg, Germany.
f.
Lipofundina 20%, Braun Medical, Barcelona, Spain.
g.
Leiscan leishmania ELISA, Esteve Veterinaria, Barcelona, Spain.
h.
Prism version 5 for Windows, GraphPad Software, San Diego, CA.
Declaration of conflicting interests
The authors declared no potential conflicts of interest with respect to the research, authorship, and/or publication of this article.
Funding
The authors disclosed receipt of the following financial support for the research, authorship, and/or publication of this article: Funds for this study were provided by the CNPq (Brazil) for PhD scholarship, by the Program “Juan de la Cierva” of ‘Ministerio de Economia y Competitividad’, Spain, and by the Seneca Foundation of Murcia Region (19894/GERM/15).