
Abstract
A validation of a species-specific enzyme immunoassay for urinary clusterin measurement in dogs was performed, and the use of urinary clusterin as a marker of renal damage was evaluated in a population of dogs with leishmaniasis. Urine was obtained from 75 dogs; 64 dogs had leishmaniasis and 11 were healthy. The dogs with leishmanias were divided into 5 groups: I (n = 9; serum creatinine [SCr] < 1.4 mg/dl, urinary protein-to-creatinine [UPC] ratio ≤ 0.5); II (n = 29; SCr < 1.4 mg/dl, UPC > 0.5); III (n = 6; SCr ≥ 1.4 mg/dl to <2 mg/dl, UPC > 0.5); IV (n = 13; SCr ≥ 2 mg/dl to <5 mg/dl, UPC > 0.5); and V (n = 7; SCr ≥ 5 mg/dl, UPC > 0.5). The urinary clusterin concentration was measured, and the urinary clusterin-to-creatinine ratio was calculated. Canine urinary clusterin assay showed good analytical performance based on precision accuracy and limit-of-detection results. There was a statistically significant increase in urinary clusterin and clusterin-to-creatinine ratio in groups II–V compared with group I and healthy group. The results of the current study showed that urinary clusterin concentration and urinary clusterin-to-creatinine ratios are increased in dogs with analytical evidences of renal damage and that the urinary clusterin-to-creatinine ratio might be used as a potential early biomarker of chronic kidney disease.
Introduction
In kidney disease, alterations in serum urea nitrogen and serum creatinine (SCr) only occur when more than 75% of renal functional mass has declined, indicating that these test parameters are not sensitive enough to detect early kidney damage. 9 An early diagnosis might allow for therapeutic intervention, preventing further damage and the progressive decline of renal function 28 leading to chronic kidney disease (CKD). 21 Because there is a high risk of progression to irreversible renal damage in patients with CKD, there is a need for early detection of kidney dysfunction in dogs using renal biomarkers. 17 Unlike insensitive serum urea nitrogen and SCr concentrations, urinary biomarkers such as immunoglobulin G, thromboxane B2, retinol-binding protein, and N-acetyl-β-D-glucosaminidase have been proposed as more sensitive indicators of renal injury. These biomarkers have been validated to evaluate renal injury in dogs17,22,28 and may have the potential to reflect the site and severity of renal damage.
Urinary clusterin (U-clusterin) has been approved as a biomarker to monitor drug-induced proximal tubular injury in rats by the U.S. Food and Drug Administration and the European Medicines Agency. 7 Clusterin is a glycoprotein that is composed of 2 40-kD subunits (NA1, NA2) bonded by disulphide groups. 1 Functions attributed to clusterin include protecting cells from stress, transporting lipids, promoting cell aggregation and sperm maturation, serving an antiapoptotic role, protecting cellular function in specific renal disease, and being involved in the regulation of complement activity. Clusterin is upregulated and released into the urine when the kidney is damaged.23,25 Controversy exists about the information that U-clusterin provides. One study found that this protein increases in urine from rats with polycystic kidney disease with tubular damage, but not in focal glomerulosclerosis. This study concluded that the determination of U-clusterin may be helpful to differentiate tubular from glomerular forms of proteinuria. 13 However, U-clusterin is also considered to be a general biomarker of renal injury with no specific nephronal location.7,10 Increased production of clusterin has been reported in various kidney diseases including posturethral obstruction,2,20 during ischemia-reperfusion injury,24,29 and in the peri-infarct region following subtotal nephrectomy 4 in rats.
Increased U-clusterin concentrations occur earlier than histopathological changes, showing that it is a sensitive marker of minimal kidney injury in rats. 7 Moreover, U-clusterin concentrations increase before SCr changes are evident in rats treated with gentamicin. 13 Thus, this renal biomarker is more sensitive than serum urea nitrogen and SCr. 10 All of these observations suggest that measurement of U-clusterin excretion may be useful to detect early renal tubular injury and global kidney damage in a clinical setting.
Canine leishmaniasis is an endemic disease in the Mediterranean area that causes various degrees of glomerular disease, which can lead to CKD.12,14,18 The prevalence of renal disease in dogs with leishmaniasis varies from 49.5% to 82%,5,26 which is higher than the prevalence of renal disease in dogs without leishmaniasis (≤15% in dogs over 10 years old). 21 There are several reports where histopathological evidence of glomerulopathy is shown in dogs with leishmaniasis.11,16 Although leishmaniasis affects glomeruli initially, the tubules are also altered by immune complexes attributed to secondary inflammation and reduction in the perfusion of the peritubular capillaries, leading to tubular and interstitial damage.27,19,3,30
The two aims of the current study were to perform a validation of a species-specific enzyme immunoassay (EIA) for U-clusterin measurement in dogs and to evaluate the use of U-clusterin as a biomarker of renal damage in dogs with different stages of renal damage using leishmaniasis as a natural model of kidney disease.
Materials and methods
Animals
The current study was performed at the Veterinary Medicine School of Murcia University (Murcia, Spain), was approved by the Local Ethical Committee, and was performed in compliance with laws RD32/2007 and RD1201/2005 concerning animal experimentation in Spain. Seventy-five dogs, 39 males and 36 females, with ages ranging from 1.17 to 15.08 years, were included in the study. Eleven of 75 dogs (age range: 3.83–10.92, mean: 7.41) were healthy with no abnormalities found during physical examination or following hematologic, biochemical, and urinalysis testing during routine checkups. Sixty-four out of 75 (age range: 1.17–15.08 years, mean: 6.88) dogs had leishmaniasis that was classified into 5 groups. Group I (n = 9) was composed of dogs with SCr < 1.4 mg/dl, urinary protein-to-creatinine ratio (UPC) ≤ 0.5, normal clinical examination, hyperglobulinemia, and polyclonal gammopathy. The rest of the animals were staged according to the International Renal Interest Society (IRIS group) 8 classification: group II (n = 29; SCr < 1.4 mg/dl, UPC > 0.5) corresponding with stage I of IRIS staging; group III (n = 6; SCr ≥ 1.4 mg/dl to <2 mg/dl, UPC > 0.5) corresponding with stage II of IRIS staging; group IV (n = 13; SCr ≥ 2 mg/dl to <5 mg/dl, UPC > 0.5) corresponding with stage III of IRIS staging; and group V (n = 7; SCr ≥ 5 mg/dl, UPC > 0.5) corresponding with group IV of IRIS staging (Table 1).
Distribution of dogs with leishmaniasis in the current study (n = 64).*
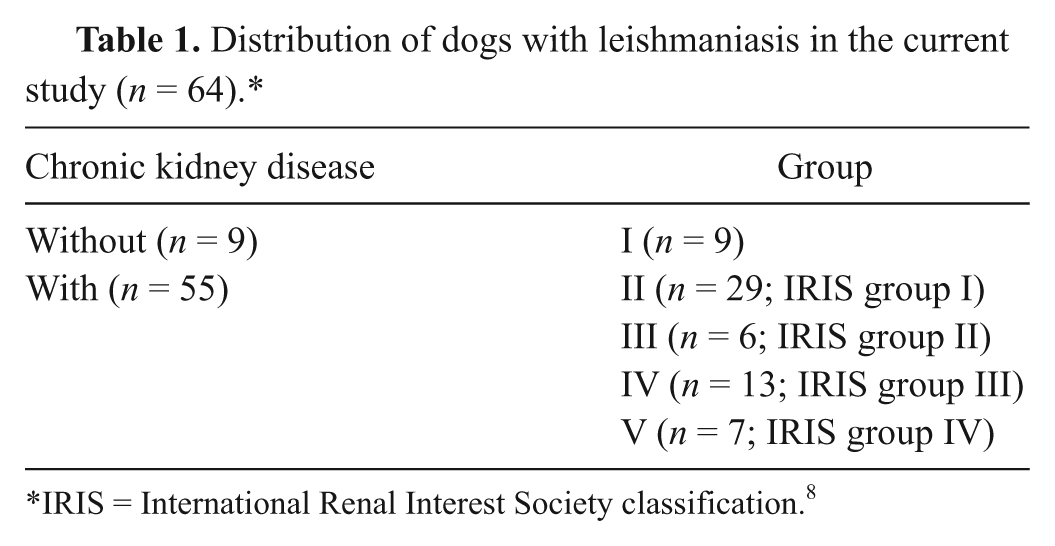
IRIS = International Renal Interest Society classification. 8
Dogs with leishmaniasis had clinical and/or laboratory test abnormalities compatible with the disease. The diagnosis of leishmaniasis was confirmed by positive indirect fluorescent antibody titers to detect serum antibody against leishmania infection and by visualization of Leishmania spp. amastigotes in bone marrow samples. Diagnosis of CKD was based on the presence of proteinuria without abnormalities in the urinary sediment, azotemia, or both, in the presence of associated clinical signs such as weight loss, anorexia, polyuria/polydipsia, vomiting, and/or ascites. Dogs suspected of having systemic or infectious diseases other than leishmaniasis that could cause glomerulopathy were not included in the study.
Sample collection
One blood sample was obtained from each dog for routine serum biochemical testing a after at least a 12-hr fasting. At the same time, a urine sample was obtained by cystocentesis (5 ml, 22-gauge needles) for sediment examination, as well as protein b and creatinine c determinations, using a commercial kit and an autoanalyzer a ; UPC was calculated from these values. The urine samples were immediately diluted 1:2 with a stabilizer solution, d and aliquots of 0.5 ml from each dog were stored at –20ºC until analysis of clusterin was performed.
Clusterin assay
Clusterin concentrations were determined with a commercial sandwich EIA for the quantitative measurement of canine clusterin. d Just prior to performing the test, all urine samples were diluted to 1:300 with dilution buffer. Samples that gave values under the limit of detection of the test were remeasured at a 1:3 dilution. To perform the assay, wells of a microtiter plate precoated with polyclonal anticanine clusterin antibody were filled with 100 µl of diluted standards, quality controls, dilution buffer (blank), and patient samples, and then incubated for 1 hr. After washing 3 times, a biotin-labeled antibody solution was added into each well and incubated for 1 hr. After several wash steps, each well was filled with streptavidin–horseradish peroxidase conjugate. After an incubation of 30 min and wash steps, a substrate solution was added into each well. After an incubation of 10 min, a stop solution was added to arrest color development. The absorbance of each well was measured with a microplate reader e at a wavelength of 450 nm with 650 nm as a reference.
A 4-parameter logistic curve-fitting program was used to generate the standard curve and calculate clusterin concentration in the urinary samples. The measured concentration of samples calculated from the standard curve was multiplied by their respective dilution factors and then the urinary clusterin-to-creatinine (UCL/Cr) ratio was calculated.
Analytical validation
Three standard criteria for immunoassay validation were assessed: intra- and interassay precision, limit of detection, and accuracy (evaluated indirectly by linearity under dilution and a spiking recovery test). The intra-assay precision, expressed as the coefficient of variation (CV), was calculated by measuring 2 pools of urine samples (samples from 5 animals integrated in each pool) with low and high concentration of clusterin (39 ng/ml and 4,756 ng/ml, respectively) 5 times in a single analytical run. The same pools were used to determine the interassay precision by analyzing them on 5 different days within 1 month. The samples were frozen in aliquots, and vials were only thawed as required for each analytical run in order to prevent possible variation as a result of repeated freeze–thaw cycles. The means and standard deviations of the 5 determinations were calculated for each pool and used to determine the CVs.
The detection limit was defined as the lowest concentration of clusterin that could be distinguished from a specimen of zero value. It was calculated for the immunoassay based on data from 10 replicate determinations of the zero standard (sample diluents buffers) as the mean plus 3 standard deviations.
To determine linearity under dilution, 2 urine samples were used: 1 sample from a healthy dog that was serially diluted (1:3, 1:6, 1:12, and 1:24) with assay buffer, and 1 sample from a dog with leishmaniasis and proteinuria that was successively diluted (1:300, 1:900, 1:1,800, 1:3,600, and 1:7,200) with the same solution. The clusterin concentration was measured for each dilution. Afterward, curves representing measured clusterin concentration versus expected clusterin concentration were constructed, and the coefficients of correlation were calculated.
To evaluate the ability of the assay to recover the amount of analyte added to urine samples, a spiking recovery was performed. For this purpose, 3 different amounts of recombinant canine clusterin were added to 5 different urine samples (3 with low concentrations and 2 with high concentrations). Test recovery (in percent) was calculated for each dilution as a comparison of expected versus measured clusterin.
Statistical analysis
Intra- and interassay CVs and detection limits were calculated using routine descriptive statistical procedures with a spreadsheet program. Ordinary regression analysis was used to investigate linearity under dilution. Kolmogorov–Smirnov testing was performed to assess the normality of data, giving a nonparametric distribution; data were then log transformed, and one-way analysis of variance of repeated measures and Tukey post-test were used to compare values of different groups by using a statistical program. f A P value < 0.05 was considered statistically significant. A Spearman correlation analysis was used for the comparison of UCL/Cr and UPC ratios.
Results
Analytical validation of the clusterin assay
Results of the analytical validation are shown in Table 2. The intra-assay precision had CVs of 1.5% and 10.9% for samples with low and high concentrations (39 ng/ml and 4,756 ng/ml), respectively. The interassay precision provided CVs of 14.2% and 16.1% for both concentrations of clusterin, respectively.
Intra- and interassay variation in determination of clus-terin concentrations in canine urine samples with canine enzyme immunoassay.*
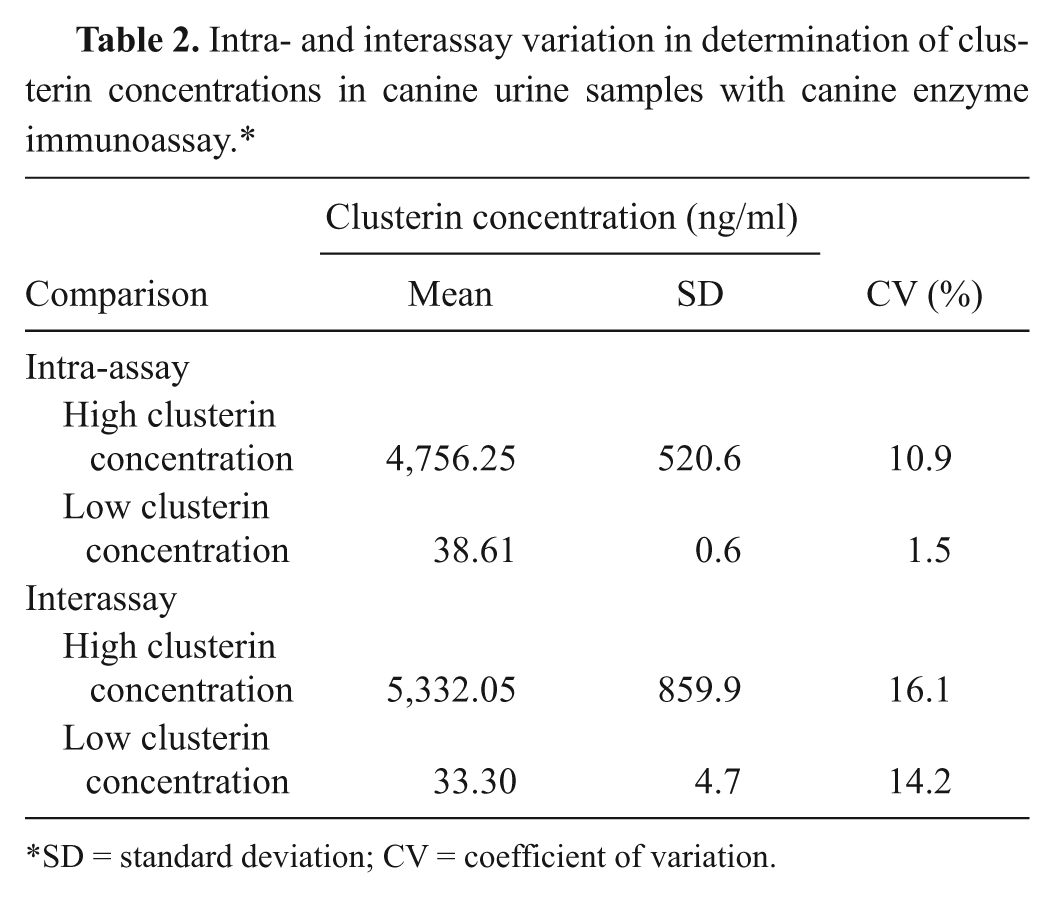
SD = standard deviation; CV = coefficient of variation.
The calculated analytical limit of detection was 0.22 ng/ml. Dilution of 2 canine urine samples, 1 with low concentration (17.3 ng/ml) and 1 with high concentration (3,045 ng/ml), resulted in linear regression equations with a coefficient of correlation higher than 0.99 (Figs. 1, 2). Addition of clusterin to urine samples resulted in recovery greater than 78% in all cases.
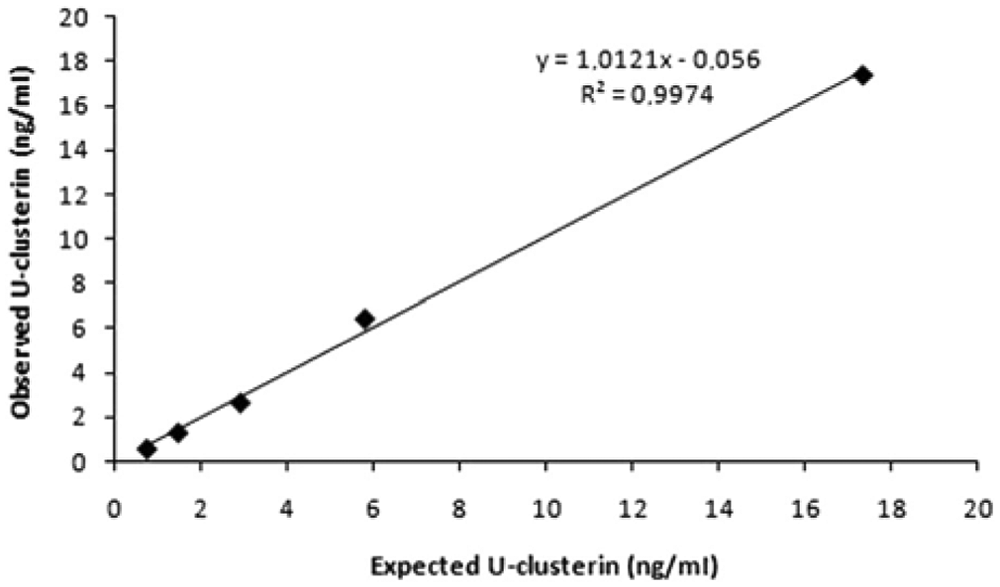
Linearity under dilution of 1 canine urine sample with low urinary clusterin (U-clusterin) concentration.
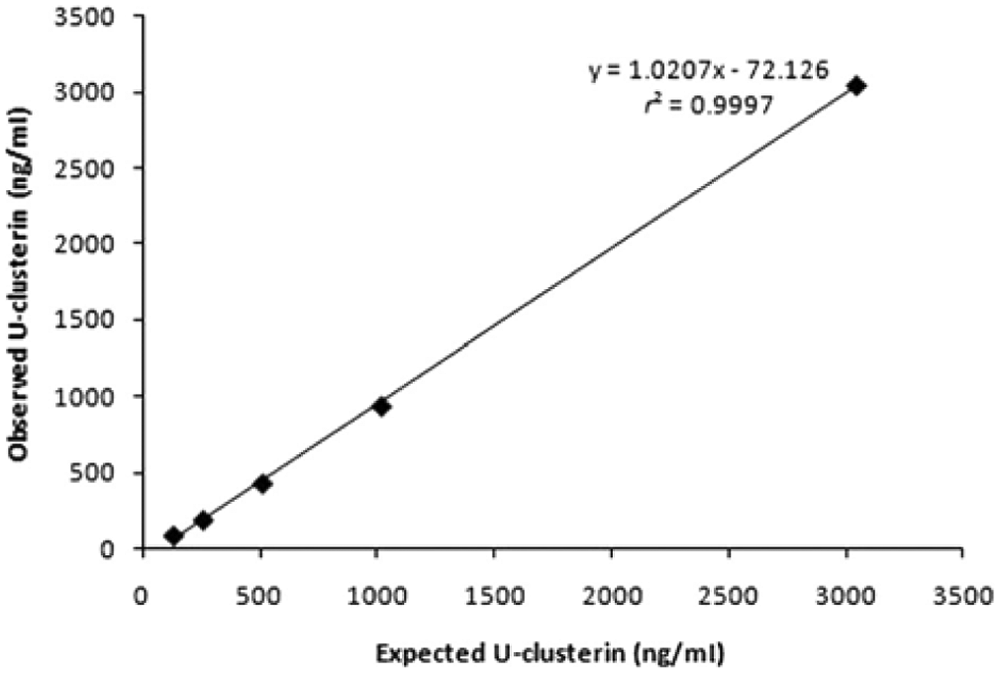
Linearity under dilution of 1 canine urine sample with high urinary clusterin (U-clusterin) concentration.
Urinary clusterin concentrations in the dogs of the study
Results for U-clusterin concentration, the UCL/Cr ratio, and the UPC ratio in the control and leishmaniasis groups are presented in Figures 3–5, respectively. There were statistically significant differences for U-clusterin between healthy dogs (38.50 ng/ml) and groups II (703.6 ng/ml), III (2,336 ng/ml), IV (4,750 ng/ml), and V (4,056 ng/ml), but there were no statistically significant differences between group I (65.54 ng/ml) and healthy dogs. In addition, there were statistically significant differences between group I and groups II–V for U-clusterin (P < 0.001).
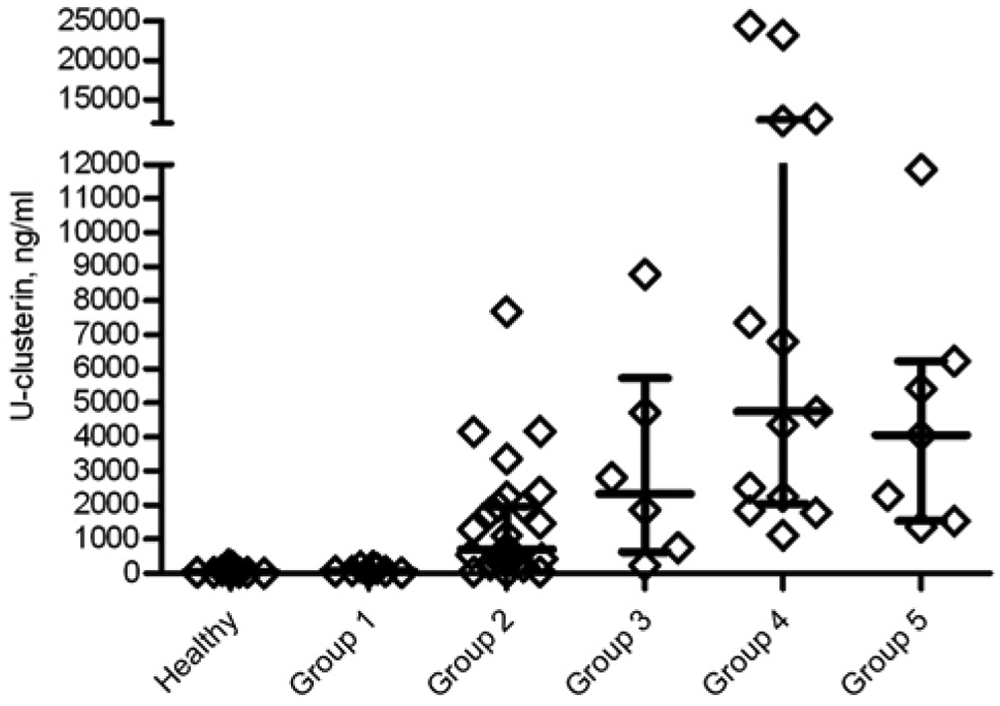
Urinary clusterin (U-clusterin) concentrations in control and leishmaniasis groups. Each diamond represents the U-clusterin concentration of each dog, while the median, 25th, and 75th percentiles are shown using lines, respectively.
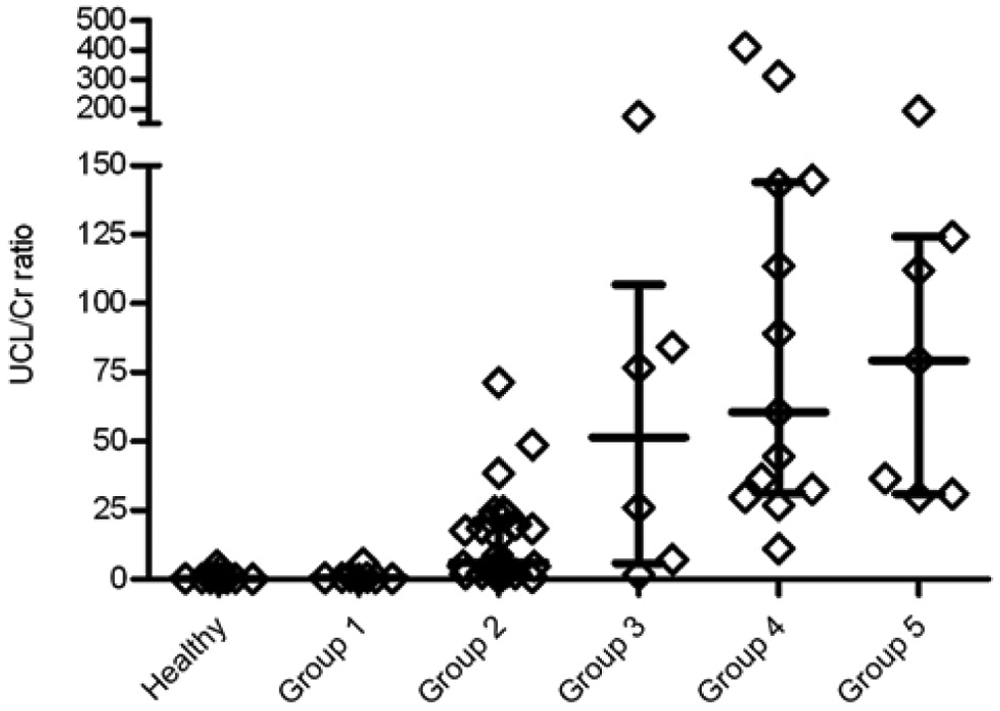
Urinary clusterin-to-creatinine (UCL/Cr) ratio in control and leishmaniasis groups. Each diamond represents the UCL/Cr ratio of each dog, while the median, 25th, and 75th percentiles are shown using lines, respectively.
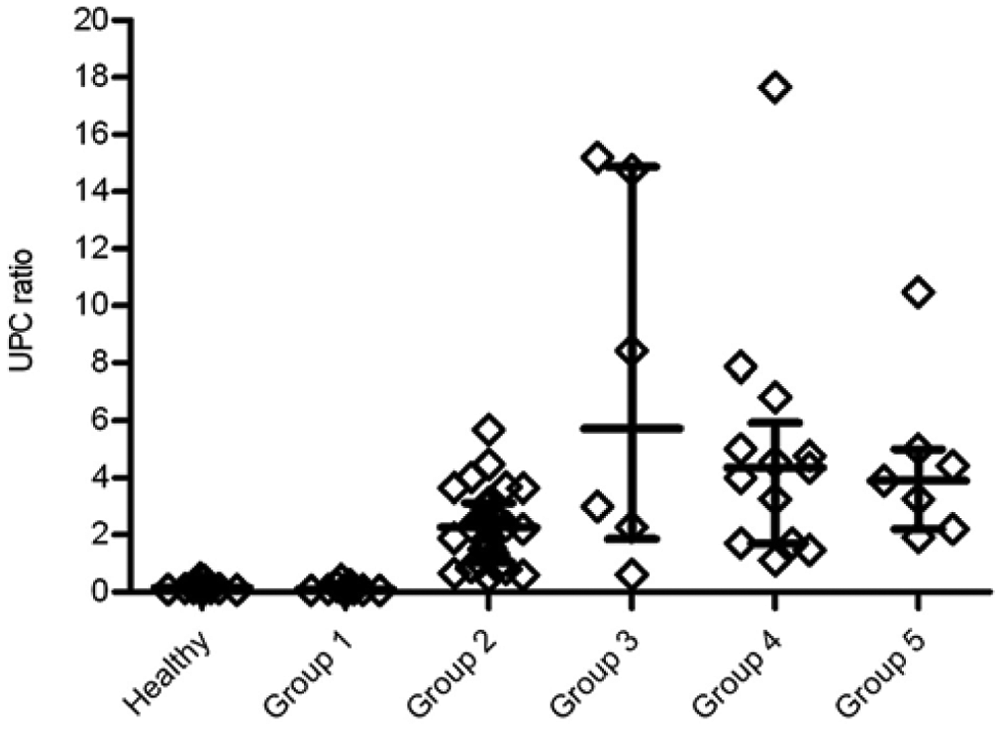
Urinary protein-to-creatinine (UPC) ratio in control and leishmaniasis groups. Each diamond represents the UPC ratio of each dog, while the median, 25th, and 75th percentiles are shown with lines, respectively.
The UCL/Cr values differed statistically between healthy dogs (0.27) and groups II (6.13), III (51.38), IV (60.5), and V (79.26), but there were no statistically significant differences between group I (0.51) and healthy dogs. There were statistically significant differences between group I and groups II (P < 0.01), III, IV, and V (P < 0.001). In addition, this ratio showed a tendency to increase with the severity of renal damage.
The UPC values showed statistically significant differences between healthy dogs (0.14) and groups II (2.27), III (5.72), IV (4.63), and V (3.9), but there were no statistically significant differences between group I (0.09) and healthy dogs. In the dogs with leishmaniasis, there were statistically significant differences between group I and the rest of the groups and between group II and groups III and IV (P < 0.05). The UPC values displayed a tendency to increase in groups I–III that did not appear in groups IV and V (Fig. 5). The correlation analysis showed a significant correlation between UCL/Cr ratio and UPC ratio, with a Spearman correlation coefficient of 0.86.
Discussion
Results of the present study indicate that the direct sandwich EIA can be used successfully to measure canine U-clusterin concentration and that this protein increases in the urine of dogs with CKD. The analytical validation of the assay showed that U-clusterin concentrations could be measured reliably using the canine-specific direct sandwich EIA. Two steps that should be carried out in the assay include the 1:2 dilution of urine with a conservative solution to avoid clusterin degradation that can occur at a rate of up to 50% per month after storage at –20ºC (data not shown) and a second dilution to achieve an absorbance value within the analytical range of the assay. If this assay is to be used in routine practice, a 1:300 dilution is recommended. Sample values below the detection limit should be considered as samples with low clusterin values that would correspond with no kidney damage.
Leishmaniasis was used as a natural model of CKD in the present study because it is a very common disease in the Mediterranean area and is associated with a high prevalence of kidney disease. 6 Early leishmaniasis produces glomerular disease, which is considered a limitation of its use as a model of CKD, whereas clusterin has been indicated as a marker of tubular disease. However, the tubules are also injured in leishmaniasis by inflammation-associated immune complex deposition and by reduced perfusion by peritubular capillaries, leading to tubular and interstitial damage.3,19,27,30 In contrast, there are reports indicating that U-clusterin is considered a general biomarker of renal injury biomarker (of both glomerular and tubular damage) with no specific nephronal location.7,10
In the current study, increased U-clusterin levels were present in all of the animals in groups II–V, corresponding to IRIS stages I–IV, compared with group I and the healthy group. The concentration of U-clusterin was able to distinguish between dogs without kidney damage and dogs with kidney injury according to the IRIS scheme.
Because increases in U-clusterin were detected in group II, it could be postulated that U-clusterin is more sensitive than SCr. This would be in line with studies indicating that increased U-clusterin concentrations occurred earlier than histopathologic changes in rats and showing that this marker was a better indicator of minimal kidney injury. 8 In addition, U-clusterin levels have been shown to increase before SCr changes are evident in rats treated with gentamicin that produced renal injury. 13 Thus, U-clusterin was more sensitive than SCr in detecting renal injury. 10
Regarding UCL/Cr, as occurred with U-clusterin levels, there were statistically significant differences between group I and groups II–V. In addition, this ratio showed a tendency to increase with the severity of renal damage according to the IRIS staging, which was not observed in the U-clusterin concentration without the correction for creatinine. This fact would indicate the need for correction of the degree of dilution of urine by the urinary creatinine levels for reporting the values of clusterin. The UCL/Cr showed a significant correlation with UPC values. However, the UPC values decreased in groups IV and V, whereas the UCL/Cr values continued to increase in those groups and with the severity of CKD.
To assess if UCL/Cr is sensitive enough to detect early renal disease and evaluate its potential use as an early biomarker, the dogs of groups I and II were subcategorized according to the level of UPC elevation. Group I was subdivided according to a scheme modified from that of the IRIS group (UPC < 0.2 [subgroup 1A] and animals with UPC ≥ 0.2 and ≤ 0.5 [subgroup 1B]), while group II was subdivided according to the scheme proposed by the American College of Veterinary Internal Medicine consensus statement 15 (UPC > 0.5 and < 1 [subgroup 2A], UPC ≥ 1 and < 2 [subgroup 2B], and UPC ≥ 2 [subgroup 2C]). The UCL/Cr median of each subgroup increased with the severity of proteinuria (data not shown). Thus, dogs of group 1B had higher UCL/Cr values, although not statistically significant, than dogs of group 1A, and group 1A also had higher values than the healthy group. This suggests that there were some dogs of groups 1A and 1B with early renal disease and that the UCL/Cr is sensitive enough to detect them. Therefore, it might be postulated that UCL/Cr is more sensitive than UPC to detect kidney damage, although future studies with more animals and a histopathologic analysis should be conducted to confirm this controversial aspect. In addition, subgroups 2A and 2B showed statistically significant lower values than subgroup 2C. This finding supports the idea that UCL/Cr might be a better tool to identify dogs with different degrees of renal damage or function inside the IRIS groups and that UCL/Cr could be used as a potential early biomarker of CKD.
In conclusion, the analytical validation of a species-specific assay for measurement of clusterin in canine urine was performed, showing an adequate analytical performance. Despite the limitation of the current work of not having performed a concurrent histopathologic study, U-clusterin could be considered as a more sensitive biomarker of renal injury than SCr.
Footnotes
Acknowledgements
Juan D. García-Martínez and Asta Tvarijonaviciute both contributed equally to this work. The authors thank Susana Ros and Isabel Rodriguez y Josefa Hernández for their excellent technical services for performing the immunoassays for U-clusterin.
a
Cobas Mira Plus Analyzer, Horiba ABX, Montpellier, France.
b.
Spinreact SAU, San Esteve de Bas, Gerona, Spain.
c.
Spinreact SAU, San Esteve de Bas, Gerona, Spain.
d.
BioVendor-Laboratorní medicina, Brno, Czech Republic.
e.
PowerWave XS, Bio-Tek Instruments Inc., Winooski, VT.
f.
GraphPad Prism version 5 for Windows, Graph Pad Software Inc., San Diego, CA
The author(s) declared no potential conflicts of interest with respect to the research, authorship, and/or publication of this article.
The author(s) received no financial support for the research, authorship, and/or publication of this article.